Upload a chart screenshot to an AI tool and in seconds you'll receive a tidy verdict: trend is bullish, resistance here, support there, maybe even a confidence score. It looks authoritative. And that's why you should be careful.
AI Chart Analysis for Beginners: How to Read Trends Without Blindly Following Signals

AI chart tools can label trends, support, and resistance in seconds — but a description isn't a prediction. Here's how to read charts yourself and use AI as a study partner, not an oracle.
6 min read
Explore Finelo AI trading bots
See how AI bots scan market data, explain setups in plain language, and let you review each practice trade before approving it.
Want to learn more?
See how AI bots scan market data, explain setups in plain language, and let you review each practice trade before approving it.
Try AI botsExplore Finelo's 28-day challenges
Turn learning into a daily habit with guided challenge paths.
AI chart analysis can be a genuinely useful learning tool, a way to understand what's on a chart and why traders care about it. It becomes a problem the moment you treat its output as a prediction instead of an explanation. The chart doesn't know the future, and neither does the AI reading it.
This guide takes the skeptical-but-helpful view: what AI can actually notice on a chart, how to read trends and levels yourself, and, most importantly, the questions to ask so a chart tool teaches you instead of just telling you what to do.
What AI chart analysis means
Chart analysis AI is software that uses pattern recognition to describe what's on a price chart in plain language. Point an AI chart analyzer at a candlestick chart and it can name the trend direction, mark likely support and resistance, read common indicators, and flag shapes it thinks it recognizes.
It's essentially AI technical analysis: the same technical analysis for beginners concepts a human learns, applied by a model to an image or data feed. Think of chart analysis AI as a fast, tireless study partner that can label a chart and explain the vocabulary, not an authority that knows what happens next.
If you want the broader picture of where this fits, our guide to AI trading for beginners covers the wider landscape.
What AI can notice on a chart
Used as a describer, AI is legitimately helpful. Here's the kind of thing AI stock analysis and AI market analysis tools can surface from a chart:
| AI can often flag | What that means |
|---|---|
| Trend direction | Whether price is broadly up, down, or sideways |
| Support and resistance | Price levels where the market has reacted before |
| Candlestick structure | The shape and rhythm of recent bars |
| Technical indicators | Common readings like RSI, MACD, EMA, and other moving average lines |
| Volatility | How much price is swinging around |
| Possible chart patterns | Shapes its pattern recognition thinks it sees, with false positives |
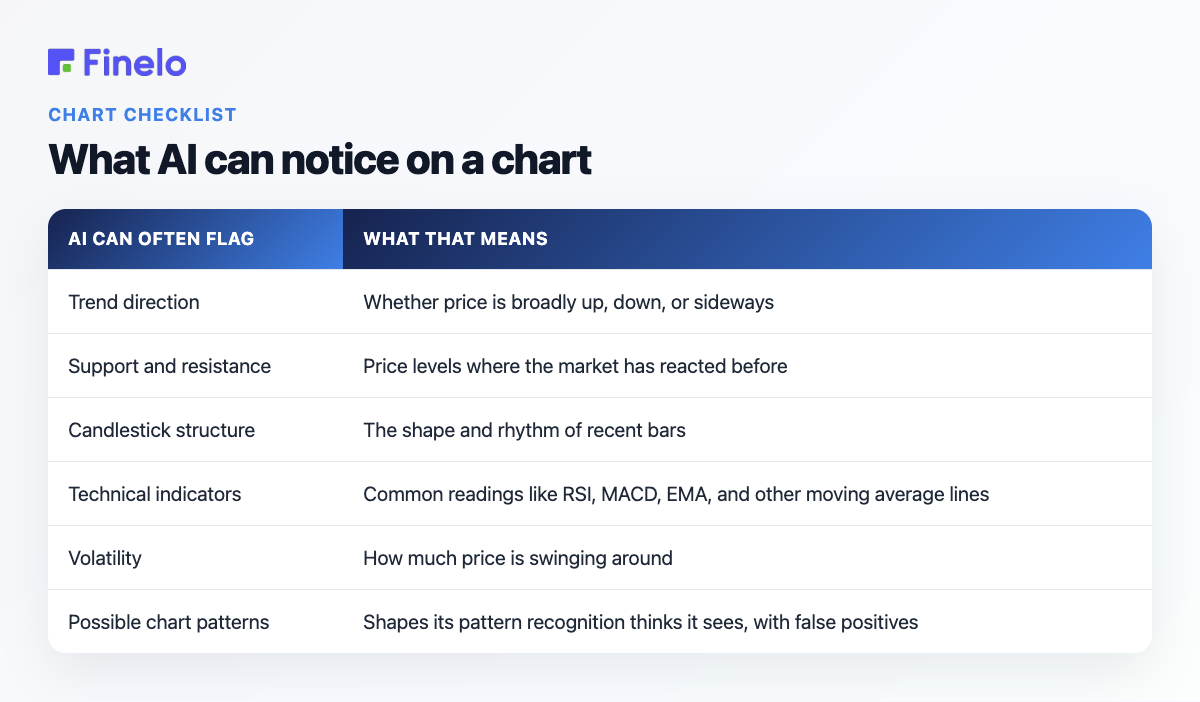
Some tools also overlay Fibonacci levels or volume. All of this is AI stock chart analysis doing what it's good at: labeling and describing. What it hands you is a starting point for thought, not a conclusion.
One caveat belongs right here, though: these tools also "see" patterns that aren't there. A model asked to find a pattern will almost always find one, the way people see faces in clouds. So "the AI spotted a head-and-shoulders" really means it matched a shape, not that the shape will behave like the textbook says. Helpful describer, unreliable fortune-teller.
Trend, volatility, support and resistance explained simply
To use any of that, you need the concepts yourself, otherwise you're just trusting labels. Here's the beginner version.
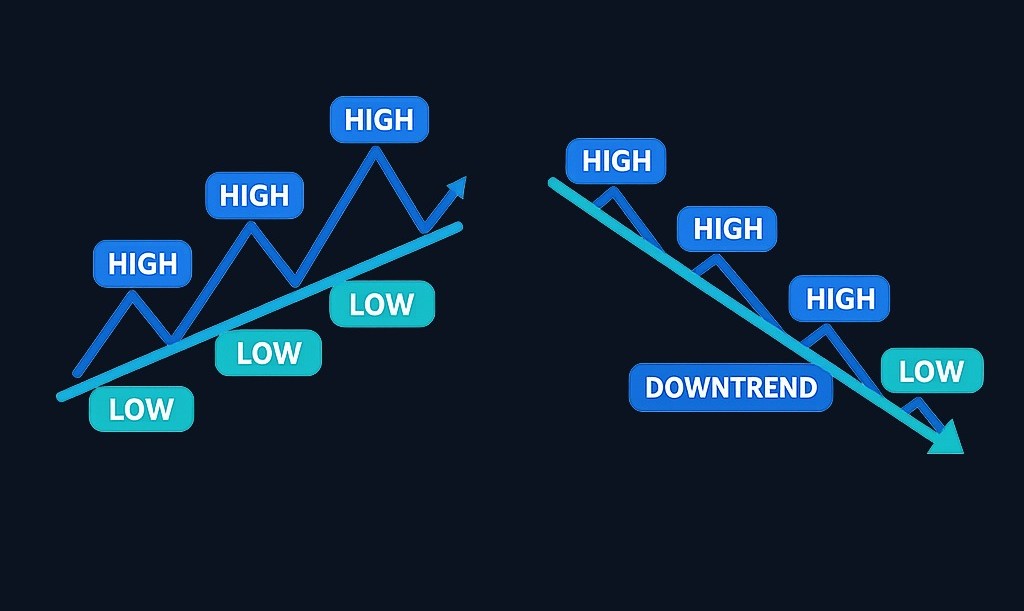
Trend is direction over time. A series of higher highs and higher lows is an uptrend; lower highs and lower lows is a downtrend; choppy and directionless is a sideways market. A trendline is just a line drawn along those highs or lows to make the direction visible.
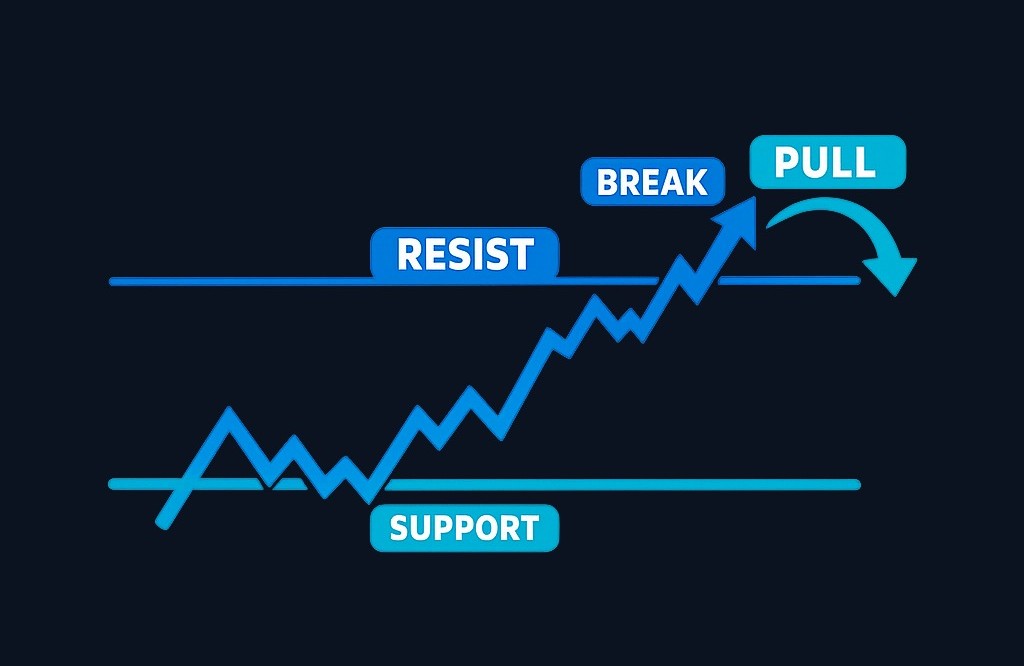
Support and resistance are memory. A support level is a price where buyers have stepped in before; a resistance level is where sellers have. When price pushes through one, that's a breakout; when it drifts back toward a level after moving away, that's a pullback. Neither is a promise, levels break all the time.
Volatility is how far and fast price moves. High volatility means bigger swings, which widens the risk zone around any decision. And all of this depends on timeframe: a chart can look like a clean uptrend on the weekly view and a mess on the five-minute one. Change the timeframe and you often change the whole story, which is exactly the kind of thing an AI label can quietly gloss over.
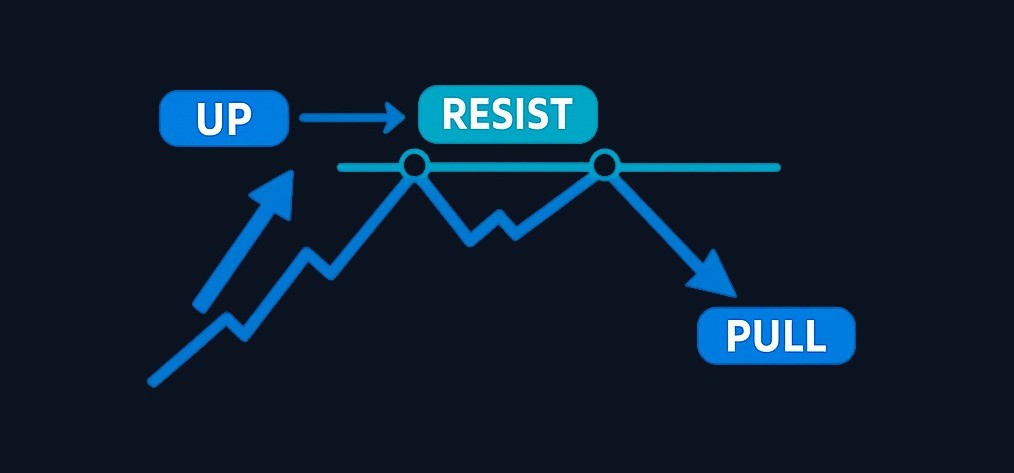
Picture a generic chart, no ticker attached: price climbs for a while, stalls near a round number where it stalled twice before, then eases back a little. In plain terms, that's an uptrend meeting resistance, followed by a pullback — the vocabulary simply describing behavior. Once you can narrate a chart like that yourself, you gain the most valuable skill here: the ability to notice when an AI's tidy label doesn't match what you're actually looking at.
Explore Finelo AI trading bots
See how AI bots scan market data, explain setups in plain language, and let you review each practice trade before approving it.
Why AI chart analysis is not a trading signal
This is the section that matters most, so here it is plainly: a chart description is not a prediction, and it is not a trading signal you should act on blindly.
AI reads the past and present of a chart. It cannot read the future, because the future depends on things no chart contains — earnings, market news, a policy change, the context around the price. A model can produce a confidence score, but confidence is not accuracy. A tool can be 90% "confident" and completely wrong, because it's measuring how well a pattern fits, not what the market will do next.
Then there are false signals: patterns that look textbook and then fail, which happens constantly in real markets. This is why the honest use of AI trading signals is as prompts for your own thinking, not orders to follow. If a tool tells you "buy signal detected," the right response isn't to buy, it's to ask why, on what timeframe, and what would prove this wrong. A signal you can't interrogate is a signal you shouldn't trust.
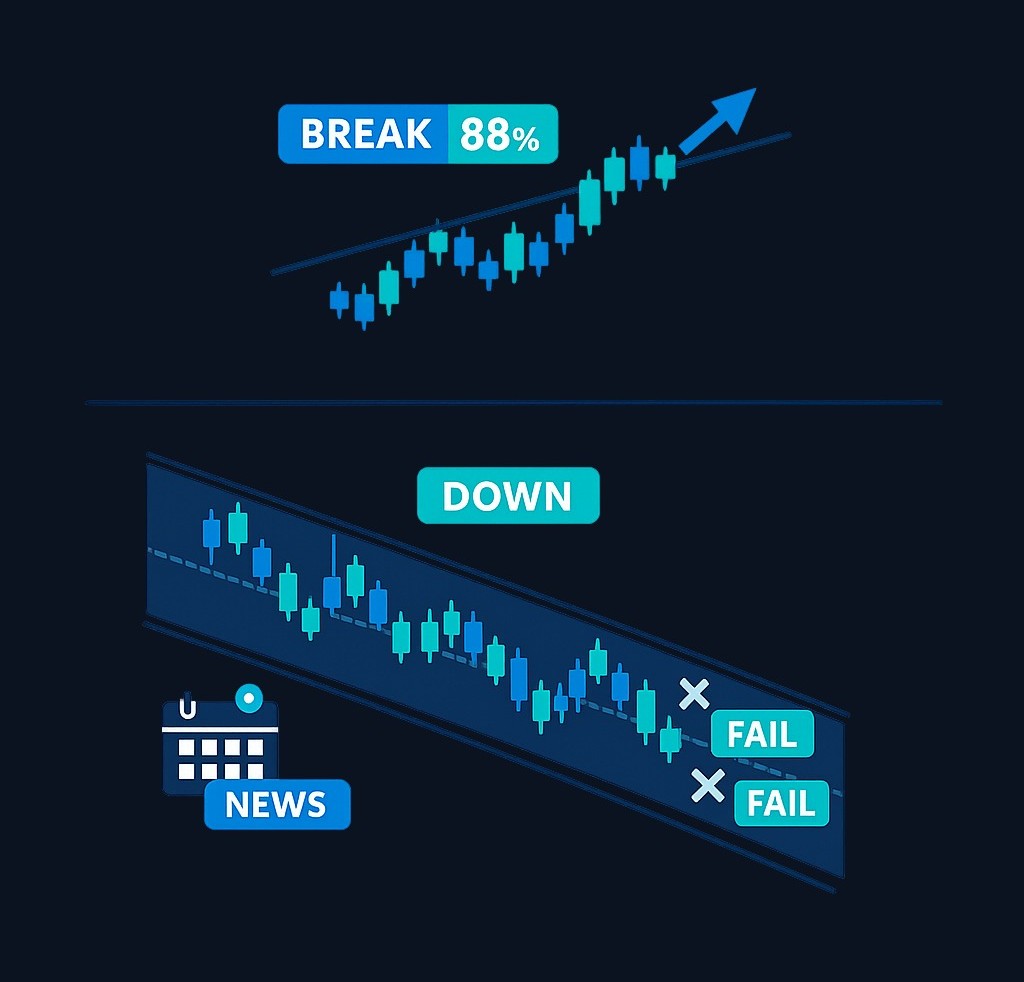
Here's how that goes wrong in practice. An AI labels a chart "bullish breakout, 88% confidence." The shape genuinely does look like a breakout. But the tool didn't know earnings land tomorrow, that the "breakout" is on a five-minute view sitting inside a larger downtrend, or that the same pattern failed twice last week. The number felt precise; the picture was incomplete. That gap, a confident label wrapped around missing context, is exactly where beginners get hurt.
Questions beginners should ask an AI chart tool
The fastest way to make a chart tool teach you instead of just answer you is to change your questions. Ask for explanation and scenarios, not verdicts.
| Instead of asking… | Ask… |
|---|---|
| "Should I buy this?" | "What trend is visible, and on what timeframe?" |
| "Will this go up?" | "Where are the support and resistance levels?" |
| "What's the signal?" | "What scenario could unfold, and what would invalidate it?" |
| "Is this a good chart?" | "What context or market news might this chart be missing?" |
The right-hand column is scenario analysis: exploring what could happen and what you'd watch, instead of demanding one answer. It keeps you as the decision-maker and turns the AI into an explainer. And whatever it returns, add one more step — human review. You're the one who decides whether its reasoning holds up.
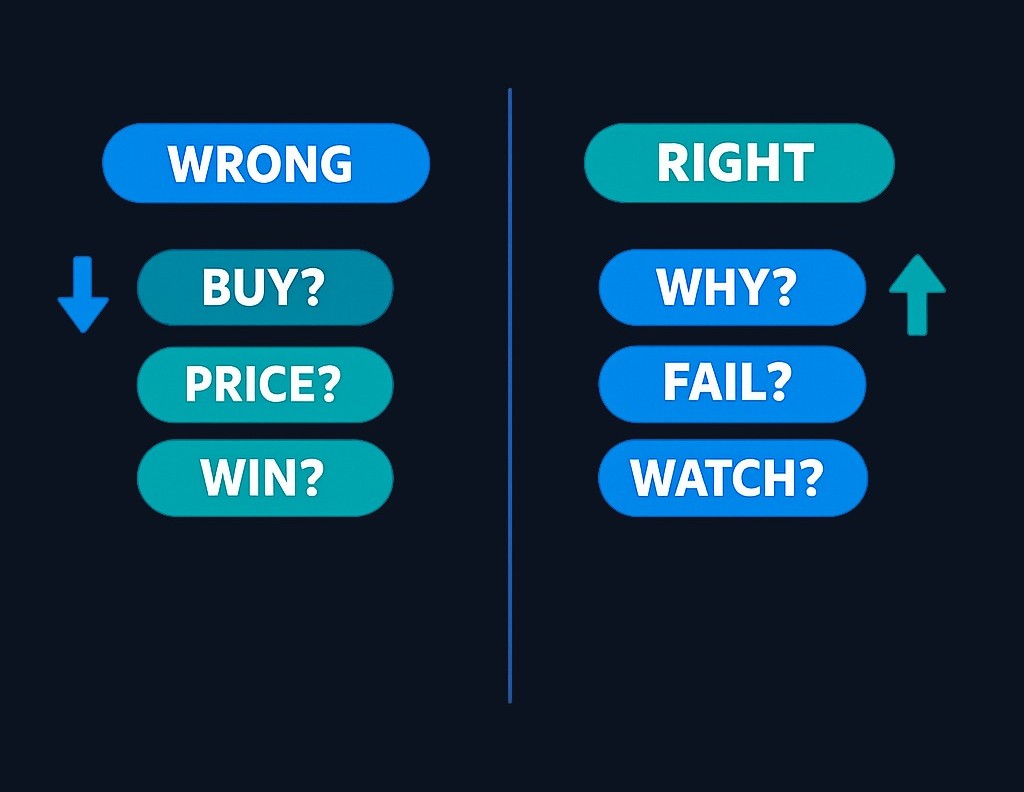
Practicing support and resistance AI questions like these, on generic charts, builds a skill that outlasts any single tool.
Common mistakes when using AI chart tools
Most bad outcomes come from a handful of habits:
- Blindly following outputs. Treating a label as an instruction is the core mistake this whole article is about.
- Ignoring timeframe. A "breakout" on a one-minute chart and a "breakout" on a daily chart mean very different things.
- Cherry-picking. Uploading ten chart screenshots until one gives the answer you wanted isn't analysis; it's fishing.
- Trusting the confidence score. A high confidence score measures pattern fit, not the future. Don't let it substitute for judgment.
- No risk plan. Even a genuinely useful read is worthless if you haven't decided your size and your exit first.
- Skipping context. A chart with big market news hanging over it is a chart the AI is reading with one eye closed.
Notice the theme: the tool isn't the problem. Using it without your own judgment is. The fix for every item on this list is the same: slow down, add your own read of the chart, and never let a label make the decision for you.
How Finelo's AI Chart Analyzer supports learning
This is the lane Finelo builds for: chart AI as a tutor, not a tip line. The AI Chart Analyzer is designed to help you understand a chart, what the trend and levels are, what a pattern means, what scenarios are worth watching, rather than to hand you a verdict to act on.
Paired with Finelo AI and the structured AI Trader Challenge, the point is to build the habit of asking better questions: what's the trend, what's the level, what would prove this wrong, what's missing. That's candlestick chart analysis AI used the way it actually helps, as AI-assisted analysis that teaches you to read a chart, not a machine that reads it for you.
Use Finelo AI to understand charts and scenarios and to practice the questions above.
Finelo is an educational product, not a brokerage. Brokerage connection availability depends on your region. The simulator uses virtual funds and real market data, and final trading and investing decisions are yours, made through your own brokerage account when you choose to act. This article is for education and is not financial advice.
Frequently asked questions
Can AI analyze stock charts?
Yes, to a point. AI tools can identify visible patterns, mark support and resistance, read common indicators, and outline possible scenarios from a chart. What they produce is a description to review critically, not a verdict. Treat the output as a starting point for your own analysis, and always check the timeframe and context the tool may have ignored.
Is AI chart analysis accurate?
Accuracy varies with the data, the model, and the market context, and it should never be treated as a guarantee or a prediction. AI can describe what a chart shows and misread it just as easily, especially when patterns look clean but the wider context doesn't. A confidence score reflects pattern fit, not what the market will actually do.
Should beginners follow AI trading signals?
No. Beginners should use AI outputs to learn and to ask sharper questions, not to follow signals blindly. A signal is at best a prompt to investigate: why this, on what timeframe, and what would invalidate it. Following an output you can't explain is how beginners hand their judgment to a tool that has no accountability for the result.
What chart concepts should beginners learn first?
Start with trend direction, support and resistance, volatility, and timeframe, then add volume and a couple of basic indicators like a moving average and RSI. Those fundamentals let you sanity-check anything an AI tool tells you. Learning the concepts first is what turns an AI chart tool from a crutch into a genuinely useful study aid.
AI TradingChart AnalysisBeginnerTechnical Analysis
Explore Finelo AI trading bots
See how AI bots scan market data, explain setups in plain language, and let you review each practice trade before approving it.
About the author
Finelo Team
The Finelo Team creates practical investing and trading education designed to help beginners learn faster with structured challenges, simulator practice, and bite-sized lessons.
Keep reading — Related articles
AI Trading
ChatGPT for Stock Trading: What It Can and Can't Do
ChatGPT can help you learn stocks, summarize filings, and draft research prompts — but it cannot trade for you, predict prices, or be trusted blindly on numbers. Here's an honest beginner guide to using it as a research assistant.
Finelo Team

AI Trading
New in Finelo: AI Trading Bots That Find Setups for You
Finelo's newest feature — AI bots that scan real market data around the clock, explain every setup in plain language, and wait for your approval. Here's what's new and how to try it.
Finelo Team
AI Trading
Does AI Trading Work? What Beginners Should Know Before Trusting a Bot
Two camps say bots either print money or scam everyone. The truth is boring and specific: it depends on the strategy, the data, and whether a human is still paying attention.
Finelo Team


