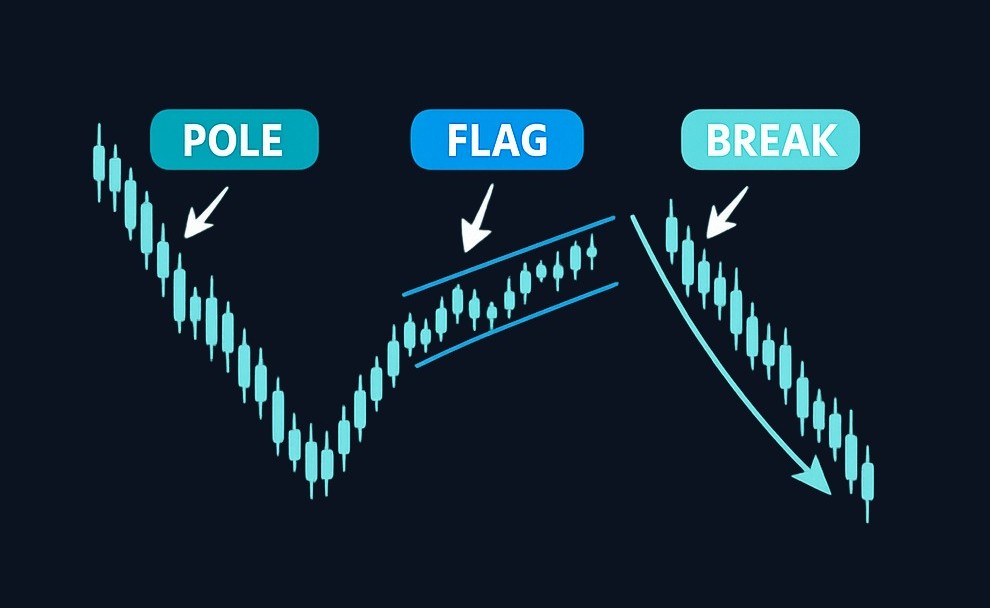
A bear flag pattern is a bearish continuation chart pattern: price falls sharply to form the “flagpole,” then pauses in a smaller consolidation that often slopes upward before sellers regain control and price breaks lower. The pattern gets its name from the way it resembles an inverted flag on a pole, with the initial decline forming the pole and the consolidation forming the flag bear flag pattern overview. Traders use it to study downside momentum, plan risk, and avoid mistaking a temporary pause for a full trend reversal.
The Bear Flag Pattern: Definition, Analysis, and Trading Strategies: Use Cases, Benefits, and Next Steps

A bear flag pattern is a bearish continuation chart pattern: price falls sharply to form the “flagpole,” then pauses in a smaller consolidation that often slopes upward before sellers regain control and price breaks lowe...
11 min read
Practice trading with Finelo
Practice in a simulator, learn with bite-sized lessons, and build confidence before risking real money.
Want to learn more?
Practice in a simulator, learn with bite-sized lessons, and build confidence before risking real money.
Explore FineloExplore Finelo's 28-day challenges
Turn learning into a daily habit with guided challenge paths.
This page is for learners who want a practical, risk-aware framework for identifying bear flags, planning entries and exits, and knowing when not to trade the setup.
Introduction to the Bear Flag Pattern
The bear flag pattern appears after a strong downward move. That first selloff shows the market moving decisively in one direction. Afterward, price consolidates as the market “catches its breath,” forming the flag portion of the pattern. This pause does not automatically mean the trend has reversed; in a classic flag structure, it represents temporary equilibrium before the prior trend may continue flag pattern structure.
The pattern is useful because it separates two different ideas:
- Trend direction: the prior move is bearish.
- Trade timing: the consolidation gives traders a defined area to watch for a breakdown.
A bear flag is not a prediction tool by itself. It is a chart structure that can help organize a trading plan. The key is confirmation: traders generally look for price to break below the flag area before treating the setup as active. Without that breakdown, the consolidation can keep drifting, fail, or turn into a different pattern.
Characteristics of the Bear Flag Pattern
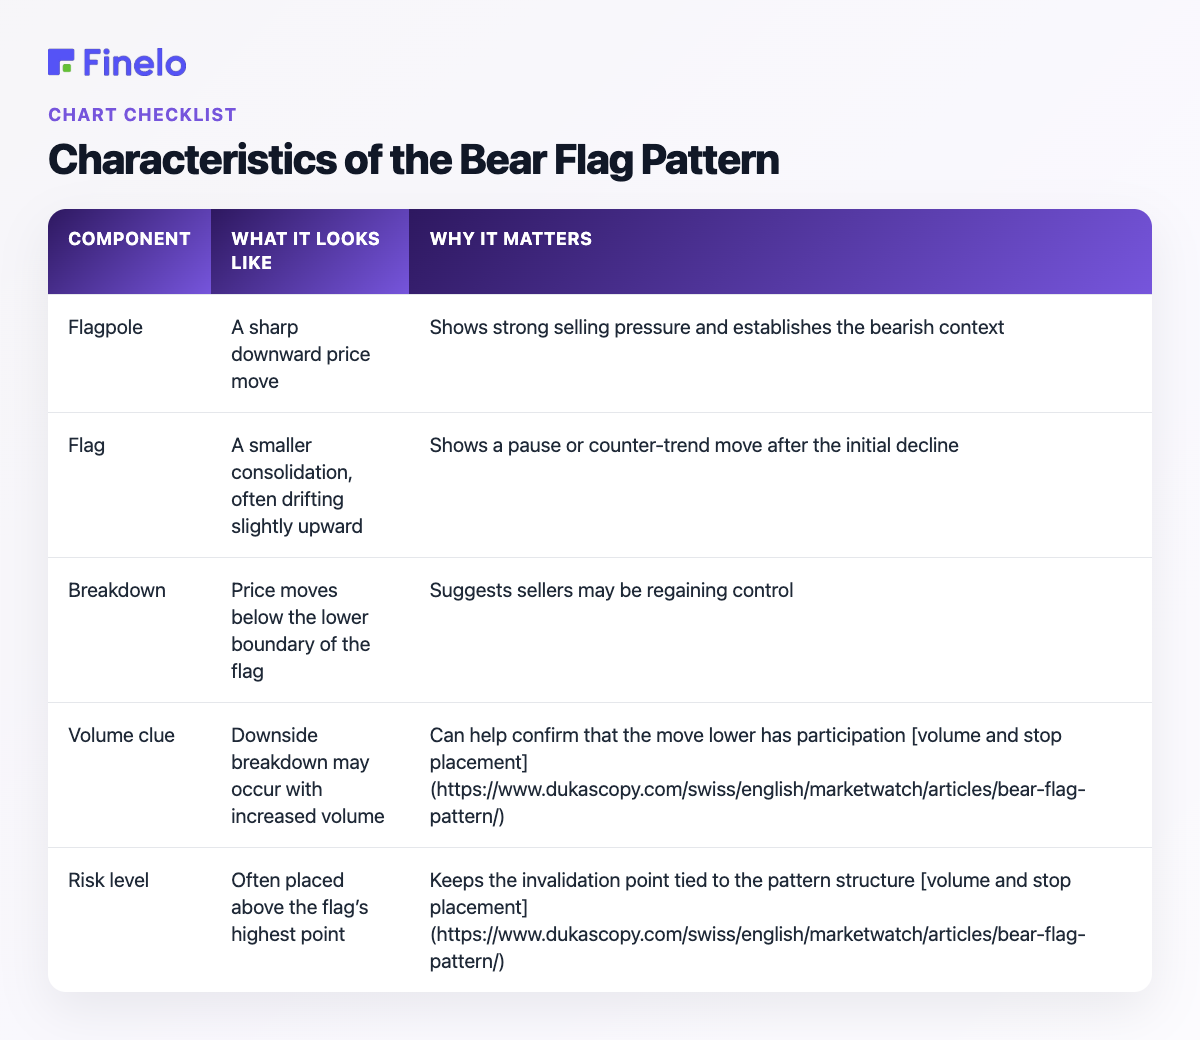
A bear flag has three core parts: the flagpole, the flag, and the breakdown.
| Component | What it looks like | Why it matters |
|---|---|---|
| Flagpole | A sharp downward price move | Shows strong selling pressure and establishes the bearish context |
| Flag | A smaller consolidation, often drifting slightly upward | Shows a pause or counter-trend move after the initial decline |
| Breakdown | Price moves below the lower boundary of the flag | Suggests sellers may be regaining control |
| Volume clue | Downside breakdown may occur with increased volume | Can help confirm that the move lower has participation volume and stop placement |
| Risk level | Often placed above the flag’s highest point | Keeps the invalidation point tied to the pattern structure volume and stop placement |
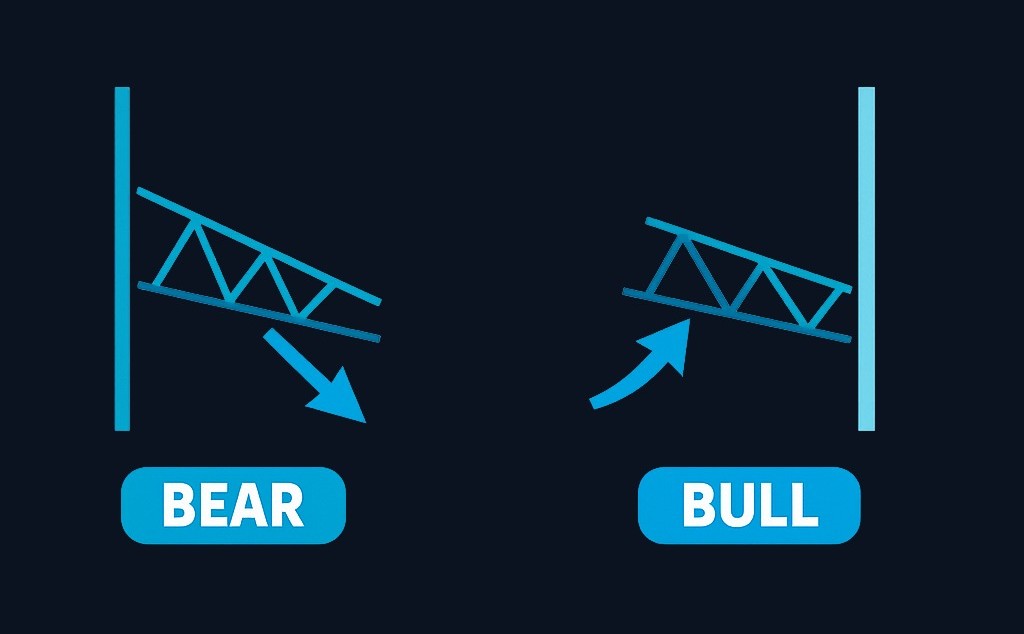
The bear flag differs from a bull flag in both direction and implication. A bear flag emerges during a downtrend after sharp selling pressure, while a bull flag appears during an uptrend after a strong advance bear flag vs bull flag. In a bear flag, the consolidation often slopes upward as short sellers take profits and some buyers test the move; the bearish continuation idea depends on sellers regaining control bear flag consolidation.
How to Identify a Bear Flag Pattern
A clean bear flag is not just any downward move followed by sideways price action. Use a structured process so you are not forcing the pattern onto a chart.
Bear flag identification checklist
- Start with the trend: Is there a clear downward move before the consolidation?
- Find the flagpole: Did price fall sharply enough to stand out from normal back-and-forth movement?
- Define the flag: Is price consolidating in a smaller channel or range after the selloff?
- Check the slope: Is the consolidation flat or slightly upward rather than strongly bullish?
- Wait for confirmation: Has price broken below the lower boundary of the flag?
- Review volume if available: Did participation increase on the downside break? Volume often increases on a bear flag breakdown volume and breakdown.
- Set invalidation before entry: Where would the pattern be considered wrong?
A common mistake is identifying the flag too early. If price is still falling sharply, the flag has not formed yet. If price is rising strongly and retracing most of the prior decline, the setup may no longer represent a tight bearish continuation pattern. The best candidates are usually compact: a decisive drop, a controlled pause, and a clear level where the pattern either confirms or fails.
Trading Strategies for Bear Flags
Bear flag strategies are built around the same principle: do not assume the continuation will happen; define what must occur first. The most common approach is a breakdown strategy, where the trader waits for price to move below the flag’s lower boundary before considering a short trade or bearish position.
A practical framework looks like this:
- Context: Price has already moved lower and the broader setup remains bearish.
- Pattern: A flag forms after the initial decline.
- Trigger: Price breaks below the flag support area.
- Risk: The invalidation level is set before entering.
- Target: The trader estimates a reasonable downside objective, often using the flagpole as a reference.
Some traders also use a retest approach. Instead of entering immediately on the breakdown, they wait to see whether price breaks lower, then returns to test the broken flag boundary from below. This can reduce the chance of chasing an extended move, but it also creates a trade-off: price may not retest, and the opportunity may pass.
A third approach is to use the pattern as a filter, not a standalone trade signal. For example, a trader might only act on bear flags that align with a broader downtrend, a weak sector, or another form of bearish confirmation. This can help reduce impulsive trades, although it does not remove risk.
Decision table: match your intent to the next step
| Your intent | What to focus on | Sensible next step |
|---|---|---|
| “I’m learning the pattern” | Structure: flagpole, flag, breakdown | Practice marking examples on historical charts before considering live trades |
| “I want to trade it” | Entry trigger, stop placement, target logic | Write a rule-based plan and test it before risking capital |
| “I keep seeing false breaks” | Confirmation and invalidation | Wait for clearer breakdowns or retests instead of entering during consolidation |
| “I’m comparing trading education options” | Clarity, risk warnings, practice structure | Choose learning resources that explain both setup quality and failure scenarios |
| “I’m unsure if this is a bear flag” | Pattern fit | Avoid the trade if the decline, consolidation, or breakdown is unclear |
For structured investing and trading education, you can continue learning with Finelo when you are ready to study chart patterns in a broader risk-aware context.
Practice trading with Finelo
Practice in a simulator, learn with bite-sized lessons, and build confidence before risking real money.
Stop-Loss and Target Placement
Stop-loss placement should be linked to the pattern’s invalidation point. For a bear flag, the common structural stop is above the flag’s highest point because a move above that area weakens the bearish continuation idea stop-loss placement.
That does not mean every trader should use the exact same stop. The right risk level depends on position size, account rules, timeframe, market volatility, and whether the entry is immediate or based on a retest. The important principle is consistency: define the risk before entering, not after price moves against you.
For targets, traders often use the length of the flagpole as a reference because the decline after completion may mirror or exceed the original flagpole in classic descriptions of the pattern flagpole target concept. This should be treated as an estimate, not a guarantee. Markets can reverse early, stall before the measured move, or move beyond it.
A simple educational example:
- A stock drops from 100 to 90, creating a 10-point flagpole.
- It then consolidates between 90 and 93.
- A trader watches for a break below 90.
- If the trader enters after the breakdown, the structural stop might be above 93.
- A measured-move reference could project roughly 10 points below the breakdown area, but the trader may adjust based on nearby support, volatility, and risk limits.
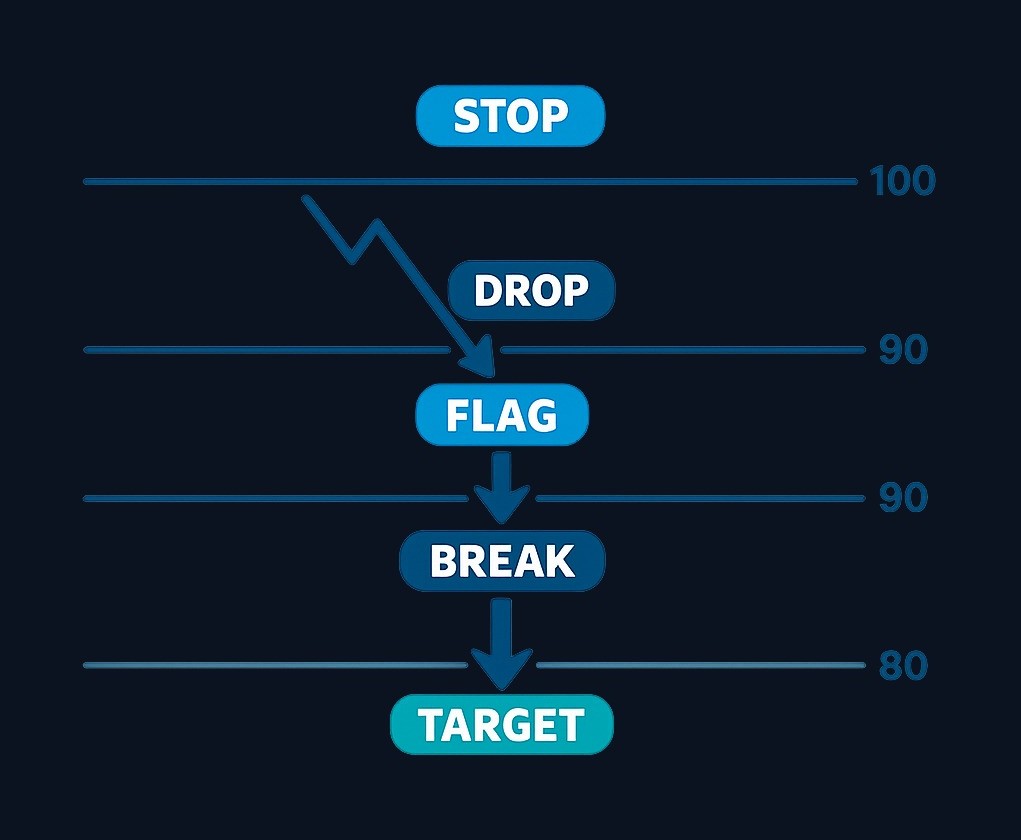
The example is not a recommendation. It shows how the pattern can organize a plan: entry, invalidation, and target are all connected to visible chart structure.
Example Framework: Reading a Bear Flag Without a Chart
Because bear flags are visual, the best way to learn them is to label the parts step by step. Imagine the following sequence:
- Day 1: Price sells off sharply after negative momentum.
- Day 2: Price stops falling and begins moving in a tight upward channel.
- Day 3: The upward channel remains small compared with the initial decline.
- Day 4: Price breaks below the lower edge of the channel.
- After the break: Volume expands, suggesting stronger participation in the downside move.
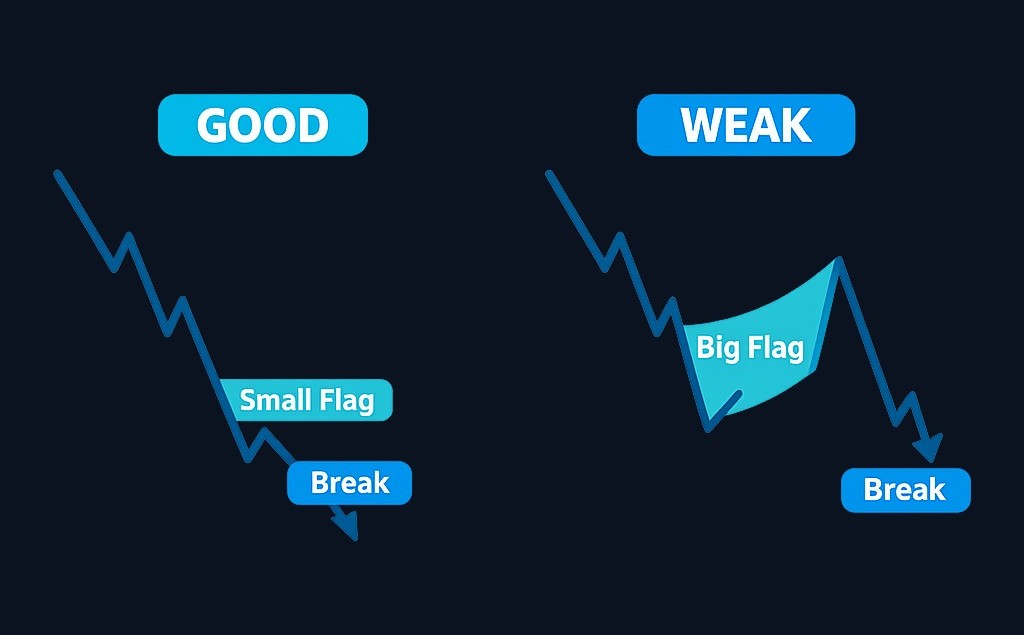
This sequence contains the basic bear flag logic: a strong decline, a controlled counter-trend pause, and a downside break. The most important detail is proportion. If the “flag” becomes too large or retraces too much of the original drop, the pattern becomes less convincing as a bearish continuation setup.
A useful practice exercise is to review old charts and mark three versions of the pattern:
- Clean bear flag: clear selloff, compact flag, decisive breakdown.
- Messy bear flag: identifiable structure, but unclear boundaries or weak confirmation.
- Failed bear flag: price breaks upward instead of down or invalidates the setup.
Studying failed patterns is as important as studying textbook examples. It trains you to think in probabilities, not certainties.
Common Mistakes to Avoid
The biggest bear flag mistakes usually come from seeing what you want to see rather than what the chart shows.
Entering before confirmation. A consolidation after a decline is not automatically a bear flag trade. If price has not broken below the flag, the setup is still forming.
Ignoring the broader trend. A bear flag is a bearish continuation pattern. If the broader context is not bearish, the signal may be less meaningful.
Using stops that do not match the setup. Placing a stop randomly can make the trade plan inconsistent. The pattern logic points to the area above the flag’s highest point as a common invalidation zone stop-loss placement.
Assuming the measured move must happen. The flagpole can help estimate a target, but markets do not owe traders a full measured move. Targets should be balanced with risk, liquidity, and nearby support levels.
Confusing a bear flag with a reversal. In a bear flag, the consolidation is typically a pause within a bearish move. A true reversal requires stronger evidence that buyers have taken control.
Overlooking volatility. In fast markets, breakdowns can reverse quickly. Waiting for confirmation, using position sizing rules, and defining invalidation can help reduce emotional decision-making.
Conclusion and Next Steps
The bear flag pattern is a bearish continuation setup built from three parts: a sharp decline, a smaller consolidation, and a downside breakdown. Its value is not that it predicts the future with certainty, but that it gives traders a repeatable way to structure decisions around price action, confirmation, stop placement, and target planning.
If you are new to technical analysis, focus first on recognition. Mark the flagpole, draw the flag boundaries, and wait for the breakdown. If you are more experienced, refine your process by comparing clean, messy, and failed examples. In both cases, treat the pattern as one input within a broader risk-managed plan, not as personalized financial advice.
FAQs about Bear Flag Patterns
What confirms a bear flag pattern?
A bear flag is generally confirmed when price breaks below the lower boundary of the flag after a sharp prior decline. Increased volume on the downside breakdown can add confirmation because bear flag breakdowns often show higher volume volume confirmation.
What is the difference between a bear flag and a bull flag?
A bear flag forms during a downtrend after sharp selling pressure and points to possible continuation lower. A bull flag forms during an uptrend after a strong advance and points to possible continuation higher bear flag vs bull flag.
Where should a stop-loss go on a bear flag?
A common structural stop-loss for a bear flag is above the flag’s highest point, because a move above that area can invalidate the bearish continuation setup stop-loss placement. Traders should still adjust risk based on their own rules and market conditions.
Is a bear flag reliable in every market?
No chart pattern is reliable in every market. A bear flag can fail, especially when the broader context changes, volatility is high, or the breakdown lacks follow-through. It is best used with confirmation, predefined risk, and a clear plan.
bear flag patternchart analysistrading education
Practice trading with Finelo
Practice in a simulator, learn with bite-sized lessons, and build confidence before risking real money.
About the author
Finelo Team
The Finelo Team creates practical investing and trading education designed to help beginners learn faster with structured challenges, simulator practice, and bite-sized lessons.
Keep reading — Related articles

Chart Analysis
Tick Charts: How They Work, Uses, and Limitations
A tick chart builds each bar (or candle) from a fixed count of market "ticks" — individual trades or quote changes — instead of fixed time intervals. Tick charts therefore compress activity when the market is busy and stretch it when activity is light, helping traders focus on…
Finelo Team
Chart Analysis
Renko Charts: How They Work, Uses, and Limitations
A Renko chart is a price-charting method that draws uniform "bricks" only when price moves by a predefined amount, filtering out small fluctuations to highlight trends and support/resistance zones; unlike time-based candlesticks, Renko bricks form from price movement rather than fixed time intervals TradingView renko description. This guide…
Finelo Team
Chart Analysis
A Complete Guide to Point and Figure Charts
Point and Figure (P&F) charts are a price‑only charting method that records meaningful price moves while ignoring linear time, helping traders spot clean trends, support/resistance, and breakouts. P&F is a price‑focused variant of technical analysis that emphasizes market supply-and-demand visible on a single price picture CME Group.
Finelo Team


