Candlestick reversal patterns in forex are price-action signals that suggest a current move may be losing strength and a new direction could develop. The most common patterns include the hammer, shooting star, engulfing candles, morning star, evening star, piercing line, dark cloud cover, and doji-based reversals. They are not standalone buy or sell signals. A practical approach is to read them in context: first confirm there is an existing trend, then check whether the pattern appears near support, resistance, a moving average, or a momentum shift. Forex traders often combine reversal patterns with support and resistance, moving averages, or momentum readings to filter signals FXOpen.
Candlestick Reversal Patterns in Forex Trading

Candlestick reversal patterns in forex are price-action signals that suggest a current move may be losing strength and a new direction could develop.
13 min read
Practice trading with Finelo
Practice in a simulator, learn with bite-sized lessons, and build confidence before risking real money.
Want to learn more?
Practice in a simulator, learn with bite-sized lessons, and build confidence before risking real money.
Explore FineloExplore Finelo's 28-day challenges
Turn learning into a daily habit with guided challenge paths.
Introduction to Candlestick Reversal Patterns
A candlestick reversal pattern is a candle or group of candles that shows a possible change in market direction. In forex, that usually means a bullish reversal after a decline or a bearish reversal after a rally.
The key word is “possible.” A reversal pattern does not prove the market will turn. It shows a change in the balance between buyers and sellers. For example, if EUR/USD has been falling and then prints a hammer near a prior support area, the candle suggests sellers pushed price lower but buyers recovered enough to close the candle higher than its low. That can be useful information, but it still needs confirmation.
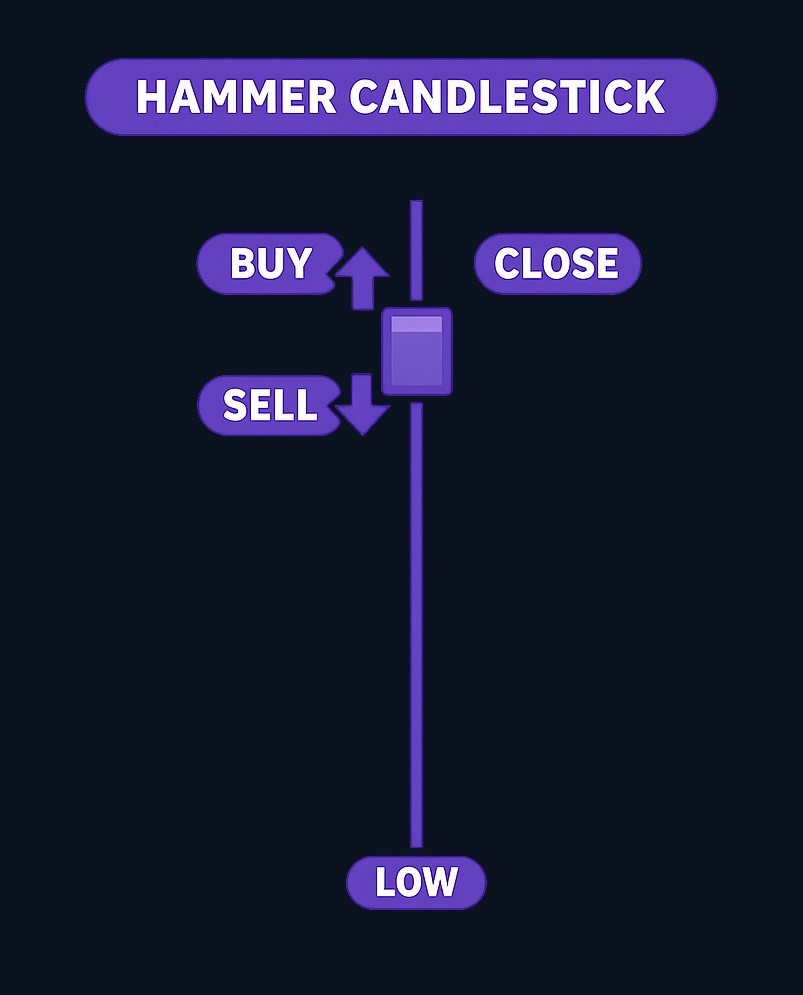
Forex traders pay attention to these signals because the market trades across overlapping weekday sessions, and reversal behavior can appear around liquidity transitions FXOpen. The same idea can be applied across different currency pairs and timeframes, but shorter timeframes tend to produce more noise, so context matters.
Types of Candlestick Reversal Patterns
Candlestick reversal patterns are usually grouped into bullish and bearish patterns. Bullish patterns appear after a downward move and suggest selling pressure may be weakening. Bearish patterns appear after an upward move and suggest buying pressure may be fading.
Common bullish reversal patterns
| Pattern | Where it appears | What it suggests | Simple example |
|---|---|---|---|
| Hammer | After a decline | Sellers pushed price down, but buyers recovered | Price falls into support, then forms a candle with a long lower wick |
| Bullish engulfing | After a decline | Buyers overwhelm the prior candle’s selling pressure | A large green candle closes above the body of the previous red candle |
| Morning star | After a decline | Momentum shifts over three candles | Strong red candle, small indecision candle, strong green candle |
| Piercing line | After a decline | Buyers regain part of the prior bearish candle | Green candle opens lower but closes well into the prior red candle’s body |
| Dragonfly doji | After a decline or support test | Sellers fail to hold lower prices | Open, close, and high are close together with a long lower wick |
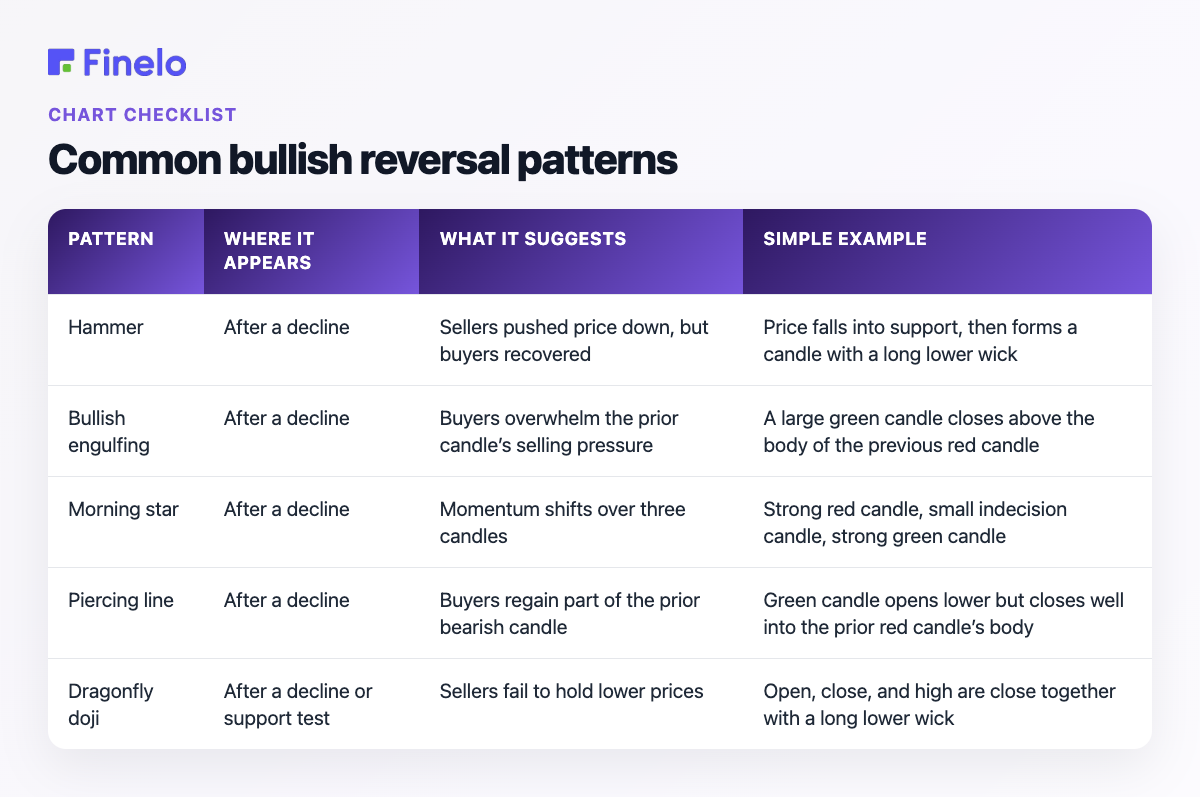
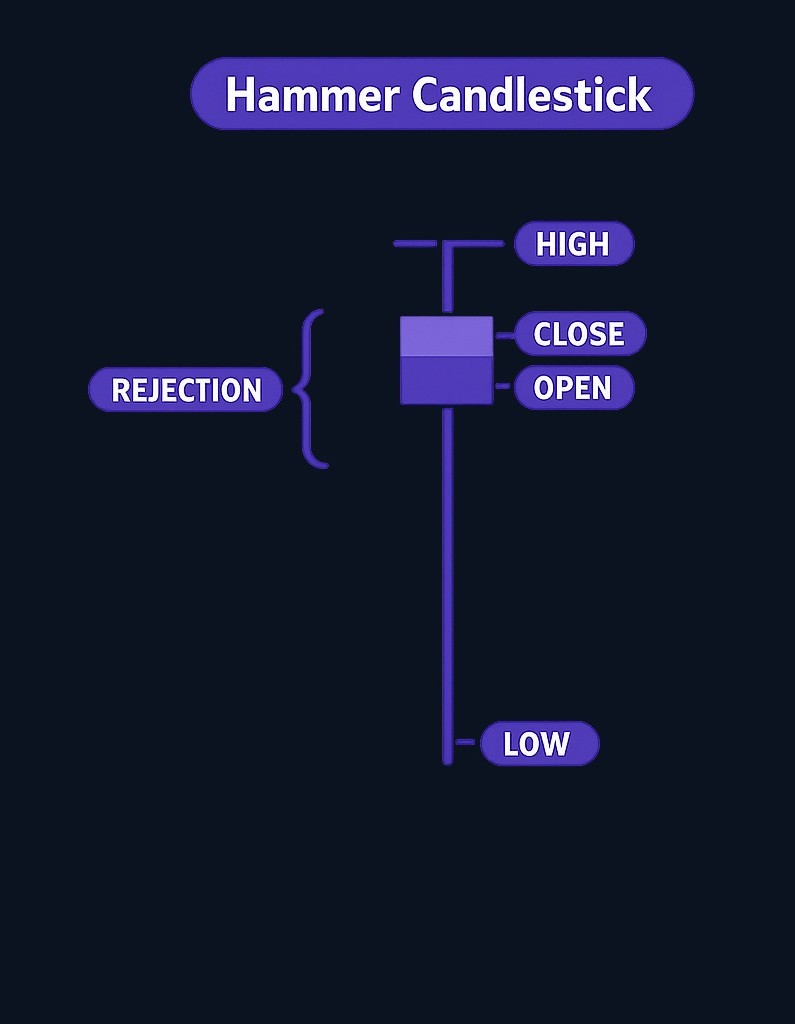
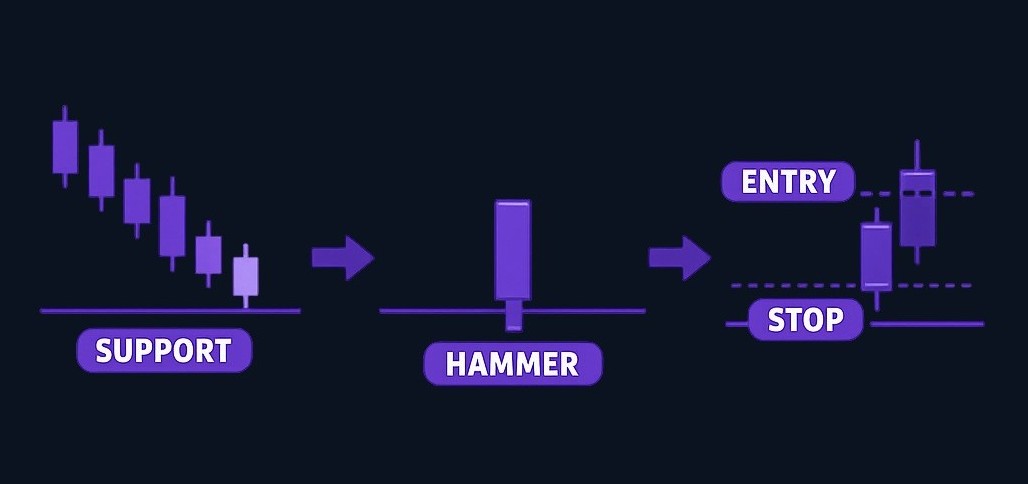
A hammer is one of the easiest patterns to recognize visually. The long lower wick is the important clue. It shows that price traded lower during the candle but did not stay there. The pattern becomes more meaningful when it appears after a clear decline and near an area where buyers have previously stepped in.
Common bearish reversal patterns
| Pattern | Where it appears | What it suggests | Simple example |
|---|---|---|---|
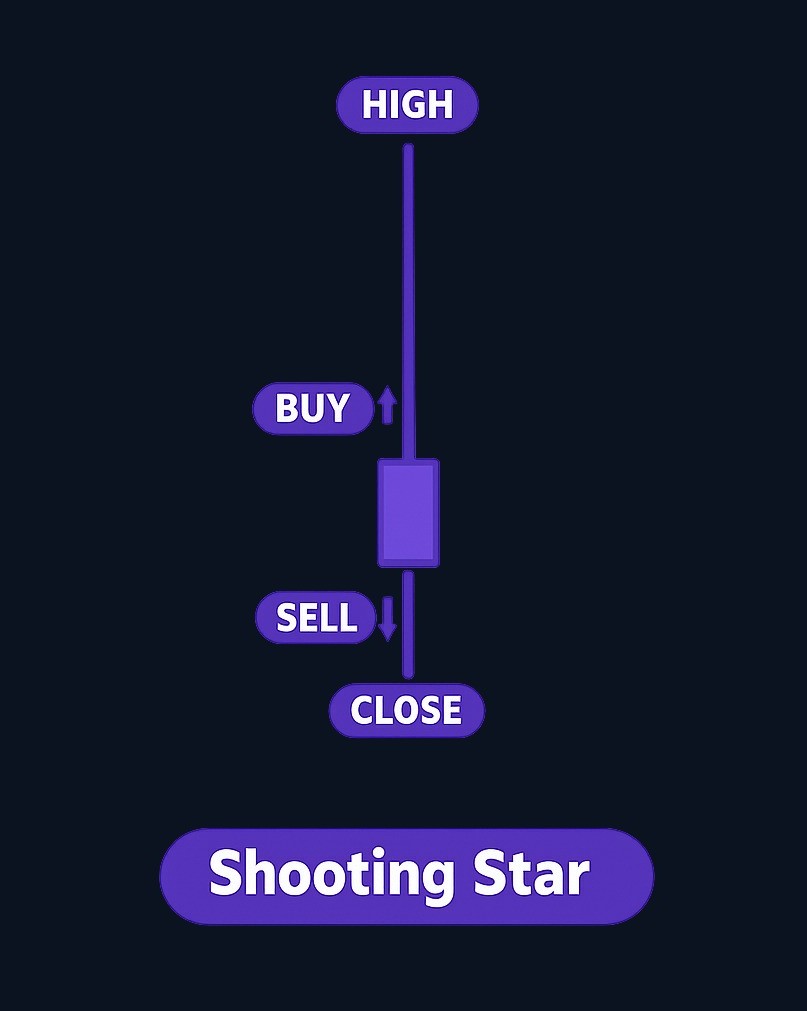
| Shooting star | After a rally | Buyers pushed price up, but sellers rejected the move | Candle has a small body and long upper wick |
| Bearish engulfing | After a rally | Sellers overpower the prior bullish candle | Large red candle closes below the body of the previous green candle |
| Evening star | After a rally | Upside momentum fades over three candles | Strong green candle, small indecision candle, strong red candle |
| Dark cloud cover | After a rally | Sellers take back much of the prior candle’s gain | Red candle opens higher but closes deep into the prior green candle |
| Gravestone doji | After a rally or resistance test | Buyers fail to hold higher prices | Open, close, and low are close together with a long upper wick |
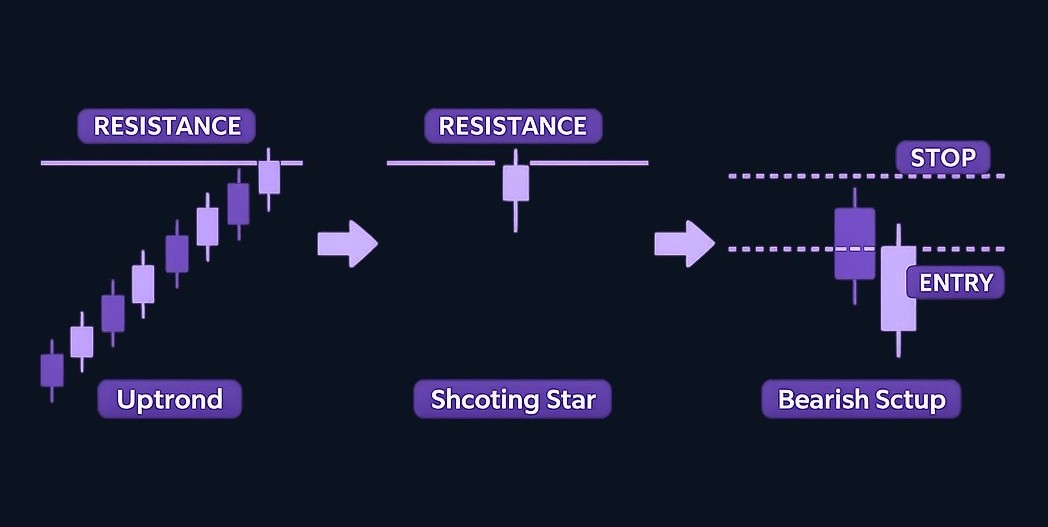
A shooting star is the bearish counterpart to the hammer. The upper wick shows that buyers tried to continue the rally, but the market rejected higher prices before the candle closed. If this happens near resistance, it can be a warning that the rally is losing strength.
How to Identify Candlestick Reversal Patterns
A reversal pattern is most useful when it answers four practical questions: What was the prior trend? Where did the pattern form? What does the candle structure show? Is there confirmation? Identifying a candlestick reversal pattern involves observable checks that help confirm or filter the signal before it carries weight FXOpen.
Use this checklist before treating a candle pattern as meaningful:
- Confirm the prior move. A bullish reversal pattern needs a prior decline. A bearish reversal pattern needs a prior rally. Without a trend to reverse, the signal is weaker.
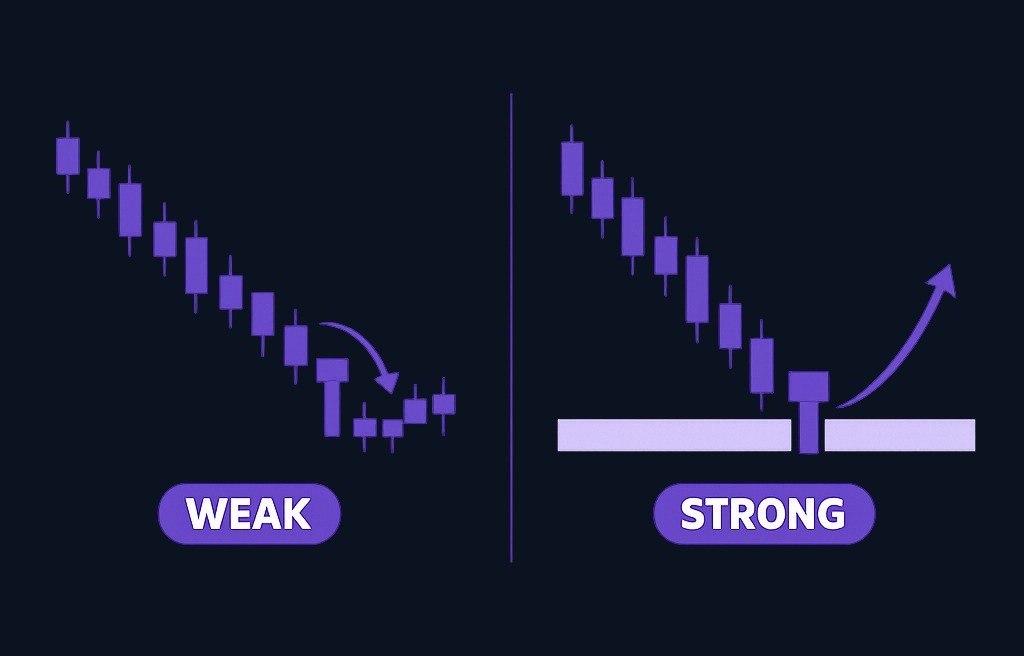
- Check location. Patterns near support, resistance, trendlines, moving averages, or prior swing highs/lows usually provide more useful context than patterns in the middle of a range.
- Read the candle anatomy. Look at the body, wick length, and close. Long wicks often show rejection. Large bodies can show stronger directional pressure.
- Wait for confirmation. Confirmation might be the next candle closing in the reversal direction, a break of a minor trendline, or a momentum indicator turning.
- Review the broader timeframe. A bullish pattern on a 15-minute chart may be less persuasive if the 4-hour chart is still in a strong downtrend.
- Plan invalidation. Before entering a trade, define what price action would prove the idea wrong.
Here is a simple framework:
Trend → Location → Pattern → Confirmation → Risk plan
For example, suppose GBP/USD has been trending lower and reaches a prior support zone. A hammer forms with a long lower wick. Instead of entering immediately, a trader could wait for the next candle to close above the hammer’s high. If that confirmation does not happen, the pattern may simply be a pause in the downtrend rather than a reversal.
Practical Applications of Reversal Patterns in Trading
Candlestick reversal patterns can support trading decisions, but they work best as part of a process rather than as isolated signals. The goal is not to predict every turn. The goal is to identify areas where risk and context can be evaluated more clearly.
Decision table: choosing a practical approach
| If you see… | Context to check | Possible trading approach | Main caveat |
|---|---|---|---|
| Hammer after a decline | Is price near support or a prior swing low? | Wait for a close above the hammer high before considering a bullish setup | A hammer in a strong downtrend can fail quickly |
| Bullish engulfing candle | Did it form after selling pressure, not in a sideways chop? | Look for follow-through or a pullback that holds above the engulfing candle midpoint | One large candle can also be a short squeeze or temporary reaction |
| Shooting star after a rally | Is price near resistance or an overextended move? | Wait for a lower close or break below the shooting star low | A rally can continue if buyers regain control |
| Bearish engulfing candle | Did it reject a known resistance area? | Consider whether momentum and structure support a bearish setup | Avoid assuming one candle overrides a higher-timeframe uptrend |
| Morning or evening star | Is the third candle strong enough to confirm the shift? | Use the pattern as a structured reversal signal after a clear trend | Three-candle patterns need patience and clean structure |
Scenario 1: bullish reversal at support
Imagine EUR/USD has declined for several sessions and reaches a level where price previously bounced. A hammer forms, followed by a bullish candle that closes above the hammer high. A trader using reversal patterns might interpret this as a potential shift from selling pressure to buying interest.
That does not mean the trader should assume a guaranteed rally. A more risk-aware process would include checking the next resistance area, deciding where the idea is invalidated, and considering whether the reward-to-risk profile is acceptable.
Scenario 2: bearish reversal after a stretched rally
Now imagine USD/JPY has risen sharply into a prior resistance area. A shooting star forms, followed by a bearish candle that closes below the shooting star’s low. This sequence may suggest buyers failed to sustain the move higher.
A trader might then look for additional confirmation from momentum or a moving average. If the broader trend remains strongly bullish, they may treat the signal as a possible short-term pullback rather than a major trend reversal.
Indicators to use alongside candlestick patterns
Candlestick patterns are price-action tools, but traders often combine them with other forms of analysis to filter weak signals. Common companions include:
- Support and resistance: Helps judge whether the pattern appears at a meaningful price area.
- Moving averages: Helps identify trend direction and dynamic support or resistance.
- Momentum indicators: Can show whether the prior move is weakening.
- Volume, where available: High trading volume can reinforce the credibility of a candlestick pattern because it may indicate stronger market commitment Changelly.
In spot forex, centralized volume can be limited depending on the platform, so traders often use tick volume or related market information carefully rather than treating volume as a perfect measure.
Practice trading with Finelo
Practice in a simulator, learn with bite-sized lessons, and build confidence before risking real money.
Common Mistakes When Trading Reversal Patterns
The most common mistake is treating a pattern as a prediction instead of a signal. A candle pattern can show a shift in pressure, but it cannot remove uncertainty.
Mistake 1: ignoring trend context
A bullish engulfing candle during a strong downtrend may only be a brief bounce. A shooting star during a strong uptrend may only be a pause before continuation. Always ask: “What trend is this pattern trying to reverse?”
Mistake 2: trading every pattern
Reversal candles appear frequently, especially on lower timeframes. If you treat every hammer, doji, or engulfing candle as equally important, you may overtrade. Stronger setups usually combine a clean prior trend, a meaningful chart level, and confirmation.
Mistake 3: entering before confirmation
Entering as soon as a pattern appears can expose you to false signals. Waiting for the next candle or a break of a nearby level can reduce some noise, though it may also mean entering at a less favorable price.
Mistake 4: overlooking volume or participation clues
One common error is overlooking volume when validating candlestick patterns; higher volume can strengthen the interpretation of a pattern by suggesting stronger participation Changelly. Where reliable volume is not available, use other context such as range expansion, wick rejection, and follow-through.
Mistake 5: having no invalidation plan
A reversal setup should include a point where the trade idea is no longer valid. For example, if a bullish hammer forms at support, a move below the hammer low may weaken the reversal case. The exact risk plan depends on the trader’s method, timeframe, and tolerance for loss.
Who This Is For and What to Do Next
This topic is most useful for beginner to intermediate traders who are learning technical analysis and want a structured way to read price action. It is also useful for investors who want to understand why traders react to certain candle formations around support and resistance.
A practical next step is to review historical forex charts and mark only the clearest reversal examples. Use the same framework each time:
- Identify the prior trend.
- Mark the nearest support or resistance.
- Name the candle pattern.
- Check whether the next candle confirmed it.
- Note where the idea would have been invalidated.
- Record what happened next without assuming the pattern “should” have worked.
If you want a guided way to keep learning trading concepts, Finelo offers financial education resources through its site Finelo. Keep any learning process educational, and always evaluate risk, costs, and suitability before making financial decisions.
FAQs About Candlestick Reversal Patterns in Forex
What are the most common candlestick reversal patterns?
The most common bullish reversal patterns include the hammer, bullish engulfing, morning star, piercing line, and dragonfly doji. The most common bearish reversal patterns include the shooting star, bearish engulfing, evening star, dark cloud cover, and gravestone doji. These patterns are most useful when they appear after a clear prior move.
How can I trade effectively using reversal patterns?
Start with context, not the candle alone. Look for a prior trend, a meaningful support or resistance area, a clear reversal pattern, and confirmation from the next candle or another indicator. Then define the point where the setup is invalidated. This keeps the pattern inside a risk-aware trading process rather than turning it into a guess.
What indicators should I use with candlestick reversal patterns?
Common tools include support and resistance, moving averages, momentum indicators, and volume where available. FXOpen suggests screening reversal signals with additional context such as key price levels, trend measures, and momentum readings FXOpen.
Are candlestick reversal patterns reliable?
They can be useful, but they are not reliable in the sense of guaranteeing a market turn. Their value depends on trend context, location, confirmation, and risk management. A pattern that appears at a major chart level after an extended move is generally more meaningful than the same pattern appearing randomly in choppy price action.
Conclusion and Next Steps
Candlestick reversal patterns in forex help traders read potential shifts in buying and selling pressure. The most important patterns to learn first are the hammer, shooting star, bullish and bearish engulfing patterns, morning star, evening star, piercing line, dark cloud cover, and doji-based reversals.
The practical lesson is simple: do not trade the candle in isolation. Use a repeatable process that includes the prior trend, chart location, candle structure, confirmation, and invalidation. For practice, choose one currency pair and one timeframe, review past examples, and record how often the cleanest patterns appeared near meaningful support or resistance. That habit will teach you more than memorizing pattern names alone.
candlestick reversal patterns forexchart analysistrading education
Practice trading with Finelo
Practice in a simulator, learn with bite-sized lessons, and build confidence before risking real money.
About the author
Finelo Team
The Finelo Team creates practical investing and trading education designed to help beginners learn faster with structured challenges, simulator practice, and bite-sized lessons.
Keep reading — Related articles

Chart Analysis
What Is VWAP? Volume-Weighted Average Price Explained
VWAP stands for volume-weighted average price: the average price a security has traded at over a period, usually one trading session, with each price weighted by the volume that traded there.
Finelo Team
Chart Analysis
What Is MACD? How to Read Momentum With Moving Averages
MACD, short for Moving Average Convergence Divergence, is a momentum indicator built from two moving averages of price.
Finelo Team
Chart Analysis
What Is the Three White Soldiers Pattern? How to Read It on a Chart
Three white soldiers is a bullish candlestick pattern made of three consecutive long-bodied up candles that step higher like a staircase.
Finelo Team