To read candlesticks, start with one candle at a time: identify the open, close, high, and low, then compare the candle’s body and wicks to the candles around it. A bullish candle usually shows price closing above its open, while a bearish candle shows price closing below its open. The wick shows the full price range for that period. From there, look for patterns—such as engulfing candles, small-body indecision candles, or rejection candles—but treat them as clues, not predictions. Candlestick charts are used in technical analysis because they show price movement, range, and market behavior visually in a compact format candlestick chart basics.
How to Read Candlesticks: A Complete Guide for Traders

To read candlesticks, start with one candle at a time: identify the open, close, high, and low, then compare the candle’s body and wicks to the candles around it.
14 min read
Practice trading with Finelo
Practice in a simulator, learn with bite-sized lessons, and build confidence before risking real money.
Want to learn more?
Practice in a simulator, learn with bite-sized lessons, and build confidence before risking real money.
Explore FineloExplore Finelo's 28-day challenges
Turn learning into a daily habit with guided challenge paths.
Introduction to Candlestick Charts
Candlestick charts are a way to visualize price action over time. Each candle represents a chosen time period: one minute, five minutes, one hour, one day, or any other chart interval your platform supports. Instead of showing only a closing price, a candlestick shows how price moved within that period.
That extra context is why traders use candlesticks for technical analysis. A candle can show whether buyers pushed price higher, whether sellers rejected a move, or whether price closed near the middle of its range. Candlestick charts are visually similar to bar charts but can contain more information about the session’s price behavior candlestick charts and bar charts.
The key point: a candlestick does not tell you what will happen next. It tells you what happened during a specific period and helps you form a more structured view of current market pressure.
Understanding Candlestick Components
Every candlestick has four core data points:
- Open: the price at the start of the candle’s time period.
- Close: the price at the end of the candle’s time period.
- High: the highest price reached during that period.
- Low: the lowest price reached during that period.
The body is the distance between the open and close. The wicks or shadows show how far price moved above or below the body before the candle closed. Candlestick colors are commonly used to show the relationship between the open and close, often green/red or black/white depending on the chart settings open, close, high, and low.
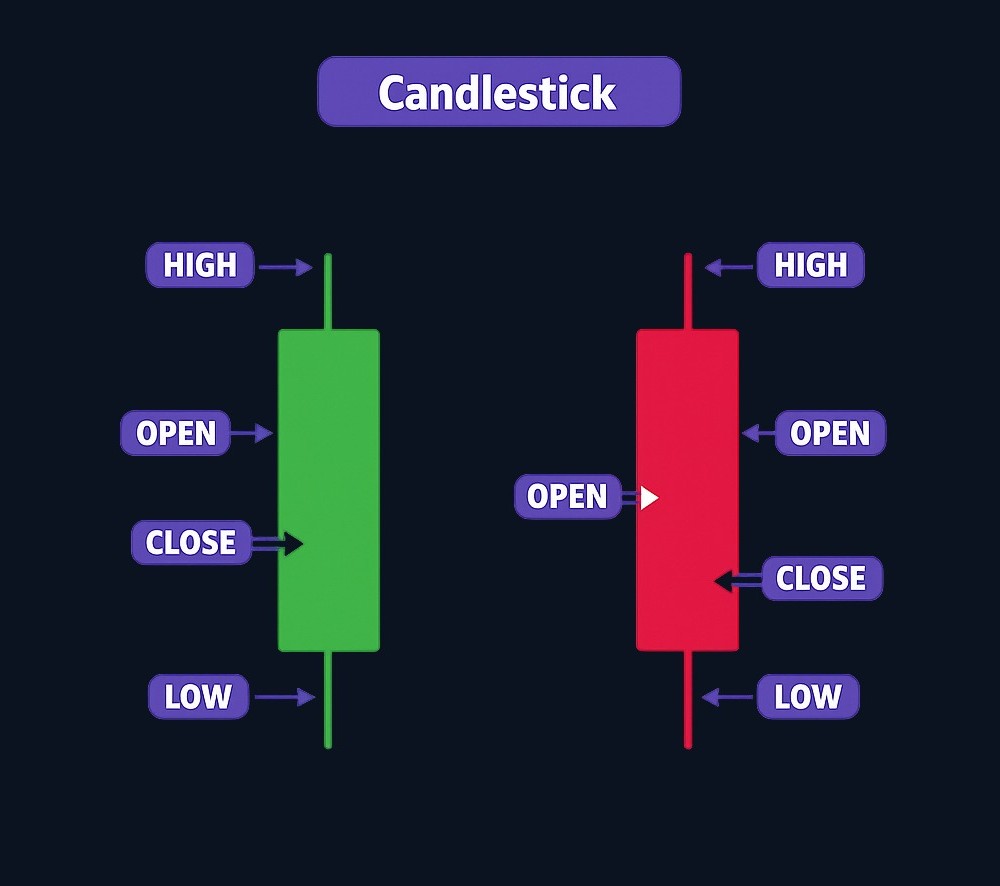
If the candle closes above its open, it is usually interpreted as bullish for that period. If it closes below its open, it is usually interpreted as bearish for that period. But the candle’s location matters. A large bullish candle after a long downtrend may carry a different meaning than the same candle after an extended rally.
What the Body and Wicks Tell You
The body shows commitment. A long body suggests price moved decisively from open to close. A small body suggests the open and close were near each other, which can indicate hesitation or balance between buyers and sellers.
The wick shows rejection or range. For example:
- A long upper wick means price moved higher but could not hold that level.
- A long lower wick means price moved lower but recovered before the candle closed.
- A candle with very small wicks means most trading happened near the body’s range.
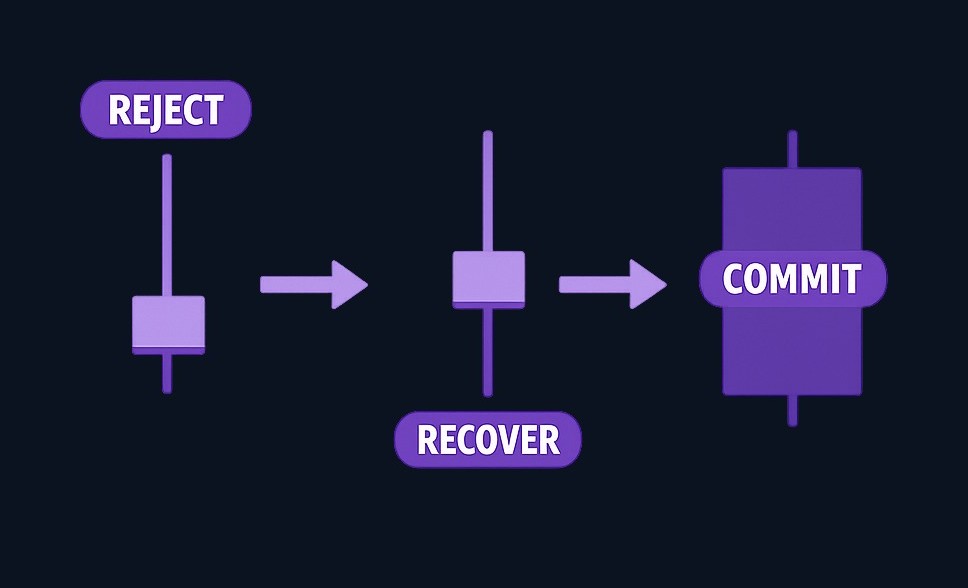
This is where many beginners make a mistake: they memorize pattern names before they understand the underlying price behavior. Pattern names are useful, but the body and wick tell the story.
Common Candlestick Patterns to Know
There are many candlestick patterns, but beginners should focus on a small set that teaches the core logic: trend, rejection, momentum, and indecision.
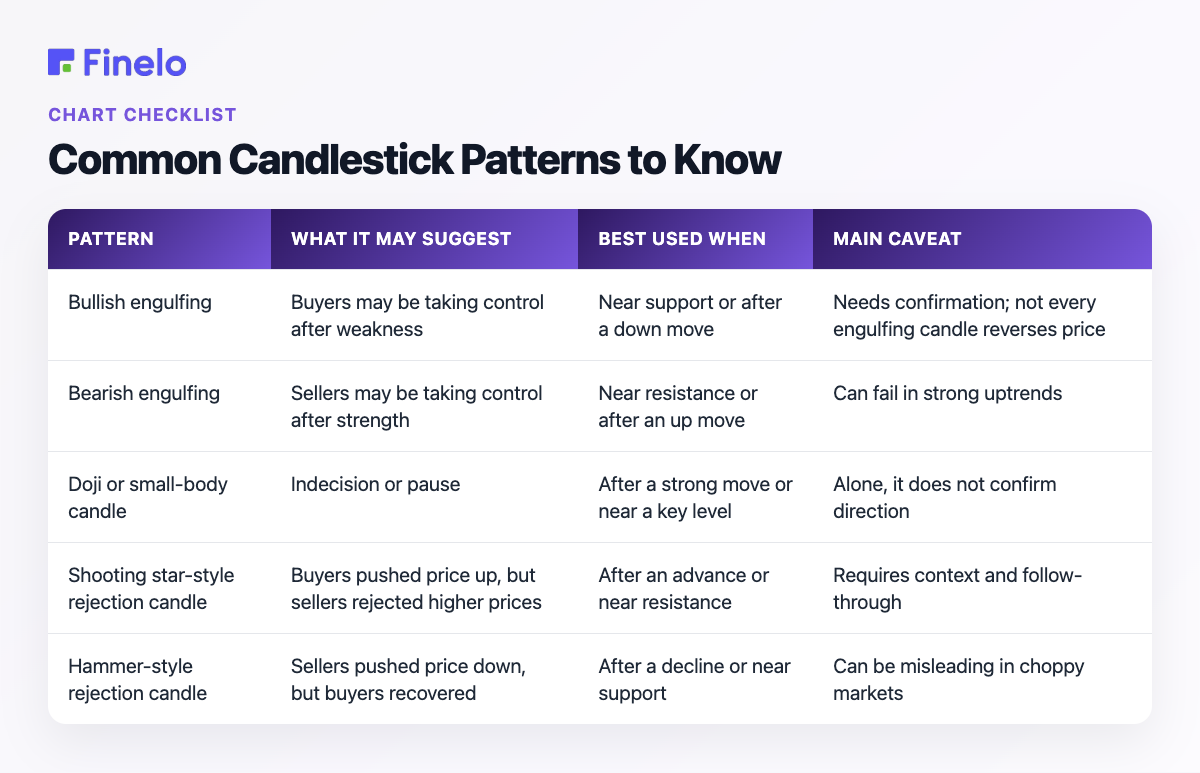
| Pattern | What it may suggest | Best used when | Main caveat |
|---|---|---|---|
| Bullish engulfing | Buyers may be taking control after weakness | Near support or after a down move | Needs confirmation; not every engulfing candle reverses price |
| Bearish engulfing | Sellers may be taking control after strength | Near resistance or after an up move | Can fail in strong uptrends |
| Doji or small-body candle | Indecision or pause | After a strong move or near a key level | Alone, it does not confirm direction |
| Shooting star-style rejection candle | Buyers pushed price up, but sellers rejected higher prices | After an advance or near resistance | Requires context and follow-through |
| Hammer-style rejection candle | Sellers pushed price down, but buyers recovered | After a decline or near support | Can be misleading in choppy markets |
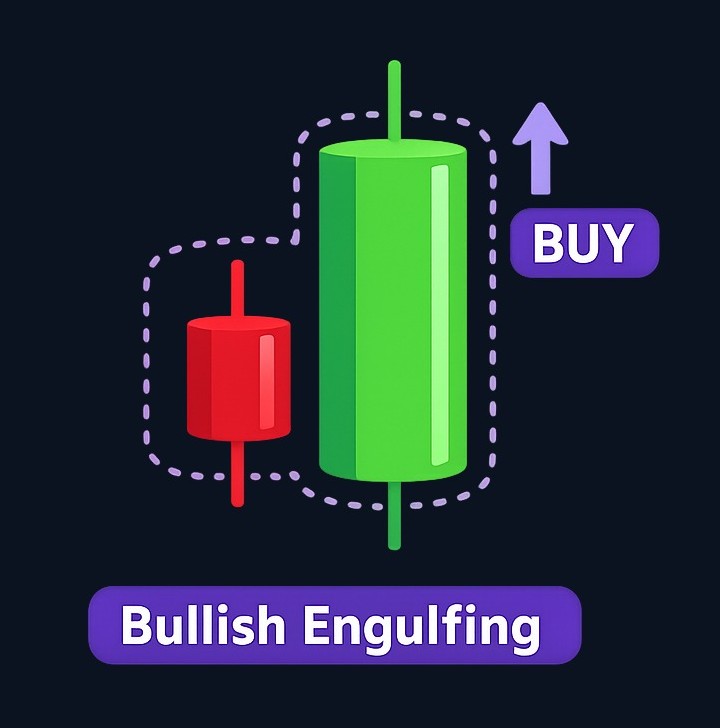
Bullish Engulfing
A bullish engulfing pattern involves two candles. It is commonly described as appearing after a decline, where the second candle opens lower and then buyers push price higher enough to engulf the prior candle’s body. The supplied evidence describes bullish engulfing as a two-candle pattern that usually occurs at the end of a downtrend bullish engulfing pattern.
The logic is simple: sellers were previously in control, but the next candle shows stronger buying pressure. A trader might interpret that as a possible shift in short-term momentum—but only if the pattern appears in a meaningful area, such as near support or after an extended selloff.
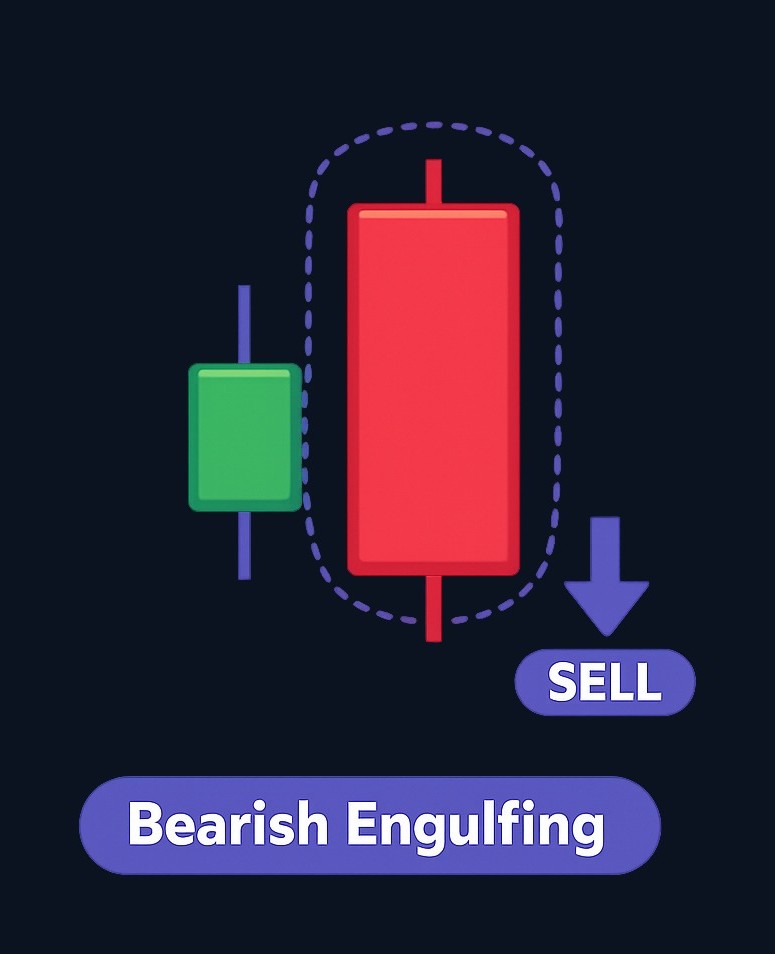
Bearish Engulfing
A bearish engulfing pattern is the opposite idea: a strong bearish candle overtakes the prior bullish candle’s body. Traders often watch it after an upward move because it can suggest sellers are beginning to overpower buyers.
The key decision point is location. A bearish engulfing candle in the middle of a sideways range is less meaningful than one that forms near a previous resistance area. It is also less useful if the broader trend is strongly bullish and volume or follow-through does not support the signal.
Doji and Small-Body Candles
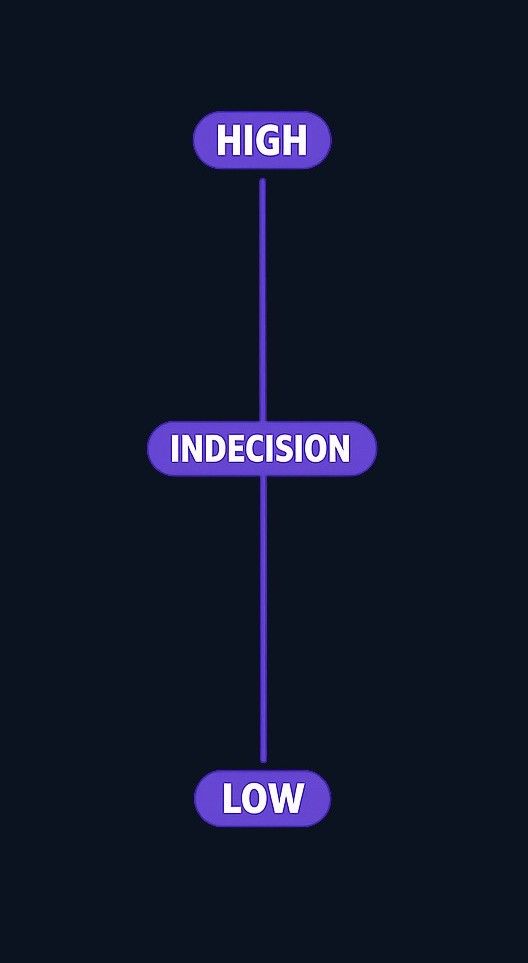
A doji or very small-body candle shows that the open and close were close together. Traders often treat this as a sign of indecision, especially after a strong directional move.
For example, if a market rises sharply for several candles and then prints a tiny-body candle with long wicks, that may suggest the move is losing momentum. But it does not automatically mean a reversal is coming. It may simply mean the market paused before continuing.
Shooting Star-Style Rejection
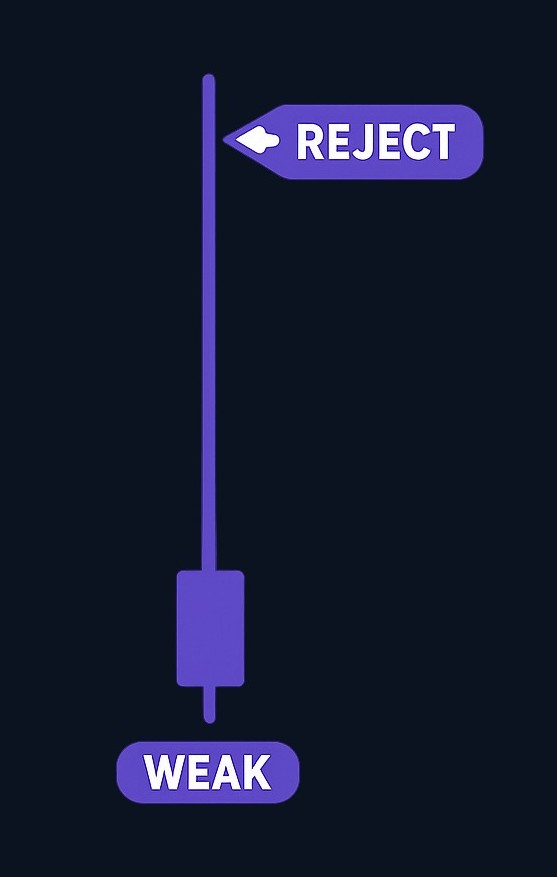
A shooting star is generally treated as a bearish rejection pattern. The supplied evidence describes the shooting star as a bearish candlestick pattern associated with an increasing trend, where buyers had been willing to pay higher prices before the candle’s behavior shifts shooting star pattern.
The important feature is the rejection: price trades higher, but the candle does not close strongly near its high. That can show that buyers lost control during the period. Again, context matters. A rejection candle near resistance is more meaningful than one appearing randomly in the middle of a range.
Interpreting Candlestick Patterns Without Overreading Them
Candlestick patterns work best as part of a structured process. Instead of asking, “What is this pattern called?” ask four questions:
- Where did it form? Near support, resistance, a trendline, or in the middle of nowhere?
- What came before it? A strong trend, a pullback, or a choppy range?
- What does the candle show? Momentum, rejection, indecision, or continuation?
- What would confirm or invalidate the idea? A break above the candle high, a close below the low, or failure to follow through?
This framework keeps you from treating candlesticks like standalone signals. Candlestick charts can help traders interpret market behavior and past price changes market behavior and candlesticks, but they should not be used as a guarantee of future movement.
Example: Reading a Bullish Reversal Setup
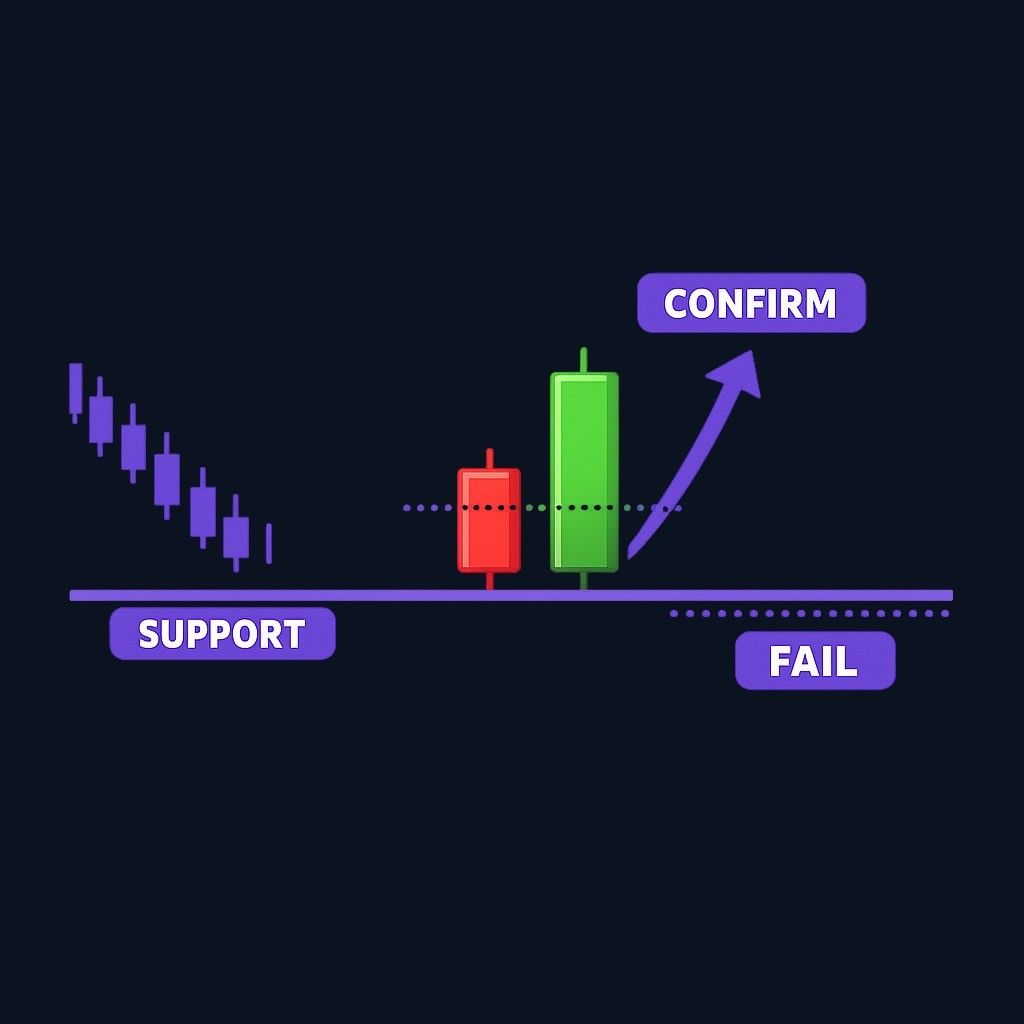
Imagine a stock or crypto asset has been falling for several sessions. Price approaches a previous support area. Then a bearish candle forms, followed by a larger bullish candle that closes above the prior candle’s body.
A beginner might say, “That is bullish engulfing, so I should buy.” A more disciplined interpretation would be:
- The prior trend was down.
- Price reached an area where buyers previously appeared.
- The second candle showed stronger buying pressure.
- The next step is to wait for confirmation, such as price holding above the engulfing candle’s midpoint or breaking above its high.
- If price falls below the pattern’s low, the reversal idea is weakened.
That does not guarantee a profitable trade. It simply turns a visual pattern into a testable trading idea.
Practical Applications in Trading
Candlestick analysis can support several parts of a trading strategy: timing entries, managing exits, identifying hesitation, and avoiding low-quality setups.
1. Timing an Entry
Suppose your broader strategy says an asset is near support. A candlestick pattern can help you avoid entering too early. Instead of buying just because price touched support, you might wait for a bullish candle, a lower-wick rejection, or an engulfing pattern.
This adds a behavior-based trigger: you are not only identifying a level; you are waiting to see whether buyers appear there.
2. Planning Risk
Candlesticks can also help define invalidation. If you enter after a bullish rejection candle, the low of that candle may be a logical place to monitor. If price breaks below that low, the idea behind the setup may no longer be valid.
This is not a recommendation for where to place a stop. It is an example of how traders use candle structure to think about risk before entering a trade.
3. Avoiding Choppy Conditions
Candlesticks can reveal when the market is unclear. A cluster of small bodies and overlapping wicks often suggests indecision. In that environment, single-candle signals are more likely to be noisy.
A useful rule: if you cannot clearly explain what buyers or sellers are doing, the chart may not be offering a clean setup.
Practice trading with Finelo
Practice in a simulator, learn with bite-sized lessons, and build confidence before risking real money.
Choosing the Right Time Frame
There is no universally “best” time frame for candlestick charts. The right choice depends on your trading style, attention span, and risk tolerance.
| If your goal is… | Common approach | What to watch out for |
|---|---|---|
| Long-term investing context | Higher time frames such as daily or weekly charts | Signals appear less often and may develop slowly |
| Swing trading | Multi-hour or daily charts | Overnight gaps and broader market conditions can affect setups |
| Day trading | Intraday charts | More noise and faster decision-making |
| Learning pattern recognition | Start with higher time frames | Slower charts can make candle structure easier to study |
A practical method is to use two time frames: one higher time frame for context and one lower time frame for timing. For example, a trader might use a daily chart to identify trend and support/resistance, then a shorter chart to study the candles forming near that level.
The shorter the time frame, the more careful you need to be about noise. A pattern on a one-minute chart can form and fail quickly. A daily candle usually reflects a larger amount of price behavior, but it also requires more patience.
Integrating Candlestick Analysis With Other Strategies
Candlesticks are most useful when combined with other tools. They can show what price did, but they do not explain everything about trend strength, broader market context, liquidity, or news risk.
Here are practical combinations:
- Support and resistance: Use candlesticks to see how price behaves at important levels.
- Trend analysis: Give more weight to bullish patterns in uptrends and bearish patterns in downtrends.
- Moving averages: Use them as context for trend direction, then read candles around pullbacks.
- Volume, when available: Look for whether participation supports the candle’s message.
- Risk planning: Define in advance what price action would prove your idea wrong.
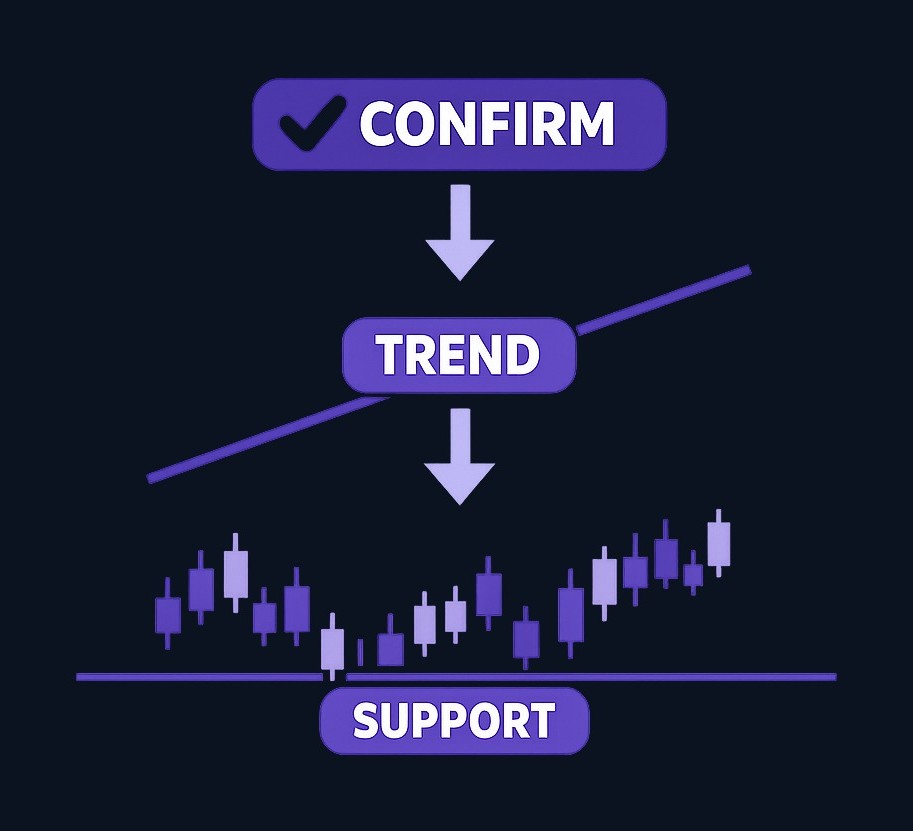
The goal is not to add as many indicators as possible. The goal is to reduce ambiguity. If trend, level, and candlestick behavior all point to the same idea, the setup may be clearer than a candle pattern alone.
Common Mistakes to Avoid
Candlestick charts are simple to read but easy to misuse. Watch for these common errors.
Memorizing Patterns Without Context
A bullish engulfing candle in a strong downtrend is not automatically a reversal. A shooting star-style candle in a sideways range is not automatically a short signal. Always ask where the pattern formed and what the surrounding candles show.
Ignoring the Trend
Candlestick patterns that go against the dominant trend often need stronger confirmation. Countertrend trades can move quickly against you, especially when the broader market remains strong.
Treating Candlesticks as Predictions
Candlesticks summarize price behavior. They do not predict the future with certainty. Use them to build scenarios: “If price breaks above this level, the bullish case improves; if it breaks below this level, the idea weakens.”
Switching Time Frames to Find a Signal
If a setup does not exist on your chosen chart, moving through five different time frames until one appears can lead to forced trades. Decide your primary time frame before analyzing the chart.
Ignoring Risk and Position Size
Even a clean-looking pattern can fail. Before acting on any setup, consider risk, costs, liquidity, and whether the trade fits your plan. This article is educational and should not be treated as personalized financial advice.
A Simple Candlestick Reading Framework
Use this checklist before acting on a candlestick pattern:
- Trend: Is price trending up, trending down, or ranging?
- Location: Is the candle forming near support, resistance, or a key level?
- Candle structure: Is the body large or small? Are the wicks showing rejection?
- Pattern: Does the candle fit a known setup, such as engulfing, doji, or rejection?
- Confirmation: What would you need to see next?
- Invalidation: What price action would prove the idea wrong?
- Risk: Does the potential trade fit your plan and tolerance?
If you are still learning, practice this framework on historical charts before using it in live decisions. For structured investing education, you can explore Finelo as a learning resource.
Conclusion and Next Steps
Reading candlesticks starts with the basics: open, close, high, low, body, and wick. Once you understand those parts, patterns become easier to interpret because you can see the behavior behind the name.
The most important candlestick patterns to know are not necessarily the most complex ones. Start with bullish engulfing, bearish engulfing, doji or small-body indecision candles, and rejection candles such as shooting star-style formations. Then study them in context: trend, support and resistance, confirmation, and risk.
Your next step is simple: open a chart, pick one time frame, and review 20 recent candles. For each one, describe what happened in plain English before naming any pattern. That habit will make candlestick analysis more practical, less mechanical, and more useful for real trading decisions.
Frequently Asked Questions
Are candlestick patterns reliable for predicting market movements?
Candlestick patterns are not reliable as standalone predictions. They can help traders interpret price behavior and market sentiment, but they work best with context such as trend, support and resistance, confirmation, and risk planning.
What are the most important candlestick patterns for beginners?
Beginners should focus on a small group: bullish engulfing, bearish engulfing, doji or small-body indecision candles, and rejection candles such as shooting star-style patterns. These teach the core ideas of momentum, reversal pressure, and hesitation.
What time frame is best for reading candlestick charts?
There is no single best time frame. Higher time frames can be easier for beginners because they move more slowly and often reduce noise. Shorter time frames may offer more signals, but they also require faster decisions and stricter risk control.
How can candlestick patterns improve a trading strategy?
Candlestick patterns can help with timing, confirmation, and risk planning. For example, instead of entering only because price reaches support, a trader might wait for a bullish rejection candle or engulfing pattern to show that buyers are responding.
how to read candlestickschart analysistrading education
Practice trading with Finelo
Practice in a simulator, learn with bite-sized lessons, and build confidence before risking real money.
About the author
Finelo Team
The Finelo Team creates practical investing and trading education designed to help beginners learn faster with structured challenges, simulator practice, and bite-sized lessons.
Keep reading — Related articles

Chart Analysis
Tick Charts: How They Work, Uses, and Limitations
A tick chart builds each bar (or candle) from a fixed count of market "ticks" — individual trades or quote changes — instead of fixed time intervals. Tick charts therefore compress activity when the market is busy and stretch it when activity is light, helping traders focus on…
Finelo Team
Chart Analysis
Renko Charts: How They Work, Uses, and Limitations
A Renko chart is a price-charting method that draws uniform "bricks" only when price moves by a predefined amount, filtering out small fluctuations to highlight trends and support/resistance zones; unlike time-based candlesticks, Renko bricks form from price movement rather than fixed time intervals TradingView renko description. This guide…
Finelo Team
Chart Analysis
A Complete Guide to Point and Figure Charts
Point and Figure (P&F) charts are a price‑only charting method that records meaningful price moves while ignoring linear time, helping traders spot clean trends, support/resistance, and breakouts. P&F is a price‑focused variant of technical analysis that emphasizes market supply-and-demand visible on a single price picture CME Group.
Finelo Team


