The inverse head and shoulders stock pattern is a chart formation traders use as a potential bullish reversal signal. It appears after a downtrend and has three lows: a left shoulder, a deeper “head,” and a right shoulder that is usually higher than the head. The key level is the neckline, a resistance area drawn across the rebound highs. A break above that neckline is often treated as a sign that bearish momentum may be ending; Schwab describes a completed neckline break as evidence that sellers may have lost control and the shares could attempt higher highs (Schwab).
The Inverse Head and Shoulders Stock Pattern Explained
The inverse head and shoulders stock pattern is a chart formation traders use as a potential bullish reversal signal.
14 min read
Practice trading with Finelo
Practice in a simulator, learn with bite-sized lessons, and build confidence before risking real money.
Want to learn more?
Practice in a simulator, learn with bite-sized lessons, and build confidence before risking real money.
Explore FineloExplore Finelo's 28-day challenges
Turn learning into a daily habit with guided challenge paths.
This guide is for readers learning technical analysis, including newer traders who want a practical framework before risking capital. It is educational only, not personalized financial advice.
Introduction to the Inverse Head and Shoulders Pattern
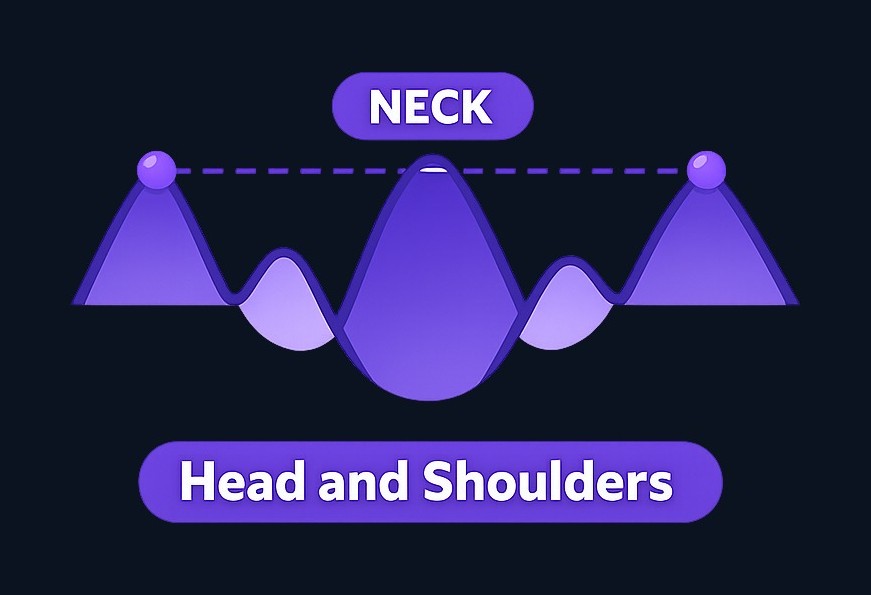
The inverse head and shoulders is the upside-down version of the traditional head and shoulders pattern. While the traditional version is commonly watched as a potential bearish reversal, the inverse version is watched as a potential bullish reversal. In plain English, it suggests that sellers may be losing control and buyers may be starting to absorb the pressure.
The pattern matters because it gives traders a structured way to think about three things:
- Where the prior downtrend may be weakening
- Where buyers have repeatedly stepped in
- Where a breakout would need to occur before the pattern is considered active
The important word is “potential.” A chart pattern does not guarantee a profitable trade. Even when the shape looks clean, price can fail at the neckline, break out briefly and reverse, or move in a way that makes the setup unattractive. Schwab also cautions that stop orders are not guaranteed to execute at or near the stop price, which is an important risk point when planning trades around these patterns (Schwab).
Identifying the Inverse Head and Shoulders Pattern
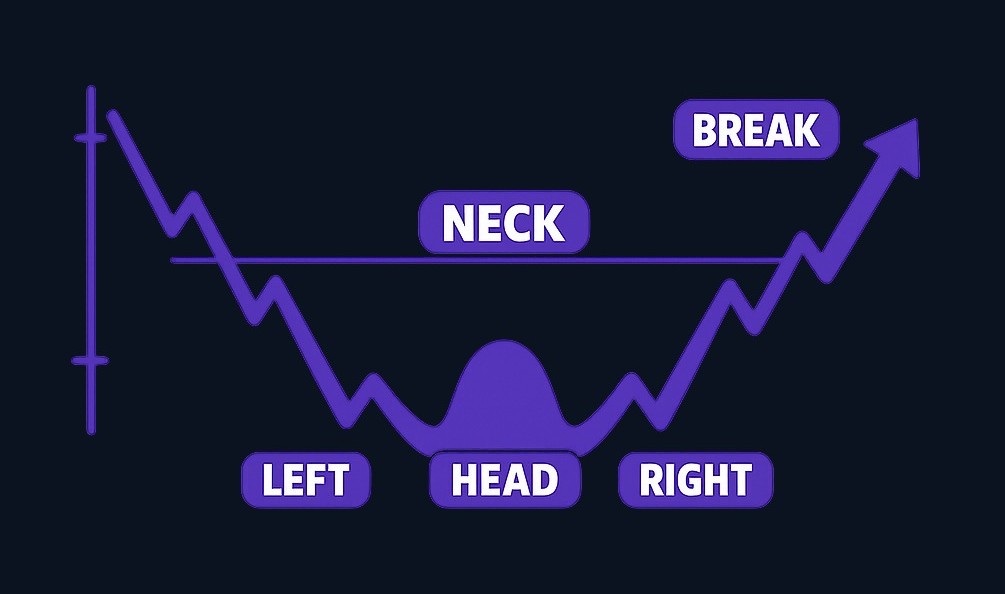
An inverse head and shoulders pattern has four main parts: the prior downtrend, the left shoulder, the head, the right shoulder, and the neckline. You do not need the pattern to be perfectly symmetrical, but each part should make sense on the chart.
1. Start with the prior trend
The setup is most meaningful after a stock has been declining. If there was no meaningful downward move first, there may be nothing to “reverse.” In that case, the shape may simply be sideways price movement rather than a reversal pattern.
Ask: Was the stock in a bearish phase before the pattern began?
2. Find the left shoulder
The left shoulder forms when price falls to a low, then rebounds. This first rebound creates one of the swing highs used to draw the neckline.
Ask: Did the stock make a low and then recover enough to form a clear bounce?
3. Find the head
The head is the deepest low in the pattern. Price falls below the left shoulder low, then rebounds again. This second rebound forms another swing high near the neckline area.
Ask: Is the middle low clearly lower than the two shoulders?
4. Find the right shoulder
The right shoulder forms when price declines again but does not fall as far as the head. This can suggest that sellers are no longer pushing price to new lows with the same force.
Ask: Did the stock hold above the head low during the final pullback?
5. Draw the neckline
The neckline connects the rebound highs between the shoulders and the head. It can be horizontal or slanted. The pattern is generally watched more closely when price approaches and then breaks above this neckline. Schwab describes a possible inverse head and shoulders scenario where a stock rebounds to a resistance area, drops to a new low, climbs back to that resistance, declines again, and then a trader considers a buy-stop order just above the perceived resistance level (Schwab).
Here is a simple checklist:
| Pattern element | What to look for | Why it matters |
|---|---|---|
| Prior downtrend | Price has been falling before the pattern | Gives the setup reversal context |
| Left shoulder | First low followed by a rebound | Establishes the first support/rebound area |
| Head | Lower low than both shoulders | Shows the deepest bearish push |
| Right shoulder | Higher low than the head | Suggests selling pressure may be weakening |
| Neckline | Resistance across rebound highs | Break above it is the key confirmation area |
| Risk plan | Entry, invalidation, and target planned before entry | Reduces emotional decision-making |
A useful rule: do not treat the pattern as complete just because the three lows are visible. Many traders wait for price to break above the neckline before considering the pattern confirmed.
Trading Strategies Using the Inverse Head and Shoulders Pattern
There are several ways traders approach the inverse head and shoulders pattern. The best choice depends on risk tolerance, market conditions, and how much confirmation the trader wants before entering.
Strategy 1: Breakout entry above the neckline
The most common approach is to wait for price to break above the neckline. This avoids entering too early while the stock is still below resistance.
Schwab notes that for an inverse head and shoulders, one approach is to set a buy-stop order just above the neckline when price breaks higher through that level (Schwab). This is not a guarantee of a good fill or a profitable trade, but it shows how traders may use the neckline as an objective trigger.
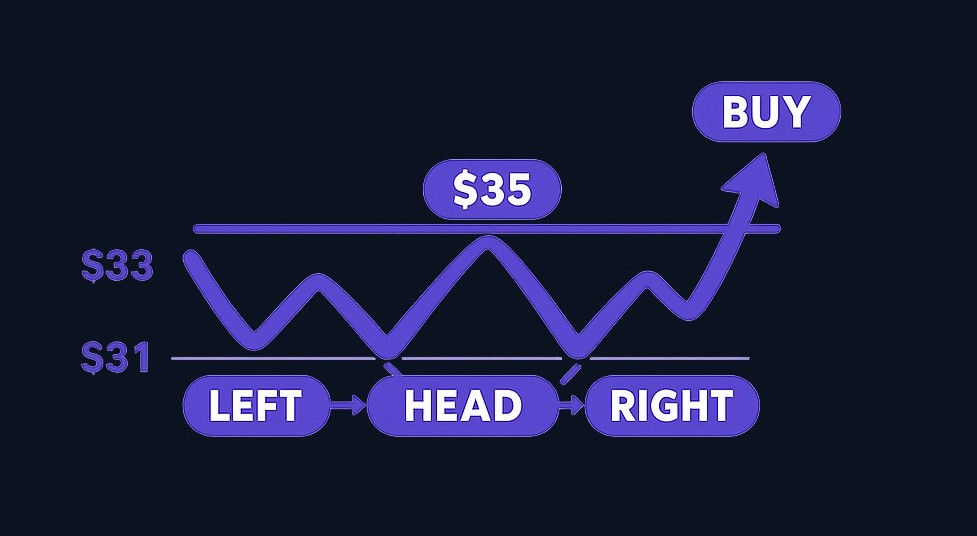
Example: Suppose a stock rebounds to $35, falls to $33, returns to $35, then pulls back again without making a lower low. A trader watching the neckline near $35 might decide that a move above that level is the confirmation point. Schwab gives a similar example in which a buy-stop order may be considered just above perceived resistance at $35 (Schwab).
Practical takeaway: This approach prioritizes confirmation over getting the lowest possible entry.
Strategy 2: Pullback entry after the breakout
Some traders do not buy the first move through the neckline. Instead, they wait to see whether price breaks out, then pulls back toward the neckline and holds it as support.
This can reduce the risk of chasing a sharp breakout, but it has a trade-off: the stock may not pull back, and the trader may miss the move. It can also still fail if the pullback breaks back below the neckline.
Practical takeaway: This approach is more patient, but it requires accepting that not every setup will offer a second chance.
Strategy 3: Anticipatory entry near the right shoulder
A more aggressive trader may enter before the neckline breaks, usually near the right shoulder, if they believe the pattern is forming. This can offer a better entry price, but it also carries more pattern-failure risk because the breakout has not happened yet.
This strategy is less suitable for beginners because it depends heavily on judgment. The trader must define where the pattern is invalidated before entering.
Practical takeaway: This approach offers earlier exposure but less confirmation.
Strategy 4: Pre-planned exit and risk control
A trade plan should include more than an entry. Traders also need to decide where they will exit if the trade fails and where they may take profits if it works.
Schwab notes that stop orders can be useful for head-and-shoulders opportunities, including for initiating a position in an inverse head and shoulders when price breaks higher through the neckline, while also warning that stop orders are not guaranteed to execute at or near the stop price (Schwab). Schwab also notes that, for profit-taking, traders may consider limit orders at a predetermined target price (Schwab).
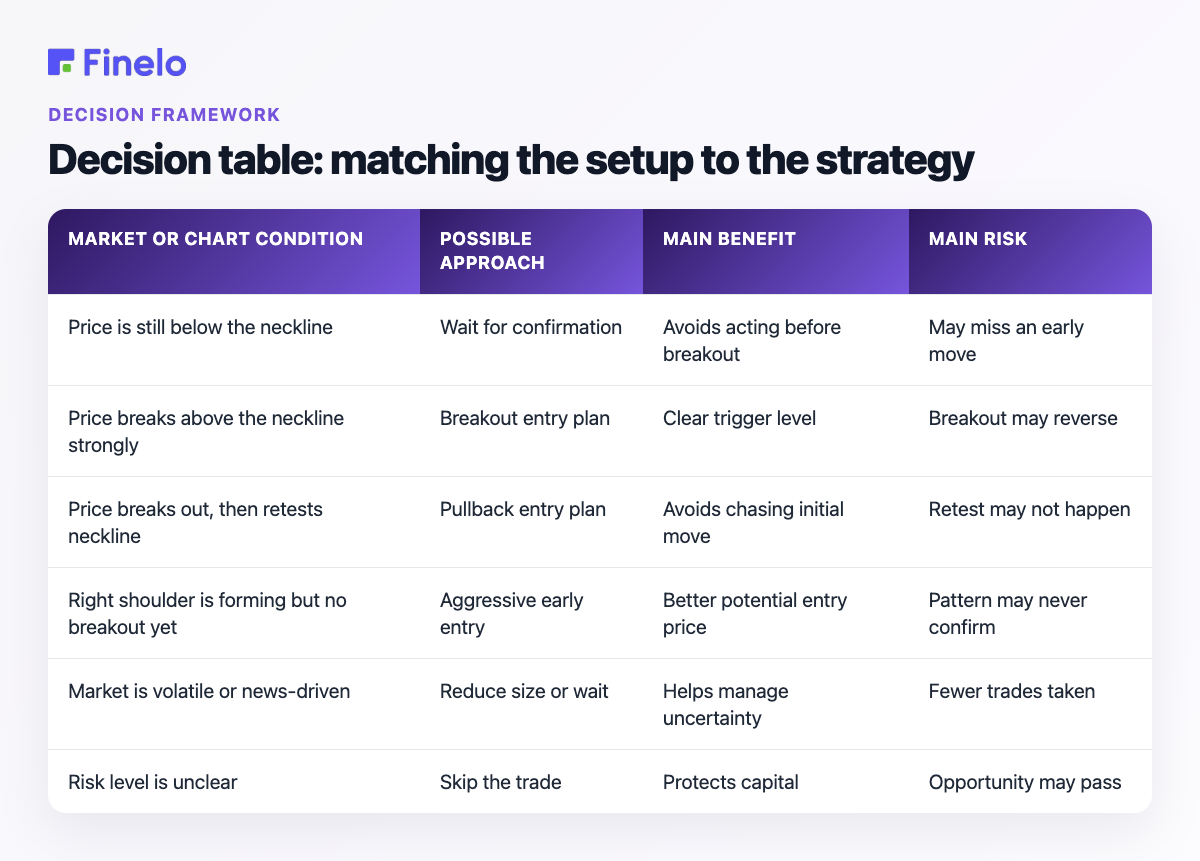
Decision table: matching the setup to the strategy
| Market or chart condition | Possible approach | Main benefit | Main risk |
|---|---|---|---|
| Price is still below the neckline | Wait for confirmation | Avoids acting before breakout | May miss an early move |
| Price breaks above the neckline strongly | Breakout entry plan | Clear trigger level | Breakout may reverse |
| Price breaks out, then retests neckline | Pullback entry plan | Avoids chasing initial move | Retest may not happen |
| Right shoulder is forming but no breakout yet | Aggressive early entry | Better potential entry price | Pattern may never confirm |
| Market is volatile or news-driven | Reduce size or wait | Helps manage uncertainty | Fewer trades taken |
| Risk level is unclear | Skip the trade | Protects capital | Opportunity may pass |
A simple framework is: identify, confirm, plan, then act. Identify the structure, wait for the neckline decision point, plan entry and exit levels, and only then decide whether the risk is acceptable.
Common Mistakes to Avoid
The inverse head and shoulders pattern is popular partly because it is easy to recognize visually. That also makes it easy to force onto charts where it does not truly belong.
Mistake 1: Seeing the pattern everywhere
Not every three-dip structure is an inverse head and shoulders. The pattern is more meaningful when it follows a downtrend and has a clear neckline. If the chart is choppy or range-bound, the pattern may be too subjective.
Avoid it by: requiring a prior downtrend and a visible neckline before labeling the setup.
Mistake 2: Entering before the neckline matters
Many failed trades happen because the trader enters as soon as the right shoulder appears. But until price challenges and breaks the neckline, the stock may still be stuck below resistance.
Avoid it by: deciding in advance whether you require a neckline break or are intentionally using a more aggressive early-entry method.
Mistake 3: Ignoring failed breakouts
A breakout is not automatically valid just because price moves above the neckline for a short time. Price can move above resistance and then fall back below it.
Avoid it by: planning what you will do if the stock fails to hold the breakout area.
Mistake 4: Using stop orders without understanding execution risk
Stop orders can help structure a trade, but they are not perfect. Schwab cautions that triggering a stop does not ensure a fill close to the chosen price (Schwab). This matters especially in fast-moving markets, thinly traded stocks, or periods of sharp volatility.
Avoid it by: understanding order types before using them and keeping position size aligned with your risk tolerance.
Mistake 5: Treating the pattern as a prediction
The pattern does not predict the future with certainty. It is a decision tool, not a promise. A disciplined trader uses it alongside a broader process that includes risk management, market context, and a clear exit plan.
Avoid it by: asking, “What will prove this trade idea wrong?” before asking, “How much could this make?”
Practice trading with Finelo
Practice in a simulator, learn with bite-sized lessons, and build confidence before risking real money.
Example Trade Walkthroughs
Specific historical stock case studies require verified chart data, dates, and outcomes. Without that evidence, it would be misleading to claim that a named stock formed a successful inverse head and shoulders pattern. Instead, the following educational walkthroughs show how the pattern might be evaluated in practice.
Example 1: A cleaner neckline breakout
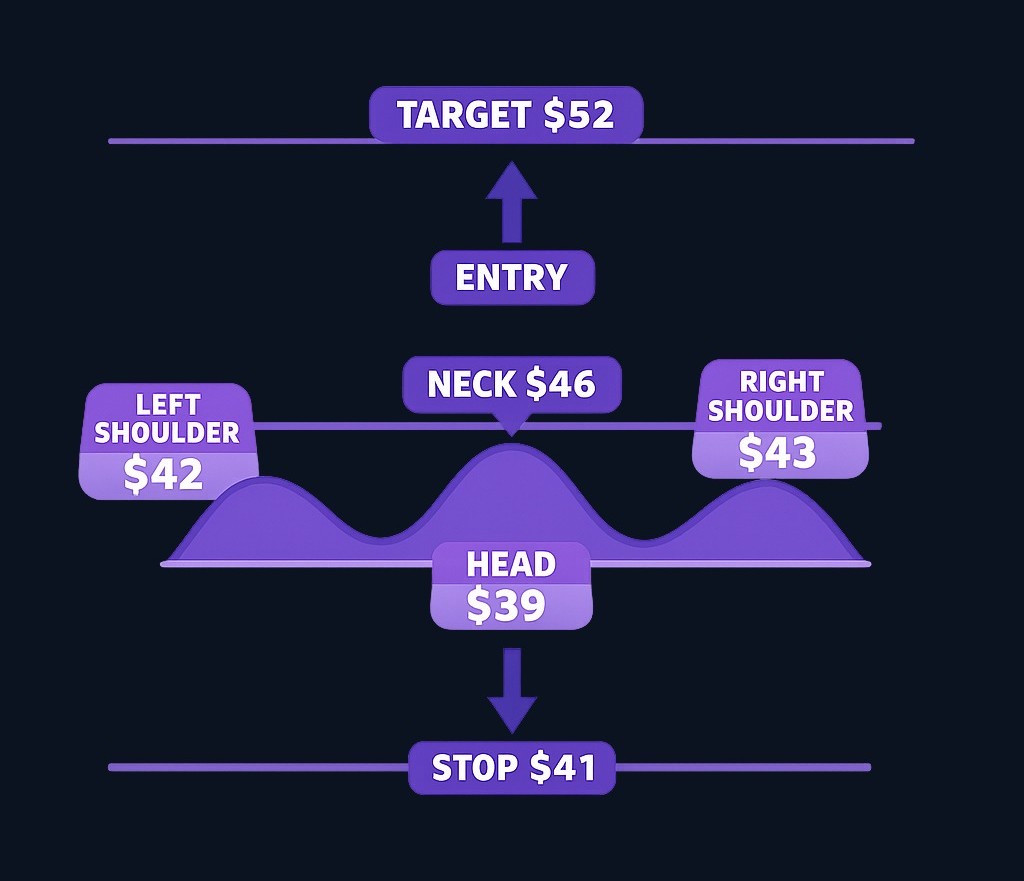
Imagine a stock has been trending lower for several weeks. It forms a low at $42, rebounds to $46, drops to $39, rebounds again near $46, then pulls back to $43. The $39 low is the head, the $42 and $43 lows are the shoulders, and $46 is the neckline.
A trader using a confirmation-based approach might wait for price to move above $46 before considering an entry. If the trader uses a buy-stop order just above the neckline, that approach is consistent with Schwab’s description of using a buy-stop price above perceived neckline resistance in an inverse head and shoulders setup (Schwab).
The key decision is not simply “buy because the pattern exists.” The better question is: If price breaks above $46, where is the trade invalidated, and is the potential reward worth the risk?
Example 2: A failed neckline attempt
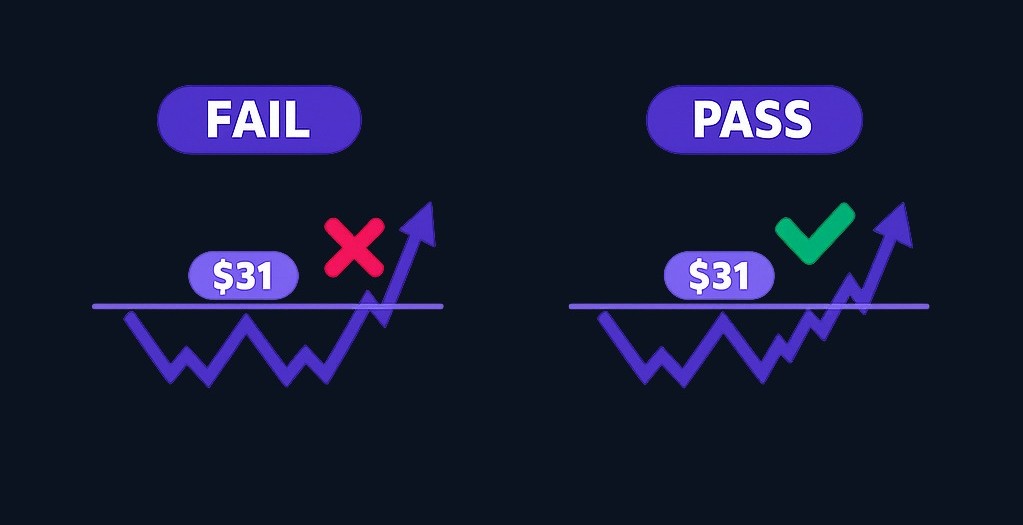
Now imagine a similar stock forms a left shoulder at $28, a head at $25, and a right shoulder near $27. It rallies toward a neckline at $31 but cannot break through. Price then turns lower.
In this case, a trader waiting for confirmation would not enter because the neckline did not break. A more aggressive trader who entered near the right shoulder would need to follow their pre-planned exit rules.
This example highlights why confirmation matters. The shape alone is not enough. The neckline is the level where the market shows whether buyers are strong enough to challenge resistance.
Example 3: Breakout followed by a pullback
Suppose price breaks above a $60 neckline, rises to $63, then pulls back toward $60. A patient trader may watch whether the old resistance area behaves like support. If price stabilizes, the trader might consider a pullback entry. If price falls back below the neckline and keeps weakening, the breakout may have failed.
This approach can help traders avoid chasing the first breakout candle, but it also requires patience. Some stocks break out and continue higher without returning to the neckline.
What to Do After You Spot the Pattern
Once you think you see an inverse head and shoulders, do not jump straight to a trade. Use a structured process:
- Confirm the prior trend. Was the stock declining before the pattern?
- Mark the three lows. Is the head clearly lower than both shoulders?
- Draw the neckline. Is there a logical resistance level?
- Choose your strategy. Breakout, pullback, or aggressive early entry?
- Define invalidation. What price action would prove the setup wrong?
- Plan your exit. Decide how you will manage losses and take profits.
- Review order risk. Remember that stop orders may not execute at or near the stop price (Schwab).
If you are still learning chart patterns, a good next step is to practice marking inverse head and shoulders setups on historical charts before using real money. Finelo is an investing education product, and educational practice can help you build pattern-recognition discipline before making independent trading decisions.
Conclusion
The inverse head and shoulders stock pattern is a bullish reversal setup that appears after a downtrend and includes a left shoulder, a lower head, a higher right shoulder, and a neckline. The neckline is the key decision area: many traders wait for price to break above it before treating the pattern as confirmed.
The best strategies are not about guessing the bottom. They are about building a repeatable plan: identify the structure, wait for confirmation if your strategy requires it, define risk, and decide how you will exit before entering. The biggest mistakes are forcing the pattern onto unclear charts, entering too early, ignoring failed breakouts, and assuming a chart pattern guarantees an outcome.
Used carefully, the inverse head and shoulders can be a useful technical-analysis framework. Used carelessly, it can become just another way to rationalize a trade. The difference is preparation, risk management, and patience.
FAQs about the Inverse Head and Shoulders Pattern
How do I identify the inverse head and shoulders pattern in real time?
Look for a prior downtrend, then three lows: a left shoulder, a deeper head, and a right shoulder that stays above the head. Draw the neckline across the rebound highs. The pattern becomes more actionable when price challenges and breaks above that neckline.
What should I do if price does not break the neckline?
If price does not break the neckline, the pattern is not confirmed under a confirmation-based strategy. You can keep watching, but entering before the breakout is a more aggressive approach and should have a clearly defined invalidation point.
Is the inverse head and shoulders pattern reliable?
It can be useful, but it is not guaranteed. Like all chart patterns, it can fail. Schwab specifically notes that stop orders used around these opportunities are not guaranteed to execute at or near the stop price, which reinforces the need for risk planning (Schwab).
Can beginners use this pattern?
Yes, beginners can study it because the structure is relatively easy to visualize. However, beginners should practice on historical charts first and focus on process: trend context, neckline confirmation, risk limits, and exit planning.
inverse head and shoulders stock patternchart analysistrading education
Practice trading with Finelo
Practice in a simulator, learn with bite-sized lessons, and build confidence before risking real money.
About the author
Finelo Team
The Finelo Team creates practical investing and trading education designed to help beginners learn faster with structured challenges, simulator practice, and bite-sized lessons.
Keep reading — Related articles

Chart Analysis
Tick Charts: How They Work, Uses, and Limitations
A tick chart builds each bar (or candle) from a fixed count of market "ticks" — individual trades or quote changes — instead of fixed time intervals. Tick charts therefore compress activity when the market is busy and stretch it when activity is light, helping traders focus on…
Finelo Team
Chart Analysis
Renko Charts: How They Work, Uses, and Limitations
A Renko chart is a price-charting method that draws uniform "bricks" only when price moves by a predefined amount, filtering out small fluctuations to highlight trends and support/resistance zones; unlike time-based candlesticks, Renko bricks form from price movement rather than fixed time intervals TradingView renko description. This guide…
Finelo Team
Chart Analysis
A Complete Guide to Point and Figure Charts
Point and Figure (P&F) charts are a price‑only charting method that records meaningful price moves while ignoring linear time, helping traders spot clean trends, support/resistance, and breakouts. P&F is a price‑focused variant of technical analysis that emphasizes market supply-and-demand visible on a single price picture CME Group.
Finelo Team


