The morning star pattern is a three-candle candlestick formation that traders use as a potential sign of a bullish reversal after a price decline Navia’s formation overview. It typically appears when selling pressure weakens, indecision enters the market, and buyers begin to regain control. A basic morning star has a long bearish candle, a small-bodied middle candle, and a stronger bullish candle that closes back into the range of the first candle. It is not a guarantee that price will rise, but it can be a useful signal when combined with trend context, volume, support levels, and risk management.
The Morning Star Pattern: A Key Indicator in Candlestick Trading

The morning star pattern is a three-candle candlestick formation that traders use as a potential sign of a bullish reversal after a price decline Navia’s formation overview.
14 min read
Practice trading with Finelo
Practice in a simulator, learn with bite-sized lessons, and build confidence before risking real money.
Want to learn more?
Practice in a simulator, learn with bite-sized lessons, and build confidence before risking real money.
Explore FineloExplore Finelo's 28-day challenges
Turn learning into a daily habit with guided challenge paths.
Introduction to the Morning Star Pattern
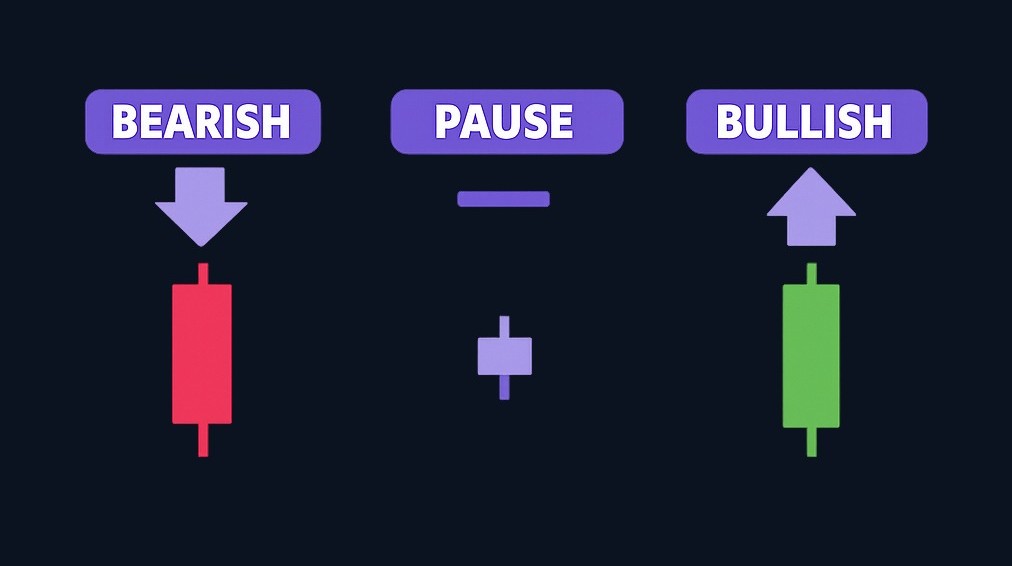
The morning star pattern is best understood as a shift in market psychology. Before it appears, price is usually moving lower and bearish sentiment is dominant. The first candle reflects that pressure. The second candle shows hesitation: sellers may still be active, but they are no longer pushing price down with the same force. The third candle shows buyers stepping in with enough strength to challenge the prior decline.
Traders watch this pattern because it can mark a turning point from bearish price action to a possible bullish move. However, “possible” is the key word. A morning star is a signal, not a complete trading plan. It works best when it appears in a logical area, such as near prior support, after an extended decline, or alongside other confirming evidence.
A simple way to think about it:
Bearish control → indecision → bullish response
That three-step transition is what gives the morning star its meaning.
Understanding the Candlestick Formation
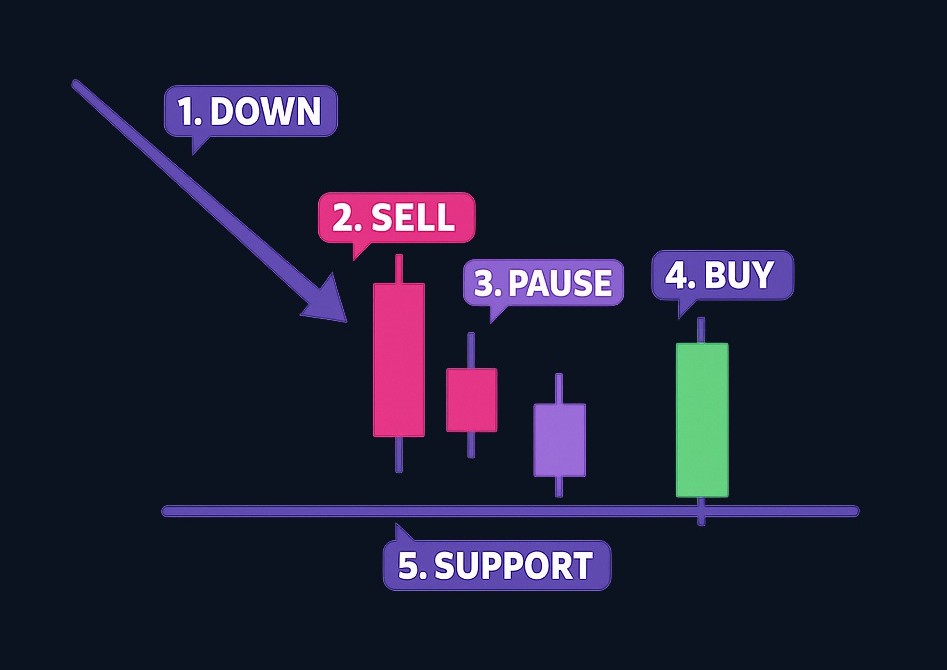
A classic morning star pattern has three candles:
| Candle | What it usually looks like | What it may suggest |
|---|---|---|
| First candle | Long bearish candle | Sellers are in control |
| Second candle | Small-bodied candle, often near the low | Momentum is slowing or the market is undecided |
| Third candle | Bullish candle closing meaningfully into the first candle’s body | Buyers are attempting to reverse the move |
The exact shape can vary. The middle candle may be bullish, bearish, or nearly neutral; a doji is one recognized variation Investopedia’s morning star comparison. Some traders prefer to see a gap between the first and second candles, but in many liquid markets, especially those that trade continuously or nearly continuously, clean gaps may be less common. For that reason, the broader structure matters more than a textbook-perfect image.
The most important features are:
- A prior downward move
- A strong bearish first candle
- A small or indecisive second candle
- A bullish third candle that shows a meaningful recovery
- A location where a reversal would make sense, such as support or an oversold area
Without a preceding decline, the pattern loses much of its meaning. A morning star is a bullish reversal pattern, so it needs something to reverse.
How to Identify the Morning Star Pattern
To identify the morning star pattern, start with context rather than candle shape alone. Many traders make the mistake of scanning charts for three candles that “look right” without asking whether the market conditions support a reversal.
Use this checklist:
- Trend context: Was price declining before the pattern formed?
- First candle: Did sellers create a noticeably bearish candle?
- Second candle: Did the next candle show hesitation, a small body, or reduced momentum?
- Third candle: Did buyers produce a strong bullish close?
- Location: Did the pattern form near support, a prior demand zone, a trendline, or another meaningful level?
- Confirmation: Did price continue higher after the pattern, or did the signal immediately fail?
- Risk plan: Is there a logical place to define invalidation before entering?
A practical identification process might look like this:
- Zoom out first. Determine whether the market has been falling or correcting.
- Mark nearby support. Look for previous swing lows, consolidation areas, or levels where price reacted before.
- Find the three-candle structure. Confirm that the candles show the transition from selling pressure to hesitation to buying pressure, and wait for the complete formation rather than assuming it early Dukascopy’s pattern checklist.
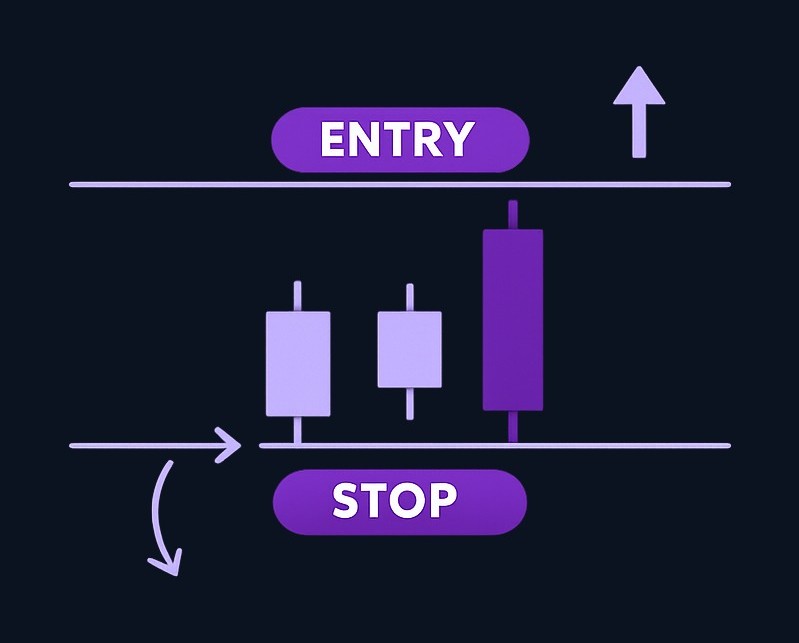
- Wait for confirmation. Many traders prefer not to act until price moves above the high of the third candle or another nearby trigger level.
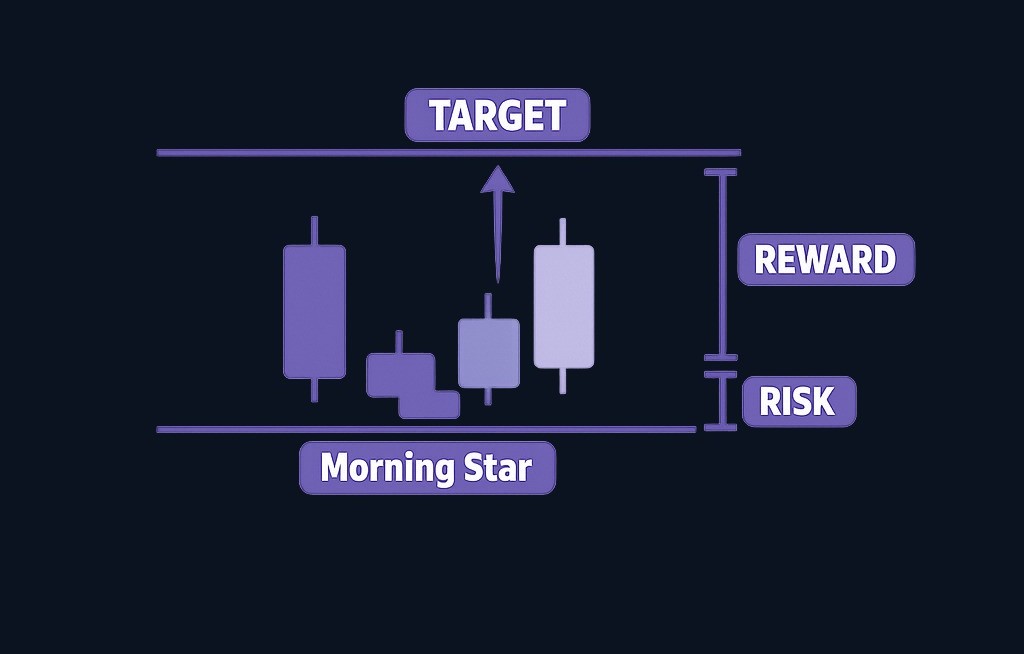
- Define invalidation. If price falls below the pattern’s low, the bullish reversal idea may no longer be valid.
Example: A Hypothetical Morning Star Setup
Imagine a stock has declined for several sessions and reaches an area where buyers previously stepped in. On day one, it prints a long bearish candle. On day two, the candle is small and closes near where it opened, suggesting the selloff has paused. On day three, price rises and closes well into the body of the first candle.
A trader watching this setup might interpret it as a potential shift in control. But instead of buying simply because the pattern appears, they might wait for price to break above the third candle’s high. They might then place a stop-loss below the lowest point of the pattern, because a move below that level would weaken the reversal thesis.
This is not a prediction that the trade will work. It is a structured way to connect the pattern, entry trigger, and risk.
Trading Strategies Using the Morning Star Pattern
The best strategies for trading the morning star pattern usually combine the candle signal with confirmation and risk management. The pattern alone can be too broad, especially in choppy markets.
1. Confirmation Entry Strategy
A confirmation-based approach waits for price to prove that buyers are still active after the third candle forms.
A common framework:
- Identify a valid morning star after a decline.
- Mark the high of the third candle.
- Consider entry only if price breaks above that high.
- Place invalidation below the pattern low or below a nearby support level.
- Plan profit-taking near prior resistance, a recent swing high, or a favorable risk-reward area.
This approach may reduce false entries, but it can also mean entering at a higher price. That trade-off is normal: waiting for confirmation may improve signal quality, but it can reduce the potential reward relative to risk.
2. Support-Level Strategy
The morning star is often more meaningful when it appears at a price level where buyers have reacted before. In this approach, the pattern is not the only reason for the trade; it acts as confirmation of a broader support area.
For example, if price revisits a previous swing low and forms a morning star, a trader may view the pattern as evidence that the support level is attracting buyers again. The setup is stronger if the third candle closes decisively and price does not immediately fall back into the pattern.
The caveat: support levels can fail. A morning star at support should still have a defined invalidation point.
3. Indicator-Confirmed Strategy
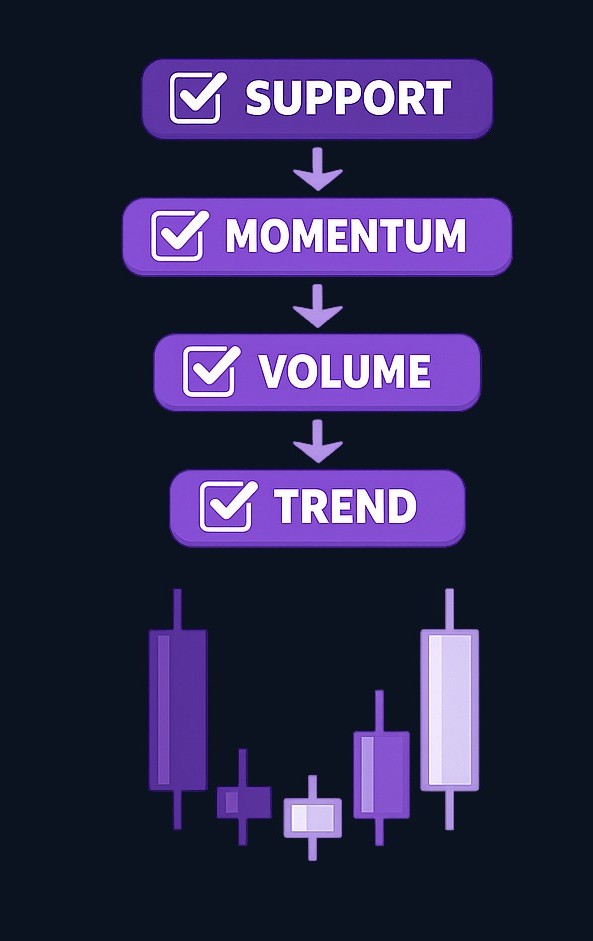
Some traders combine the morning star with indicators to avoid relying only on candlesticks. Common confirmation tools include moving averages, momentum indicators, volume analysis, or broader trend filters.
A simple decision framework:
| Question | Why it matters |
|---|---|
| Is the broader market stable or improving? | Strong external pressure can weaken reversal signals |
| Is the pattern forming near support? | Location improves context |
| Is momentum improving? | Helps confirm that selling pressure may be slowing |
| Is volume supportive? | Strong participation can add confidence |
| Is the risk clearly defined? | Prevents a pattern from becoming an emotional trade |
Indicators should not be used to force a trade. If the morning star appears but the broader trend remains strongly bearish, momentum is weak, and price is below major resistance, it may be better to wait.
4. Multi-Time-Frame Strategy
Time frame matters. A morning star on a daily chart may carry different weight than one on a five-minute chart. Shorter time frames often produce more signals, but they can also produce more noise. Longer time frames may produce fewer signals, but they may reflect a broader shift in market behavior.
A practical approach is to align time frames:
- Use a higher time frame to identify the main trend and key levels.
- Use the trading time frame to identify the morning star.
- Use a lower time frame only for refining entry, if needed.
For example, a trader might see that a daily chart is pulling back into support, then look for a morning star on the four-hour chart. This does not guarantee a reversal, but it helps avoid trading the pattern in isolation.
Setting Stop-Loss and Take-Profit Levels
A morning star strategy should define risk before entry. Without a plan, the pattern can become a vague reason to buy rather than a structured setup.
Common stop-loss approaches include:
- Below the pattern low: This is the most direct invalidation point. If price breaks below the lowest candle in the pattern, the bullish reversal idea may be weakened.
- Below support: If the pattern forms near a support zone, some traders place the stop beyond that zone rather than directly under the candle.
- Volatility-adjusted stop: In more volatile markets, traders may allow extra room so normal price movement does not trigger an early exit.
Common take-profit approaches include:
- Prior resistance: A previous swing high or supply area can be a logical target.
- Risk-reward framework: Some traders look for setups where the potential reward is at least meaningfully larger than the risk.
- Partial exits: A trader may reduce position size at an initial target and leave a smaller portion open if momentum continues.
The important point is consistency. A trader should know where the setup is invalidated and where they may take profit before entering.
Practice trading with Finelo
Practice in a simulator, learn with bite-sized lessons, and build confidence before risking real money.
Pros and Cons of the Morning Star Pattern
The morning star pattern is popular because it is visual, intuitive, and easy to explain. But like all candlestick patterns, it has limitations.
| Pros | Cons |
|---|---|
| Easy to recognize once you understand the three-candle structure | Can produce false signals in choppy or strongly bearish markets |
| Helps traders spot possible bullish reversals | Works poorly when used without context |
| Can be combined with support, volume, and indicators | Textbook examples are not always common in real charts |
| Provides a logical area for invalidation | Late entries may reduce risk-reward quality |
| Useful across different markets and time frames in principle | News, earnings, and sudden market events can override technical signals |
The biggest advantage is that the pattern gives traders a structured way to observe a shift in price action. The biggest drawback is that a shift in candles does not always lead to a sustained trend change.
Market news and events can also affect reliability. A morning star that forms before a major announcement may be less useful because new information can quickly change market expectations. In those situations, traders may choose to wait until volatility settles rather than relying on the candle pattern alone.
Morning Star vs. Other Candlestick Patterns
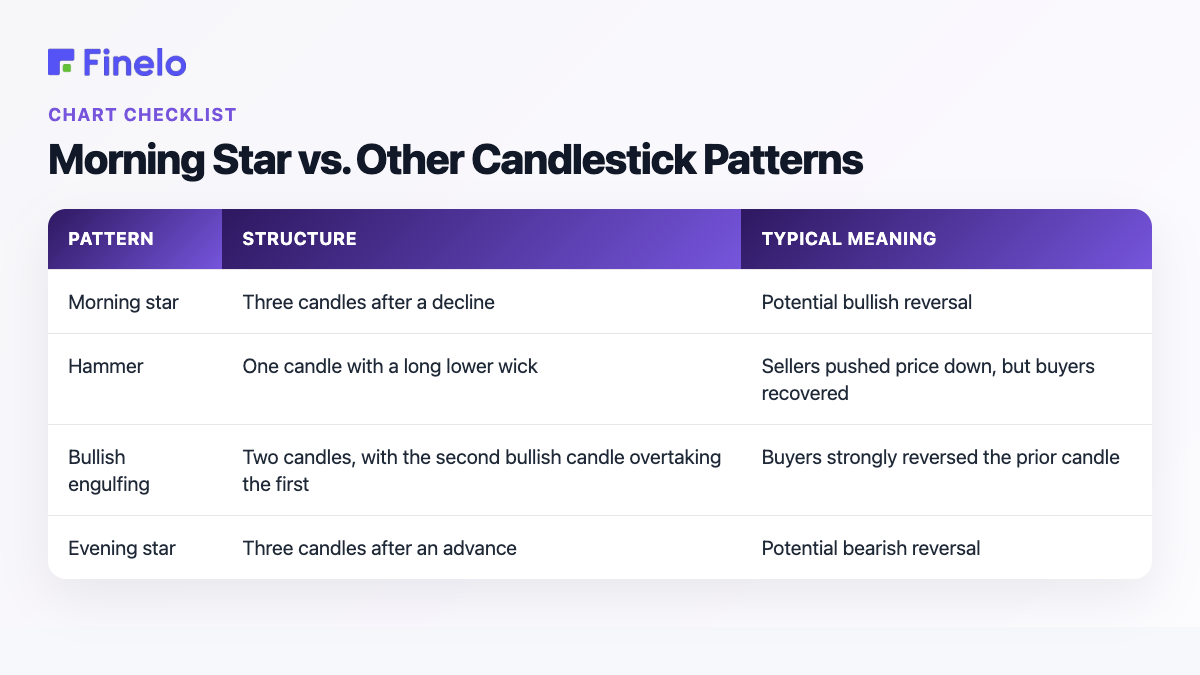
The morning star is one of several reversal patterns. Comparing it with others can help clarify when it is useful.
| Pattern | Structure | Typical meaning |
|---|---|---|
| Morning star | Three candles after a decline | Potential bullish reversal |
| Hammer | One candle with a long lower wick | Sellers pushed price down, but buyers recovered |
| Bullish engulfing | Two candles, with the second bullish candle overtaking the first | Buyers strongly reversed the prior candle |
| Evening star | Three candles after an advance | Potential bearish reversal |
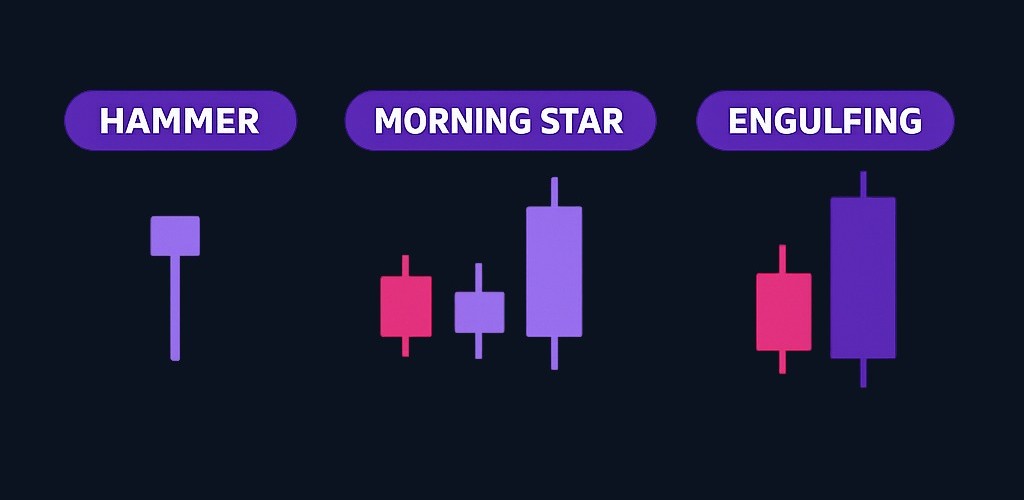
The morning star gives more sequence-based information than a single-candle hammer because it shows three phases: selling, hesitation, and buying. A bullish engulfing pattern may show a faster reversal, but it does not always include the same pause or indecision phase.
No pattern is automatically “better.” The right question is: which pattern appears in the strongest context, with the clearest risk level and the most convincing confirmation?
Common Mistakes to Avoid
Many beginner traders overvalue the appearance of the pattern and undervalue the conditions around it. The morning star is most useful when it is part of a broader trading plan.
Avoid these mistakes:
- Trading it without a prior downtrend: Without a decline, it is not truly a bullish reversal setup.
- Ignoring support and resistance: Location helps determine whether the pattern has practical meaning.
- Entering before the third candle closes: An unfinished candle can change shape before the session ends.
- Using no stop-loss: Even clean-looking patterns can fail.
- Assuming every small middle candle qualifies: The pattern should show a clear change in momentum, not just random sideways movement.
- Forgetting about news risk: Major events can overwhelm technical setups.
- Using the same expectations on every time frame: A pattern on a short-term chart may behave differently from one on a daily or weekly chart.
A useful rule: if you cannot explain why the pattern formed in that location and where the idea becomes invalid, the setup may not be clear enough to trade.
Conclusion: How to Use the Morning Star Pattern Responsibly
The morning star pattern is a bullish reversal signal built from three candles: a bearish candle, an indecision candle, and a bullish response candle. It can help traders recognize when selling pressure may be weakening, but it should not be used as a standalone prediction tool.
A practical next step is to build a repeatable checklist:
- Confirm there was a prior decline.
- Check that the three-candle structure is clear.
- Look for support or another meaningful location.
- Wait for confirmation if your strategy requires it.
- Define stop-loss and take-profit levels before entering.
- Review the trade afterward, whether it worked or not.
Used carefully, the morning star can become part of a disciplined technical analysis process. Used casually, it can become just another chart shape. Keep the focus on context, confirmation, and risk.
If you want to keep building your investing knowledge in a structured way, you can explore financial education resources from Finelo.
Frequently Asked Questions
What is the best time frame to trade the morning star pattern?
There is no single best time frame. Shorter time frames may create more signals, but they can also be noisier. Longer time frames may produce fewer signals, but they can reflect broader market behavior. Many traders compare multiple time frames before acting.
How can I confirm a morning star pattern before entering a trade?
Common confirmation methods include waiting for price to break above the third candle’s high, checking whether the pattern formed near support, looking for improving momentum, or using volume and trend indicators. Confirmation can reduce impulsive entries, though it may also lead to a later entry.
Can the morning star pattern be used in all markets?
It can be applied to many charted markets because it is based on price action. However, market structure, liquidity, volatility, and news events can affect how useful the signal is. The pattern should be tested and adapted to the specific market being traded.
What are the limitations of the morning star pattern?
The main limitation is that it can fail, especially in strong downtrends or sideways markets. It also depends heavily on context. A morning star without support, confirmation, or a defined risk plan is much weaker than one that fits into a broader trading strategy.
morning star patternchart analysistrading education
Practice trading with Finelo
Practice in a simulator, learn with bite-sized lessons, and build confidence before risking real money.
About the author
Finelo Team
The Finelo Team creates practical investing and trading education designed to help beginners learn faster with structured challenges, simulator practice, and bite-sized lessons.
Keep reading — Related articles

Chart Analysis
Tick Charts: How They Work, Uses, and Limitations
A tick chart builds each bar (or candle) from a fixed count of market "ticks" — individual trades or quote changes — instead of fixed time intervals. Tick charts therefore compress activity when the market is busy and stretch it when activity is light, helping traders focus on…
Finelo Team
Chart Analysis
Renko Charts: How They Work, Uses, and Limitations
A Renko chart is a price-charting method that draws uniform "bricks" only when price moves by a predefined amount, filtering out small fluctuations to highlight trends and support/resistance zones; unlike time-based candlesticks, Renko bricks form from price movement rather than fixed time intervals TradingView renko description. This guide…
Finelo Team
Chart Analysis
A Complete Guide to Point and Figure Charts
Point and Figure (P&F) charts are a price‑only charting method that records meaningful price moves while ignoring linear time, helping traders spot clean trends, support/resistance, and breakouts. P&F is a price‑focused variant of technical analysis that emphasizes market supply-and-demand visible on a single price picture CME Group.
Finelo Team


