A shooting star candlestick pattern is a potential bearish reversal signal that appears after an upward price move. It has a small real body near the candle’s low, a long upper shadow, and little or no lower shadow. The shape shows that buyers drove the price higher during the period but could not hold those gains before the close. It is a warning—not proof—that bullish momentum may be weakening. Traders generally get a more useful signal by checking the preceding trend, waiting for confirmation, and defining risk before taking a position.
The Shooting Star Candlestick Pattern: What It Is and How to Trade It

A shooting star candlestick pattern is a potential bearish reversal signal that appears after an upward price move. It has a small real body near the candle’s low, a long upper shadow, and little or no lower shadow…
9 min read
Practice trading with Finelo
Practice in a simulator, learn with bite-sized lessons, and build confidence before risking real money.
Want to learn more?
Practice in a simulator, learn with bite-sized lessons, and build confidence before risking real money.
Explore FineloExplore Finelo's 28-day challenges
Turn learning into a daily habit with guided challenge paths.
This guide is for beginners who want a practical way to identify the pattern, distinguish it from similar candles, and decide whether it deserves action or observation.
What a Shooting Star Candlestick Means
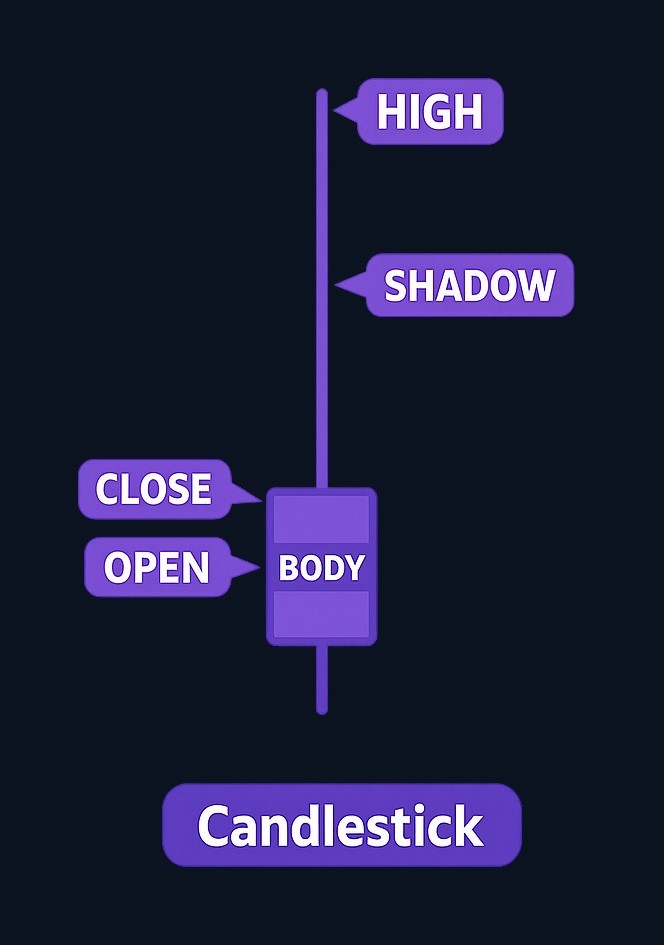
Every candlestick condenses four prices for a chosen period: the open, high, low, and close. In a shooting star, the distance between the high and the candle’s body creates the prominent upper shadow.
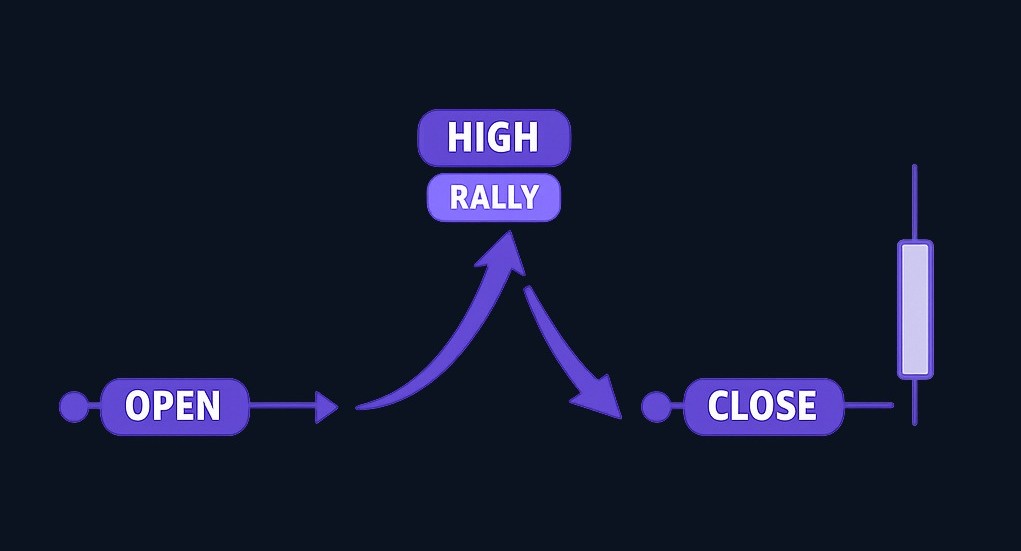
The price action tells a simple story:
- The market opens and buyers push the price noticeably higher.
- That advance attracts selling or loses buying support.
- Price falls back and closes near where it opened.
Charles Schwab describes the same sequence: the price opens, rallies significantly, and is then pushed back near the opening price as buyers fail to sustain the move (Schwab).
The location of the candle is as important as its shape. A shooting star is normally interpreted after an advance, where rejection of higher prices could matter. An identical-looking candle after a decline has a different context and is commonly discussed as an inverted hammer. The candle’s color may add nuance, but its structure and location carry more meaning than color alone.
Characteristics of a Shooting Star
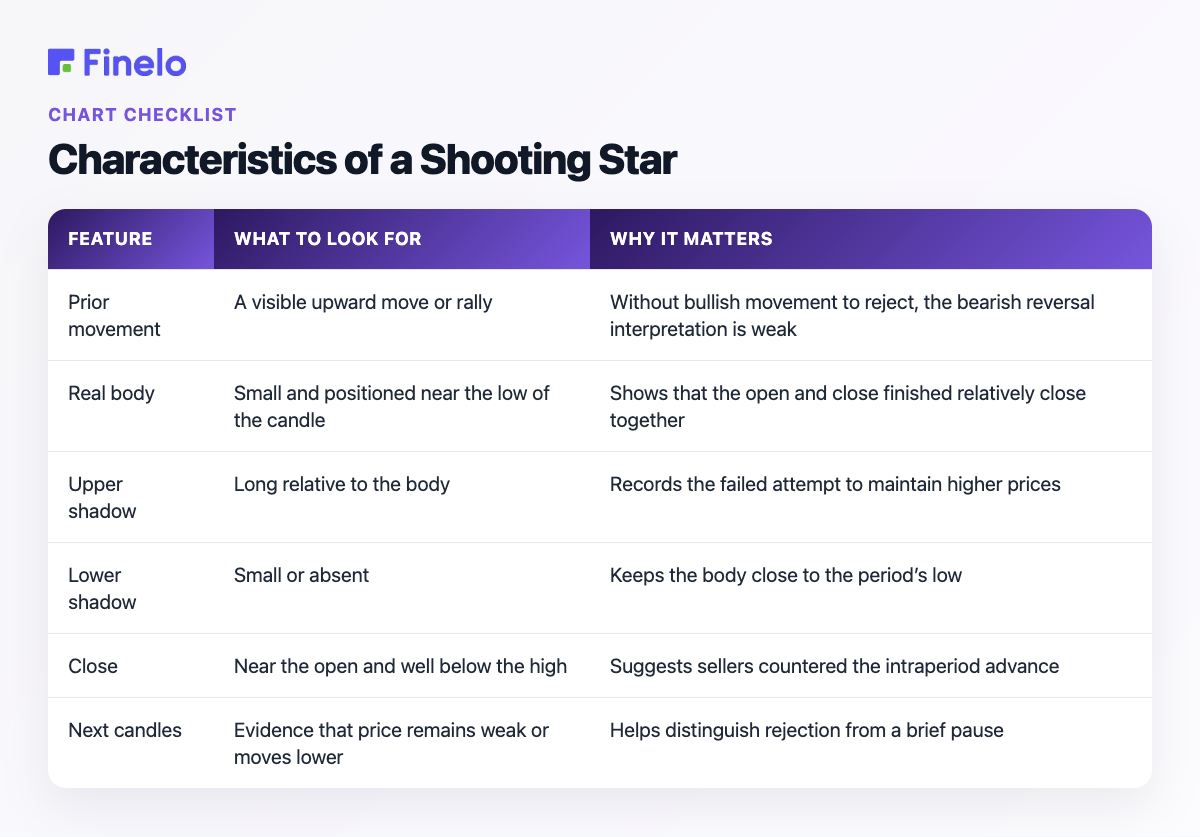
Use the following table as a recognition checklist rather than a rigid formula.
| Feature | What to look for | Why it matters |
|---|---|---|
| Prior movement | A visible upward move or rally | Without bullish movement to reject, the bearish reversal interpretation is weak |
| Real body | Small and positioned near the low of the candle | Shows that the open and close finished relatively close together |
| Upper shadow | Long relative to the body | Records the failed attempt to maintain higher prices |
| Lower shadow | Small or absent | Keeps the body close to the period’s low |
| Close | Near the open and well below the high | Suggests sellers countered the intraperiod advance |
| Next candles | Evidence that price remains weak or moves lower | Helps distinguish rejection from a brief pause |
Charting platforms use different candle colors, so do not rely on red, green, black, or white alone. Read the open and close correctly for the chart in front of you.
The underlying market psychology
The long upper shadow represents a change within a single period. Buyers were initially willing to transact at progressively higher prices, but that pressure did not last. By the close, sellers had erased much of the advance.
That shift can make the candle useful as an alert. However, it does not reveal why the move occurred, who traded, or what the next candle must do. A strong trend can pause, print a shooting-star shape, and then continue upward. Treat the pattern as evidence of rejection, not a guaranteed forecast.
How to Identify the Pattern Step by Step
1. Confirm the market was moving upward
Start by zooming out. Ask whether price was making a meaningful advance before the candle appeared. A star-shaped candle in a sideways range may simply reflect two-way trading, while one after a sustained push has clearer reversal context.
The relevant trend depends on the timeframe. A shooting star on an hourly chart may mark only a short-lived pullback inside a larger daily uptrend. Make sure the timeframe matches the decision you are considering.
2. Inspect the body and shadows
Look for a compact body near the bottom of the candle’s total range and a conspicuous upper shadow. The pattern should communicate rejection at a glance: price traveled upward but finished much closer to the opening area than to the high.
Avoid forcing an imperfect candle into the label. If the body is large, the upper shadow is modest, or a substantial lower shadow is present, the price action may not express the same sharp rejection.
3. Mark the candle’s high and low
These levels create a simple decision framework. The high represents the area where the advance failed. The low is a nearby reference for judging whether sellers gain control after the pattern.
Do not assume either level will hold. They are observation points, not promises.
4. Wait for the next price information
The shooting star is complete when its period closes, but its implication remains unconfirmed. A following move below the star’s low may strengthen the bearish reading. A move above its high weakens it and may invalidate a bearish setup.
Waiting carries a trade-off: confirmation can filter some weak signals, but it may also produce a later entry and a wider distance to a logical risk level. That trade-off should be decided in advance rather than improvised after price moves.
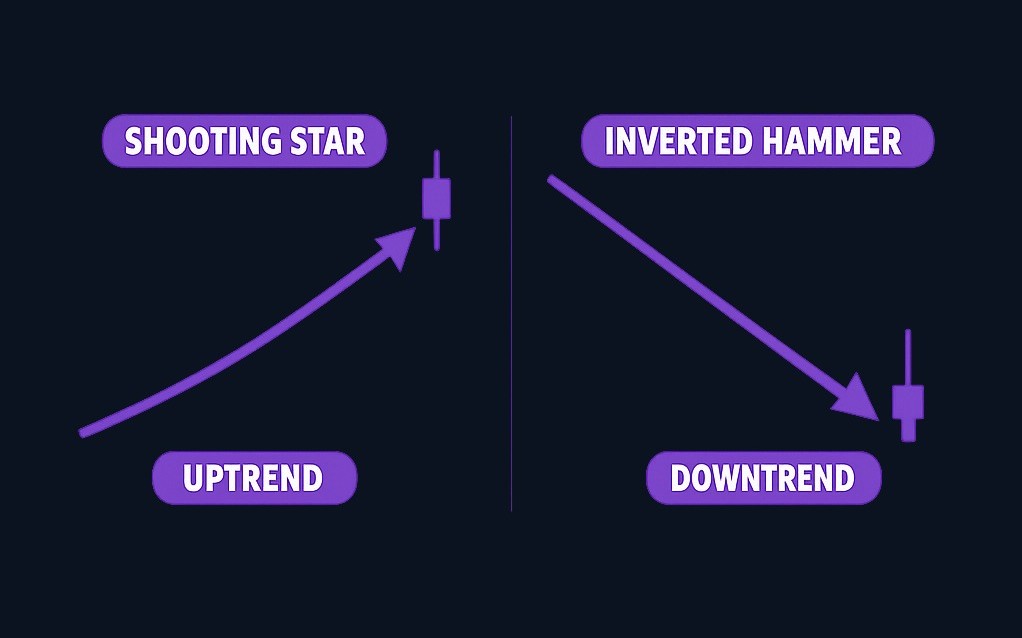
Shooting Star vs. Inverted Hammer
These patterns can look nearly identical, which is why context matters more than memorizing the silhouette.
| Pattern | Typical location | Usual interpretation |
|---|---|---|
| Shooting star | After an upward move | Possible bearish reversal or pullback |
| Inverted hammer | After a downward move | Possible bullish reversal attempt |
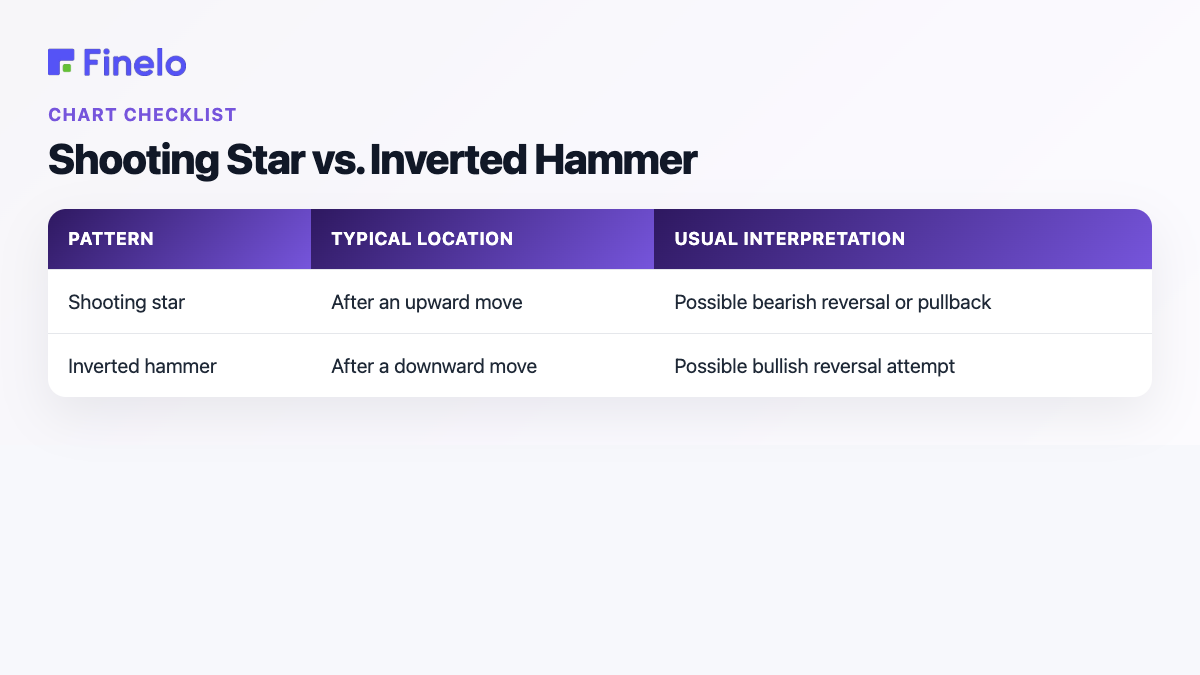
Both shapes show a substantial intraperiod move above the open-close area. Their names change because the preceding price movement changes the question. After a rally, traders ask whether buyers have exhausted themselves. After a decline, they ask whether buyers are beginning to challenge sellers.
A candle should therefore never be labeled from its shape alone. Read left to right: first establish the trend, then interpret the candle.
Practice trading with Finelo
Practice in a simulator, learn with bite-sized lessons, and build confidence before risking real money.
Ways Traders Use a Shooting Star
The pattern can support several approaches, but none removes market risk. The examples below are educational frameworks, not personalized trade recommendations.
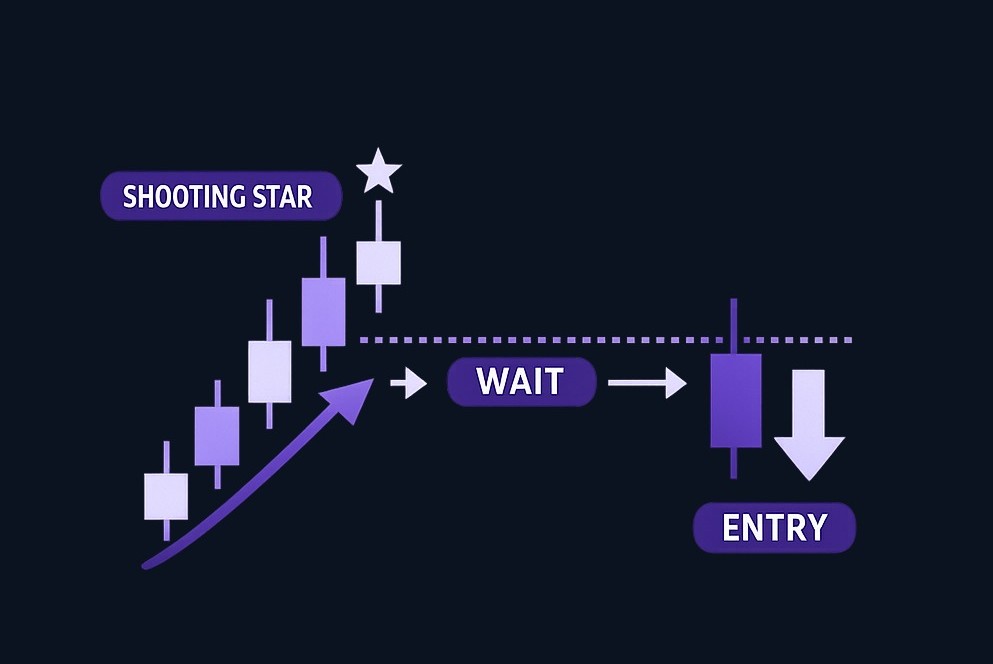
Confirmation-based entry
A cautious approach waits until price trades or closes below the shooting star’s low. The idea is that rejection at the high is more meaningful if sellers can also push through the candle’s lower boundary.
For example, imagine a stock rallies for several sessions and then forms a shooting star. Instead of selling immediately at the close, a trader watches the next session. If price remains above the star’s low, there is no confirmed entry under this rule. If it breaks below, the trader then evaluates whether the available reward justifies the risk.
Resistance-based setup
A shooting star may be more relevant when its upper shadow reaches an area where price previously struggled. The level and the candle then tell a combined story: the market revisited a contested zone and again failed to remain there.
This does not make the level certain to hold. A later breakout above the star’s high would contradict the bearish thesis.
Managing an existing long position
A holder does not have to treat every shooting star as a signal to exit completely. Depending on the original plan, the candle may prompt a review of exposure, a tighter risk threshold, or no change until confirmation appears.
The key is consistency. A decision rule written before the candle forms is less vulnerable to fear after a sudden reversal or excitement after a renewed rally.
Short-selling framework
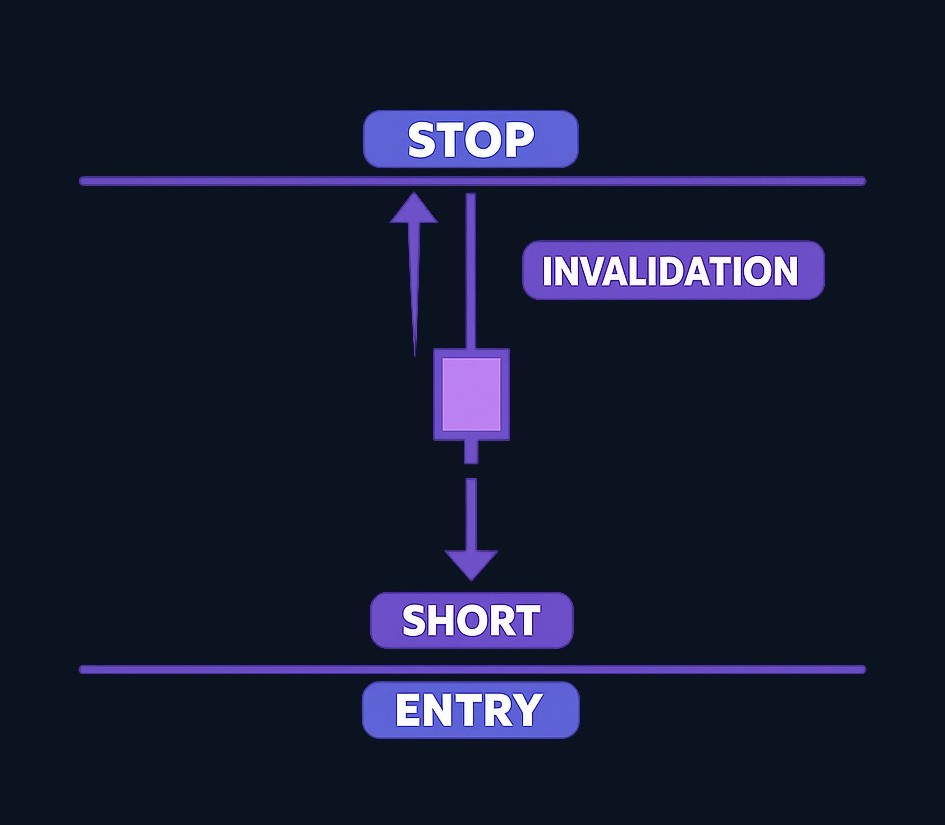
Some traders may interpret a confirmed shooting star as a short setup. Short selling introduces risks that differ from simply reducing a long position, so the entry, invalidation point, position size, and exit plan need to be explicit.
A common chart-based invalidation idea is a move above the star’s high, because price would have returned through the rejection area. That does not ensure a stop order will execute at a particular price, and any strategy must account for gaps and volatility.
How to Confirm a Shooting Star
Confirmation should answer a precise question: has the market shown additional evidence that the failed rally matters?
Useful checks include:
- Subsequent price action: Does the next candle move below the star’s low, or does price quickly reclaim the rejected area?
- Trend structure: Has the market stopped making higher highs and higher lows, or is the broader uptrend still intact?
- Nearby levels: Did the upper shadow reject a previously important price area?
- Momentum context: Is momentum weakening while price tests a high, or does the advance remain strong?
- Trading activity: Does participation appear to support the rejection, or is the candle forming in quiet, irregular conditions?
- Timeframe agreement: Does a higher timeframe also show resistance or weakening, or does it contradict the lower-timeframe signal?
These checks should be used to build a coherent case, not to collect indicators until one agrees with a desired trade. If the evidence conflicts, doing nothing is a valid decision.
Schwab notes that reversal patterns may not mean much in isolation and are better treated as corroborating evidence (Schwab). That limitation is central to using the shooting star responsibly.
Common Mistakes and Limitations
Treating the candle as an automatic sell signal
One candle cannot guarantee that an uptrend is over. Price may consolidate briefly, ignore the pattern, or break above the high. Acting automatically confuses a warning with a complete strategy.
Ignoring the preceding trend
The same shape in a decline is not interpreted as a shooting star. The same shape in a range may have little directional value. Always identify where it formed before deciding what it means.
Entering before the candle closes
An apparent shooting star can change dramatically before the period ends. Price may rally again, enlarge the body, or remove the upper-shadow structure. Base a candlestick reading on a completed candle.
Using arbitrary stops or oversized positions
Even a well-defined setup can fail. Position size should reflect the distance to the invalidation point and the amount the trader is prepared to lose—not confidence in the pattern’s appearance.
Chasing a move after late confirmation
If price has already fallen far below the candle, the remaining downside may no longer justify the distance to a sensible invalidation level. Missing a setup can be preferable to accepting an unattractive risk-reward relationship.
Assuming every reversal becomes a major downtrend
A shooting star may precede a small pullback rather than a lasting bearish trend. Define what would count as success, failure, and an exit before entering.
Looking for a universal success rate
The result depends on the market, timeframe, trend definition, confirmation rule, exit method, trading costs, and test period. A broad percentage detached from those inputs would not tell a trader how a specific plan is likely to behave. Test the exact rules you intend to use rather than relying on an unsupported summary statistic.
A Practical Decision Checklist
Before acting on a shooting star, ask:
- Was there a clear upward move before the candle?
- Is the body small and near the candle’s low?
- Is the upper shadow visually dominant?
- Did the candle close before I evaluated it?
- Is there a meaningful nearby resistance area?
- What specific event confirms the setup?
- What price invalidates the idea?
- Is the potential reward reasonable relative to the planned risk?
- How much capital would be at risk?
- What will I do if there is no confirmation?
If several answers are unclear, the setup is unclear. The appropriate response may be to wait, reduce size, or skip the trade.
Practical Next Steps
Begin by practicing identification rather than trading. Review historical charts and mark the prior trend, the star’s high and low, the next candle, and the eventual outcome. Include failed examples so you do not train yourself to notice only patterns that worked.
Next, write one objective rule set. For example: define the required preceding rise, describe the candle shape, specify the confirmation event, choose an invalidation level, and set a maximum acceptable risk. Then review how that exact framework behaves across different chart conditions.
Finelo focuses on investment learning and financial education, making this kind of structured chart-reading exercise suitable for building foundational knowledge (Finelo). The goal is not to predict every turn. It is to make decisions more deliberate, testable, and risk-aware.
Frequently asked questions
Is a shooting star bullish or bearish?
It is generally read as a potential bearish reversal pattern when it appears after an upward move. Its shape alone is not enough; the prior trend and later confirmation determine whether the bearish interpretation is useful.
Does the shooting star have to be a red candle?
No. The relationship among the open, high, low, and close—and the candle’s location after an advance—matters more than the chart color. A bearish close may look more forceful, but either candle color can show rejection of higher prices.
What if there is no confirmation after a shooting star?
If your strategy requires confirmation, there is no trade. Price moving sideways or above the star’s high suggests that sellers have not established the expected control. Waiting protects the consistency of the rule, even though it means some moves will be missed.
How reliable is the shooting star pattern?
Its reliability cannot be separated from context and trading rules. Market, timeframe, trend strength, confirmation, entry, and exit choices all affect results. It is best used as one piece of evidence within a defined process rather than as a standalone prediction.
Chart AnalysisCandlesticksTechnical AnalysisBeginner
Practice trading with Finelo
Practice in a simulator, learn with bite-sized lessons, and build confidence before risking real money.
About the author
Finelo Team
The Finelo Team creates practical investing and trading education designed to help beginners learn faster with structured challenges, simulator practice, and bite-sized lessons.
Keep reading — Related articles

Chart Analysis
Tick Charts: How They Work, Uses, and Limitations
A tick chart builds each bar (or candle) from a fixed count of market "ticks" — individual trades or quote changes — instead of fixed time intervals. Tick charts therefore compress activity when the market is busy and stretch it when activity is light, helping traders focus on…
Finelo Team
Chart Analysis
Renko Charts: How They Work, Uses, and Limitations
A Renko chart is a price-charting method that draws uniform "bricks" only when price moves by a predefined amount, filtering out small fluctuations to highlight trends and support/resistance zones; unlike time-based candlesticks, Renko bricks form from price movement rather than fixed time intervals TradingView renko description. This guide…
Finelo Team
Chart Analysis
A Complete Guide to Point and Figure Charts
Point and Figure (P&F) charts are a price‑only charting method that records meaningful price moves while ignoring linear time, helping traders spot clean trends, support/resistance, and breakouts. P&F is a price‑focused variant of technical analysis that emphasizes market supply-and-demand visible on a single price picture CME Group.
Finelo Team


