The cup and handle pattern is a bullish chart formation traders use in technical analysis to study a possible continuation higher after a pause. On the chart it looks like a rounded "cup," where price falls, stabilizes, and recovers, followed by a smaller pullback called the "handle." Many traders wait for price to break above the resistance near the top of the cup before treating the setup as confirmed.
Cup and Handle Pattern: A Beginner's Guide to Reading It
The cup and handle is a bullish chart pattern with a rounded base and a smaller pullback near resistance. Learn how to spot it, plan an entry, target, and stop, and recognize when it fails.
7 min read
Practice trading with Finelo
Practice in a simulator, learn with bite-sized lessons, and build confidence before risking real money.
Want to learn more?
Practice in a simulator, learn with bite-sized lessons, and build confidence before risking real money.
Explore FineloExplore Finelo's 28-day challenges
Turn learning into a daily habit with guided challenge paths.
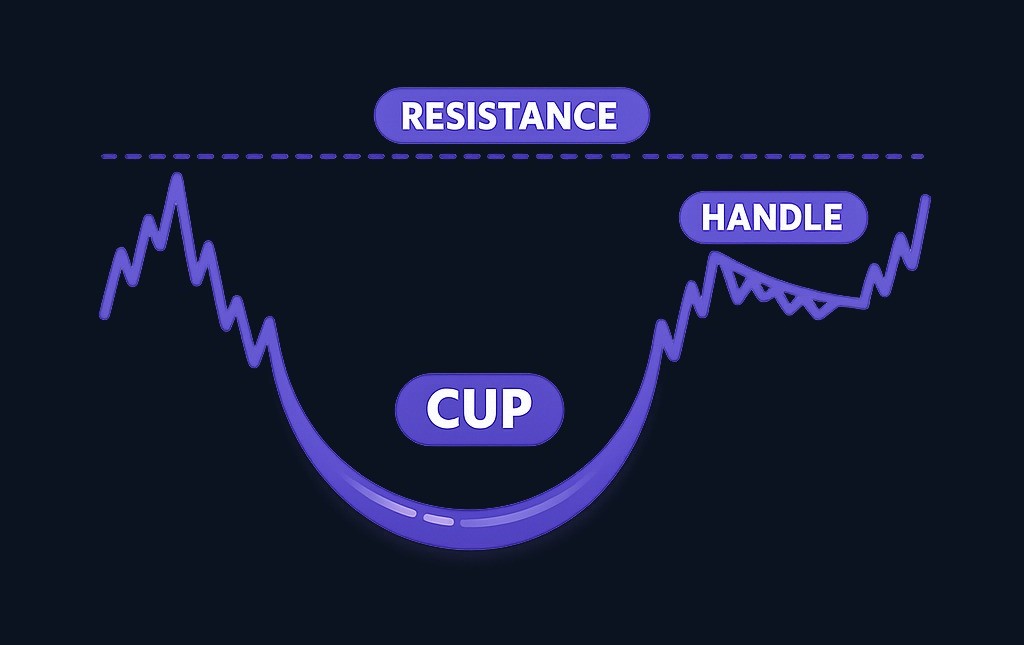
This guide is for beginners who want a plain explanation rather than "just buy the breakout." You will learn the cup and handle pattern meaning, how to spot it, how traders plan an entry, target, and stop, and where it tends to fail.
It's important to remember: a chart pattern is a way to organize a decision, not a promise about what price will do next.
What the cup and handle pattern means
Picture a tea cup viewed from the side: the bowl is a rounded base that forms as sellers lose momentum and buyers slowly return, and the handle is the small dip near the right rim before price tries to push higher. That "tea cup and handle pattern" image is where the name comes from.
A cup and handle candlestick pattern does not depend on a single candle. It is a multi-candle chart pattern built from many price bars over days or weeks, so the overall structure matters more than any one candle. The cup and handle trading pattern is usually a bullish continuation within an existing uptrend, though it can appear after a downtrend as a possible reversal, which calls for more caution.
The two parts: the cup and the handle
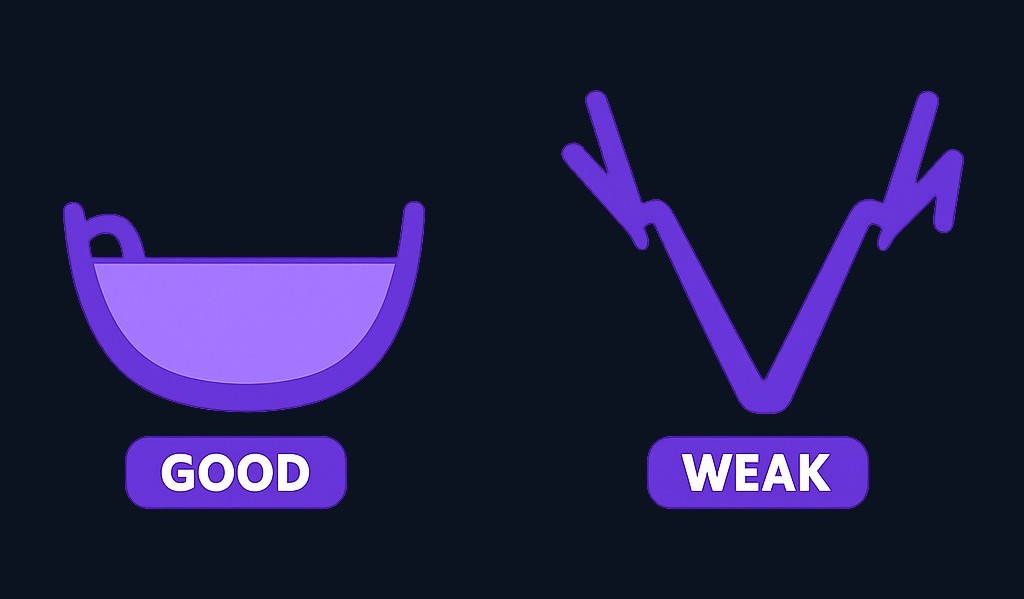
The cup is the larger rounded portion: price declines from a prior high, flattens at the bottom, and curves back toward the earlier resistance. A clean cup looks rounded, not like a sharp "V"; a fast plunge and instant rebound can still lead to a rally, but it lacks the gradual shift from selling to buying that defines the pattern.
The handle is the smaller pause near the right side, close to resistance. It should be clearly smaller than the cup and should not collapse deep into the base; one that falls too far, or turns sharply volatile, signals the structure is breaking down. Note that the resistance line need not be perfectly flat: it often slopes slightly up or down, so most traders treat it as a zone rather than one exact price.
How to spot it on a chart
Read it as a sequence. Start with trend context: a textbook cup and handle follows an uptrend, so it reads as a rest stop, not a bottom-fishing guess. Check the cup's shape, where rounded and gradual is ideal, then find the resistance zone on the right and watch the handle form just beneath it, staying in the upper part of the cup.
Finally, look at volume with realistic expectations. Many traders like to see volume contract while the handle forms and expand on the breakout, since that can suggest rising participation. Volume is a supporting clue, not proof, and it is not equally reliable across markets.
A worked example: entry, target, and stop
The numbers here are illustrative only, chosen to show the method, not a real trade or a suggestion. Imagine a stock climbs from 40 to 60, pulls back to 48 over several weeks, recovers to the 59 to 60 area, then forms a handle that drifts to 56 before curling back up. A trader might mark 60 as the breakout area, 56 as the handle low, and 48 as the cup bottom.
Many traders wait for the handle to complete and price to break resistance before entering. For the target, a common educational method measures the cup's depth and projects it up from the breakout: 60 minus 48 is 12, added to 60 gives a hypothetical 72. This is a planning estimate, not a prediction, and not a guaranteed outcome. The stop often sits below the handle low, since a drop under that area can invalidate the setup.
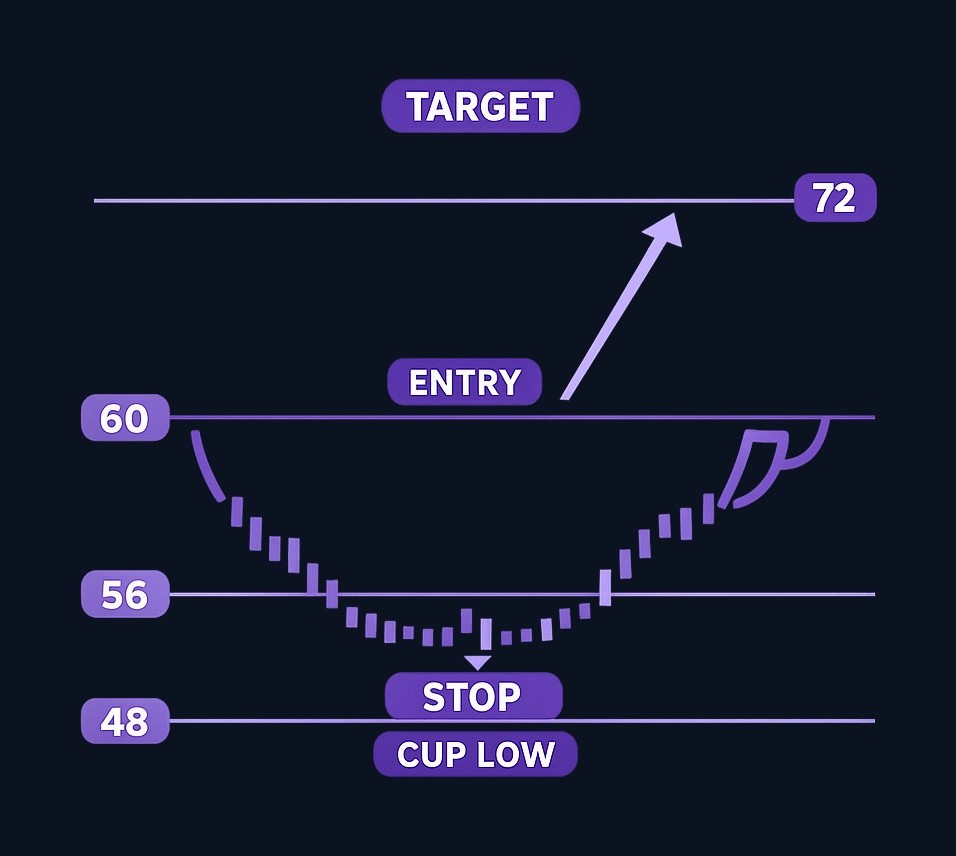
Decision quality comes from defining the exit before the entry, not from being right about the direction.
Practice trading with Finelo
Practice in a simulator, learn with bite-sized lessons, and build confidence before risking real money.
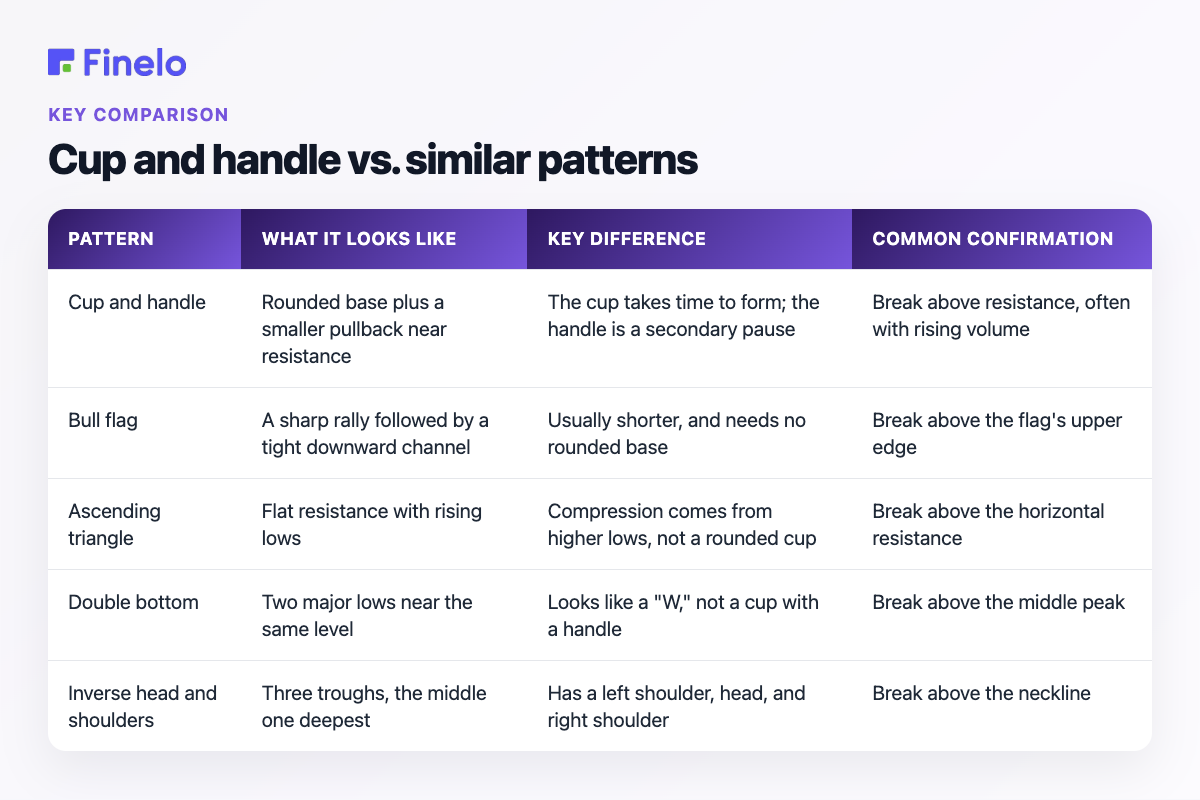
Cup and handle vs. similar patterns
Comparing the structure, rather than trusting the name, is what keeps you honest.
| Pattern | What it looks like | Key difference | Common confirmation |
|---|---|---|---|
| Cup and handle | Rounded base plus a smaller pullback near resistance | The cup takes time to form; the handle is a secondary pause | Break above resistance, often with rising volume |
| Bull flag | A sharp rally followed by a tight downward channel | Usually shorter, and needs no rounded base | Break above the flag's upper edge |
| Ascending triangle | Flat resistance with rising lows | Compression comes from higher lows, not a rounded cup | Break above the horizontal resistance |
| Double bottom | Two major lows near the same level | Looks like a "W," not a cup with a handle | Break above the middle peak |
| Inverse head and shoulders | Three troughs, the middle one deepest | Has a left shoulder, head, and right shoulder | Break above the neckline |
What happens after a cup and handle pattern
What happens after a cup and handle pattern depends on confirmation and context. If price breaks above resistance and holds, traders may look for continuation toward the measured target. If it breaks out but quickly falls back into the handle, the setup may be failing, and the early breakout can turn into a trap. If price drops below the handle low before any breakout, many traders treat the pattern as invalid.
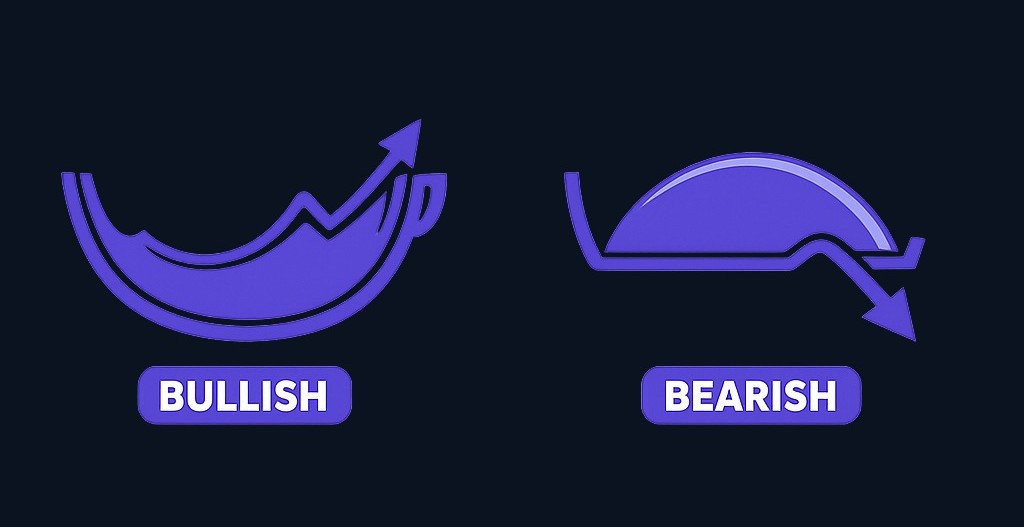
There is also a mirror version worth knowing. The inverted cup and handle is the bearish counterpart: a rounded top with a small upward handle that some traders read as a possible move lower. Beginners are usually better off learning the standard bullish version first.
Risk, common mistakes, and reliability
A pattern does not manage risk for you. Start with the invalidation point, not the target: if you cannot say what price would prove the idea wrong, you have a hope, not a plan. Size the position to the distance between entry and stop, and keep total risk within what you are willing to lose on a single idea.
Most common mistakes follow from skipping that discipline: calling every rounded pullback a cup and handle, entering before the handle completes, ignoring failure clues like a weak-volume breakout or a slip back below resistance, and obsessing over the target while underthinking the stop. Context matters too: bullish breakouts tend to be less reliable when the broader market is weak, and performance varies by market, timeframe, and the exact rules used. Treat any bare "success rate" with no methodology as marketing, not evidence. For a fuller routine on stops and sizing, see the guide to risk management in trading.
A quick evaluation checklist
- Trend context: Was there a meaningful prior uptrend, or is this a reversal guess?
- Cup shape: Is the cup rounded, or really a sharp V-bounce?
- Handle quality: Is the handle smaller than the cup and reasonably controlled?
- Volume behavior: Does volume contract in the handle and expand on the breakout?
- Entry rule: Are you waiting for the handle to finish and price to clear resistance?
- Stop plan: Is your invalidation level defined, such as below the handle low?
- Target method: Have you measured cup depth against nearby resistance?
- Risk-reward: Does the possible reward justify the planned risk?
- Failure signal: Do you know exactly what would prove the setup wrong?
Next steps
If you are still learning the cup and handle pattern, do not start with a live trade. Collect examples first, clean setups and failed breakouts alike, since the failed ones teach more. Then write your own rules for what counts as a valid cup, handle, breakout, stop, and target. The goal is a consistent decision process you can review, not a perfect pattern.
Inside the Finelo app, you can study chart structure and practice buy, sell, and hold decisions on real market data with virtual funds. In Demo mode, there are no deposits, no withdrawals, and no brokerage connection, it is a closed practice loop, so the only cost of a wrong call is the lesson. The guide to the trading simulator for beginners walks through practice mode, and Finelo reviews show how other learners describe the experience.
Final decisions are always yours. A pattern is a tool for making them more deliberate, not a substitute for judgment.
Practice chart patterns in the Finelo app →
Finelo is an educational product. The simulator uses virtual funds and real market data and is not a brokerage. Brokerage connection availability depends on your region. Final trading and investing decisions are yours and are made through your own brokerage account when you choose to act. Not financial advice.
Frequently asked questions
Is the cup and handle pattern bullish?
The standard cup and handle is generally treated as bullish. It most often appears as a continuation pattern within an uptrend, though it can sometimes show up near the bottom of a downtrend as a possible reversal. The inverted cup and handle is the bearish version.
How do I know if a cup and handle pattern is forming?
Look for a rounded cup, a return toward a resistance area, and a smaller handle near the right side of the cup. Most traders do not consider the setup confirmed until price breaks above resistance, and many also look for stronger volume on that breakout.
What happens after a cup and handle pattern?
After a confirmed breakout, price may continue toward a measured target based on the cup's depth. The pattern can also fail if price falls back below resistance, breaks the handle low, or loses momentum. The outcome depends on market conditions and how traders react, so it is never guaranteed.
Where do traders usually place a stop-loss?
A common educational approach places the stop below the handle low, since a break under that area can invalidate the setup. Some traders use wider or narrower stops depending on volatility, but the shared principle is to define risk before entering.
What indicators can I use alongside the cup and handle pattern?
Traders often pair it with volume, moving averages, trendlines, and relative strength, plus a look at the broader market or sector. These tools are there to confirm or challenge the setup, not to force a trade. No indicator turns a chart pattern into a sure thing.
cup and handlechart patternstechnical analysistrading education
Practice trading with Finelo
Practice in a simulator, learn with bite-sized lessons, and build confidence before risking real money.
About the author
Finelo Team
The Finelo Team creates practical investing and trading education designed to help beginners learn faster with structured challenges, simulator practice, and bite-sized lessons.
Keep reading — Related articles

Chart Analysis
Tick Charts: How They Work, Uses, and Limitations
A tick chart builds each bar (or candle) from a fixed count of market "ticks" — individual trades or quote changes — instead of fixed time intervals. Tick charts therefore compress activity when the market is busy and stretch it when activity is light, helping traders focus on…
Finelo Team
Chart Analysis
Renko Charts: How They Work, Uses, and Limitations
A Renko chart is a price-charting method that draws uniform "bricks" only when price moves by a predefined amount, filtering out small fluctuations to highlight trends and support/resistance zones; unlike time-based candlesticks, Renko bricks form from price movement rather than fixed time intervals TradingView renko description. This guide…
Finelo Team
Chart Analysis
A Complete Guide to Point and Figure Charts
Point and Figure (P&F) charts are a price‑only charting method that records meaningful price moves while ignoring linear time, helping traders spot clean trends, support/resistance, and breakouts. P&F is a price‑focused variant of technical analysis that emphasizes market supply-and-demand visible on a single price picture CME Group.
Finelo Team


