A descending triangle pattern is a technical analysis formation marked by a flat support line and a downward-sloping resistance line. In plain terms, buyers keep defending roughly the same price area, but sellers step in at lower and lower highs. Traders often read this as building downside pressure, and the pattern is commonly treated as bearish, especially when price breaks below support. The setup is not complete just because the triangle is visible; many chartists wait for a confirmed support break before treating it as actionable, because the pattern “isn’t complete until support is broken” according to StockCharts’ chart pattern guidance on descending triangles.
The Descending Triangle Pattern: Key Insights for Traders

A descending triangle pattern is a technical analysis formation marked by a flat support line and a downward-sloping resistance line.
15 min read
Practice trading with Finelo
Practice in a simulator, learn with bite-sized lessons, and build confidence before risking real money.
Want to learn more?
Practice in a simulator, learn with bite-sized lessons, and build confidence before risking real money.
Explore FineloExplore Finelo's 28-day challenges
Turn learning into a daily habit with guided challenge paths.
Introduction to the Descending Triangle Pattern
The descending triangle pattern belongs to the broader family of triangle chart patterns. It usually appears during a period of price compression: the market is still moving, but each rally loses strength before reaching the prior high. That repeated failure creates a descending resistance line, while repeated bounces near the same price level create horizontal support.
The basic market story is simple:
- Buyers are defending a support area.
- Sellers are becoming more aggressive on each bounce.
- Volatility contracts as price gets squeezed.
- A breakout or breakdown eventually resolves the pattern.
The most common interpretation is bearish. Dukascopy describes the descending triangle as a bearish chart pattern that forms when price makes lower highs while support remains flat, suggesting growing selling pressure; it also notes that a break below support often signals continuation of a downturn, while an upside break can happen less frequently under unusual circumstances (Dukascopy).
That said, no chart pattern guarantees an outcome. The value of the descending triangle is not that it predicts the future with certainty; it gives traders a structured way to define a possible setup, invalidation area, and risk plan.
Characteristics of the Descending Triangle Pattern
A valid descending triangle has two main visual features: lower highs and horizontal support.
The lower highs show that rallies are weakening. Each bounce attracts sellers sooner than the previous one. The horizontal support line shows that buyers are still active around a specific price zone. As these two lines converge, the market forms a triangle shape.
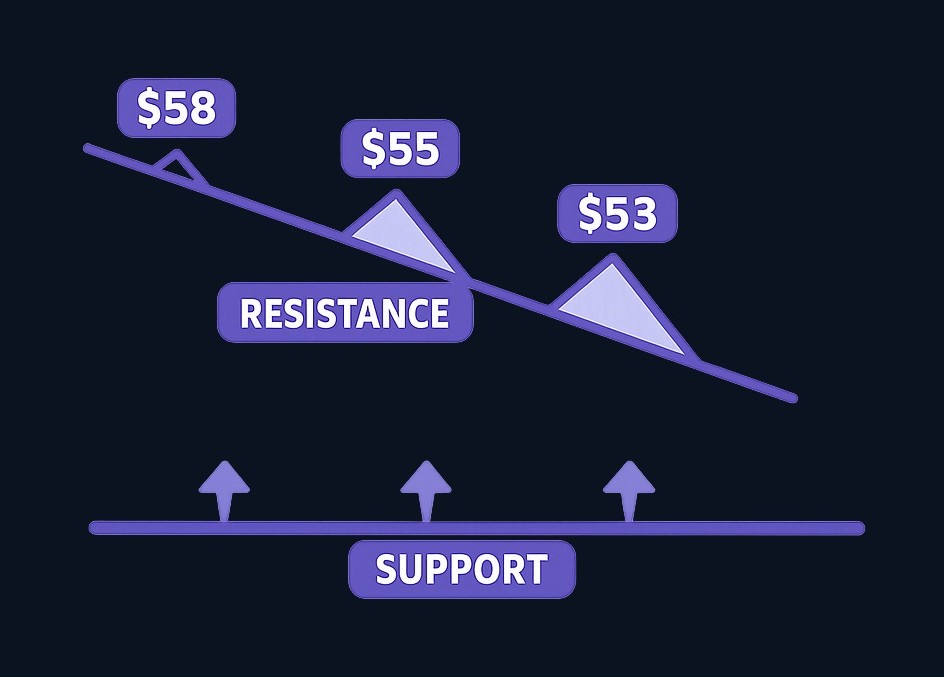
The most important characteristics are:
| Feature | What it means | Why it matters |
|---|---|---|
| Horizontal support | Price repeatedly bounces from a similar area | Defines the level many traders watch for a breakdown |
| Lower highs | Each rally fails below the prior rally | Suggests weakening demand or stronger selling pressure |
| Price compression | Range narrows over time | Signals that a larger move may follow, though direction is not guaranteed |
| Prior trend context | The pattern often works as a continuation setup | StockCharts notes that, to qualify as a continuation pattern, an existing trend should be present (StockCharts) |
| Breakout confirmation | Price moves beyond the pattern boundary | Helps distinguish a completed pattern from a developing one |
The “prior trend” point is important. A descending triangle is commonly discussed as a bearish continuation pattern, especially after a downtrend. Alchemy Markets describes it as a bearish continuation chart pattern that typically emerges after a previous downtrend and is identified by features that suggest the downtrend may continue (Alchemy Markets).
However, context matters. A descending triangle after a strong uptrend may behave differently from one forming in an established downtrend. In some cases, it may represent distribution before a bearish turn; in others, it may break upward if buyers regain control.
How to Identify the Descending Triangle Pattern
To identify a descending triangle, avoid forcing the shape onto every chart. Start with the structure, then check whether the price action supports the pattern.
A practical identification process:
- Find repeated support. Look for at least two clear reactions from a similar price area. The level does not need to be exact to the cent; markets often respect zones rather than perfect lines.
- Mark the lower highs. Draw a descending trendline across the reaction highs. StockCharts describes lower highs forming the descending trendline in a potential descending triangle, while emphasizing that the pattern remains potential until support breaks (StockCharts).
- Check for compression. The distance between the resistance line and support line should narrow over time.
- Look at the broader trend. If the market was already declining, the pattern may be interpreted as a bearish continuation setup.
- Wait for confirmation. A breakdown below support is often the key event traders watch before acting on the bearish interpretation.
Here is a simple checklist you can use before treating the pattern as tradable:
Descending Triangle Checklist
[ ] Is there a clear horizontal support area? [ ] Has price made lower highs into that support? [ ] Is the range tightening rather than expanding randomly? [ ] Is the broader trend or market context supportive of the setup? [ ] Has price actually broken support, or is the pattern still forming? [ ] Have I defined risk before considering an entry? [ ] Do I have a plan if the breakout fails?
One caveat: descending triangles are easier to see after they have formed. In live markets, the pattern may be messy. A price line may pierce support briefly, reclaim it, and trap early sellers. That is why many traders use confirmation rules rather than acting simply because the chart “looks like” a triangle.
Trading Strategies for the Descending Triangle Pattern
Trading a descending triangle effectively starts with risk definition. The pattern gives you visible levels, but it does not remove uncertainty. Dukascopy frames trading the pattern as a methodical process focused on managing risk and profit potential (Dukascopy).
The most common bearish approach is to wait for price to break below horizontal support. A trader may then consider a short setup or avoid long exposure, depending on their strategy, instrument, and risk tolerance. This article is educational, not personalized financial advice.
Common Entry Approaches
There are several ways traders may approach entries:
| Approach | How it works | Tradeoff |
|---|---|---|
| Breakout entry | Enter after price breaks below support | Faster entry, but higher risk of false breakdown |
| Retest entry | Wait for price to break support, then retest the old support as resistance | More confirmation, but the market may not retest |
| Conservative confirmation | Wait for a close below support or additional evidence from volume, trend, or momentum tools | Reduces impulsive entries, but may mean entering later |
A conservative trader might wait for price to close below support before acting. A more aggressive trader might enter as soon as support breaks. Neither approach is automatically better; the better choice depends on the trader’s rules, risk limit, and tolerance for missed trades.
Stop-Loss Planning
A stop-loss is usually placed where the trade idea would be invalidated. For a bearish descending triangle setup, that may be:
- Above the broken support after a failed breakdown.
- Above the most recent lower high.
- Above the descending trendline, if the structure is no longer bearish.
The wider the stop, the smaller the position size generally needs to be to keep risk controlled. The narrower the stop, the more likely normal price noise may trigger it. This is a decision point, not a fixed formula.
Risk Management Principles
Before entering any trade based on a descending triangle, answer these questions:
- What price proves my idea wrong?
- How much am I willing to lose if that happens?
- Where is my target, and is the potential reward reasonable compared with the risk?
- What will I do if price breaks down and immediately reverses?
- Am I acting on a plan or reacting emotionally to the chart?
For a structured learning path, readers building chart-reading foundations can explore the 28-Day AI Trader Challenge from Finelo.
Potential Outcomes and Price Targets
The classic bearish outcome is a breakdown below support followed by continued downside. But there are several possible outcomes:
- Bearish breakdown: Price breaks below support and continues lower.
- False breakdown: Price moves below support briefly, then recovers back into the triangle.
- Sideways failure: Price stops respecting the triangle structure and moves into a range.
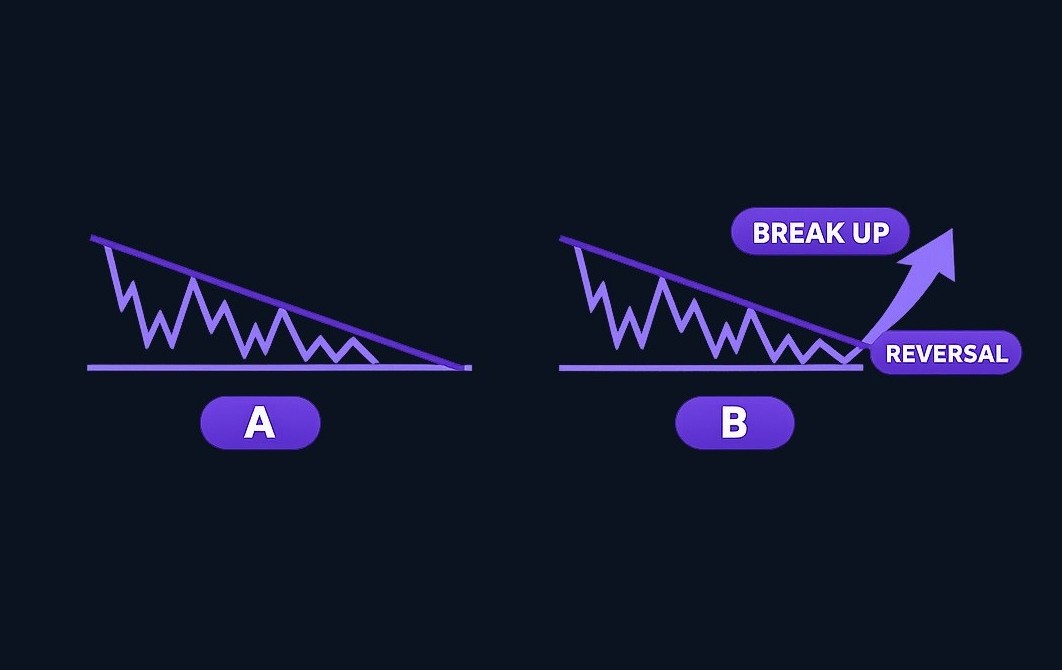
- Bullish reversal: Price breaks above the descending resistance line instead of below support.
The bullish reversal scenario is less common in the standard interpretation, but it is possible. Dukascopy notes that while the descending triangle is most commonly interpreted as a bearish continuation signal, price can break above resistance under unusual circumstances, resulting in a bullish reversal (Dukascopy).
Measuring a Target
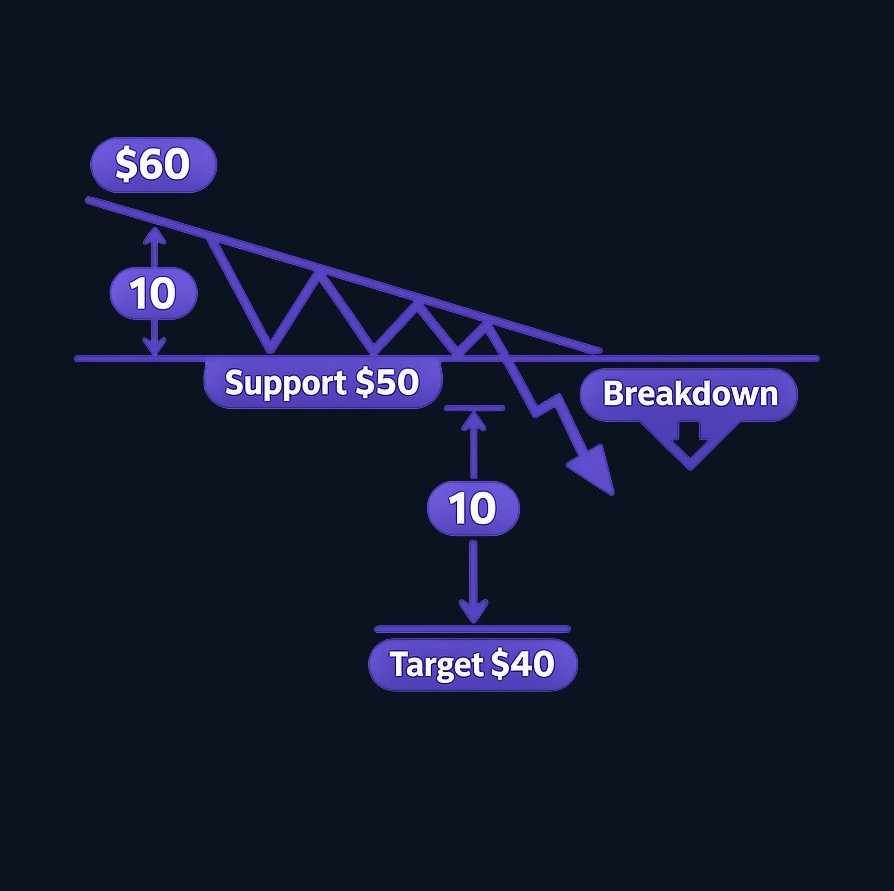
A common educational method for estimating a price target is to measure the height of the triangle at its widest point, then project that distance from the breakout level. For example:
Support level: 50
Highest early swing: 60
Triangle height: 10
If support breaks at 50, a projected bearish target might be: 50 - 10 = 40
This is not a forecast or guarantee. It is a planning tool. Traders may also use nearby support zones, prior swing lows, volatility, or broader market context to decide whether a target is realistic.
A useful habit is to compare the projected target with the stop-loss distance. If the target is too close and the invalidation point is far away, the setup may not offer an attractive risk/reward profile.
Practice trading with Finelo
Practice in a simulator, learn with bite-sized lessons, and build confidence before risking real money.
A Decision Framework for Trading Descending Triangles
The descending triangle becomes more useful when you treat it as a decision framework rather than a signal to trade automatically.
| If you see... | Consider... | Avoid... |
|---|---|---|
| Lower highs but no clear support | Waiting; the pattern may be incomplete | Drawing a triangle too early |
| Clear support but no breakdown | Monitoring for confirmation | Assuming the breakdown has already happened |
| Strong break below support | Reviewing entry, stop, and target rules | Entering without a risk plan |
| Break below support, then fast recovery | Treating it as a possible false breakdown | Ignoring invalidation |
| Break above descending resistance | Reassessing bearish bias | Staying attached to the original pattern |
| Pattern forms against major market context | Reducing confidence or waiting for more evidence | Treating all triangles the same |
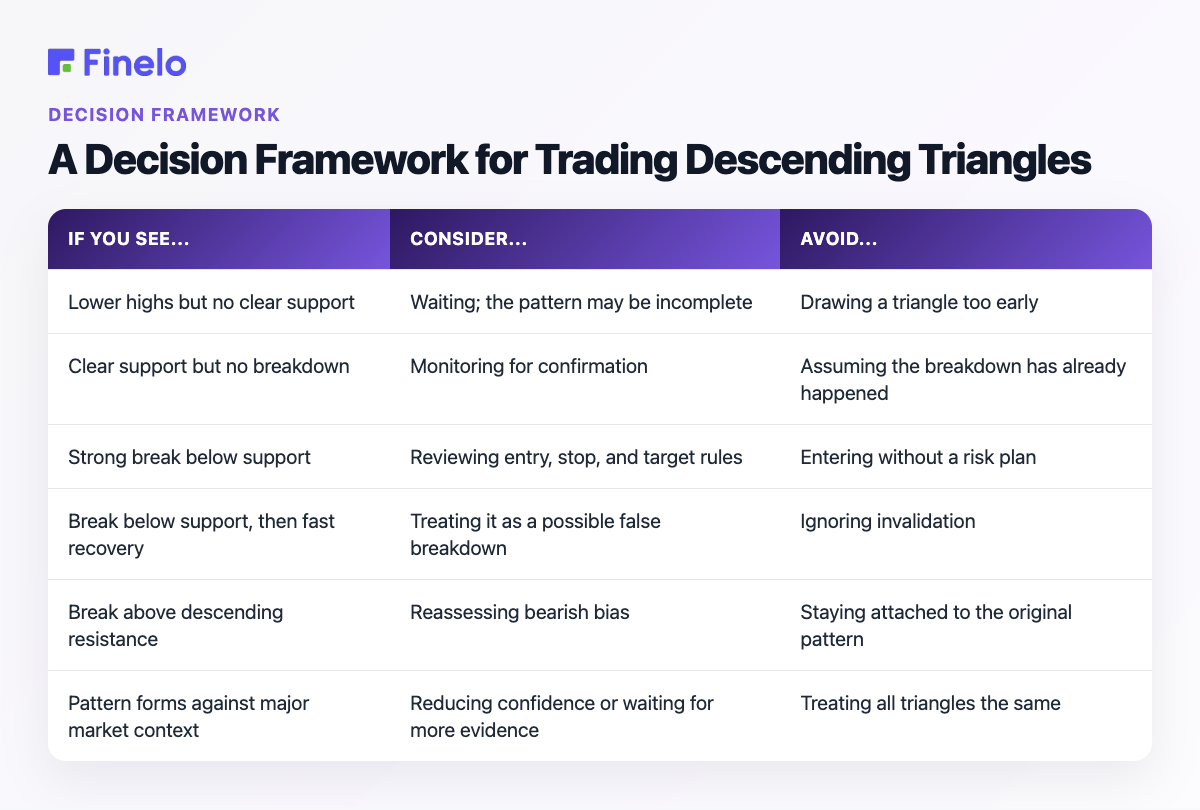
This framework also helps answer who this page is for: beginner and intermediate traders who want to understand how the pattern works, what it may indicate about market sentiment, and how to think through possible trades without relying on guesswork.
Psychological Factors Behind the Pattern
The descending triangle is partly a visual representation of trader psychology.
Support exists because buyers repeatedly step in near the same zone. At first, that can look encouraging. But the lower highs show that buyers are not pushing price back as far as before. Sellers become more willing to sell into smaller rallies, and buyers may become less confident each time the bounce weakens.
This creates emotional pressure:
- Early sellers may feel validated as rallies fade.
- Buyers at support may become nervous after repeated tests.
- Breakout traders may rush in once support breaks.
- Late traders may chase after the move has already extended.
- Trapped traders may exit quickly if a breakdown fails and price reverses.
The key psychological mistake is treating the pattern as certainty. A descending triangle can suggest pressure is building, but the market still has to confirm the move. Traders who need to be “right” may ignore failed breakdowns. Traders who fear missing out may enter too late. A written plan helps reduce both problems.
Practice Examples: How the Pattern Might Play Out
Because market examples require specific data and chart evidence, the examples below are simplified educational scenarios rather than claims about real trades.
Example 1: Bearish Continuation Setup
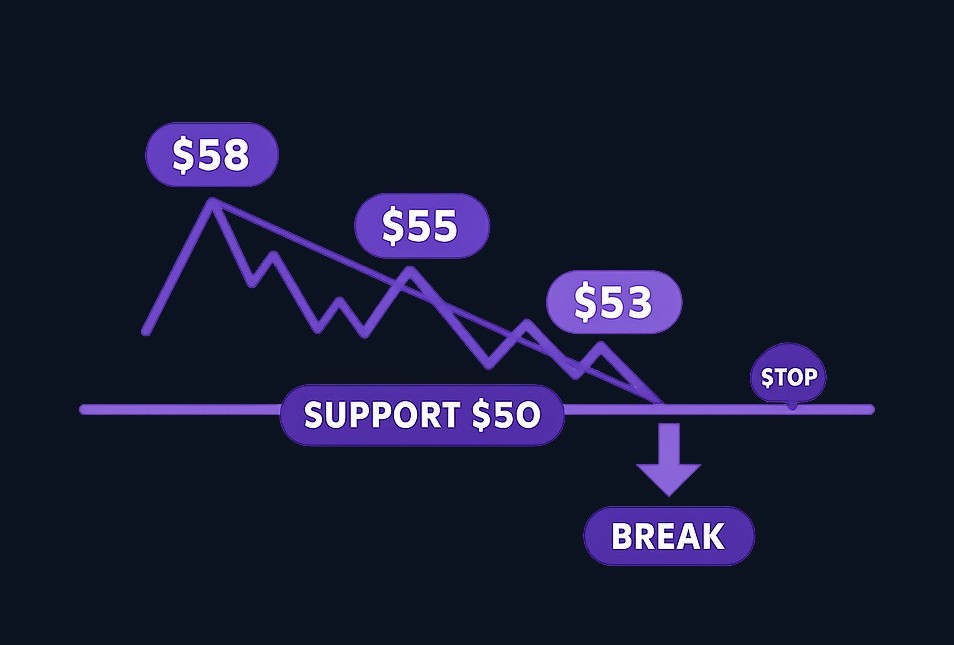
Imagine a stock has been trending downward. It drops to $50, bounces to $58, returns to $50, bounces only to $55, returns to $50 again, then bounces to $53. The support zone near $50 is holding, but each rally is weaker.
A trader watching this setup might draw:
- Horizontal support near $50.
- Descending resistance across $58, $55, and $53.
- A bearish trigger below $50.
If price breaks below $50 and closes below it, the trader may consider the pattern confirmed. A possible stop could be above the breakdown area or above the most recent lower high, depending on the trader’s rules. A measured move target could use the height of the triangle as a reference, but the trader would still need to account for risk and market conditions.
Example 2: False Breakdown
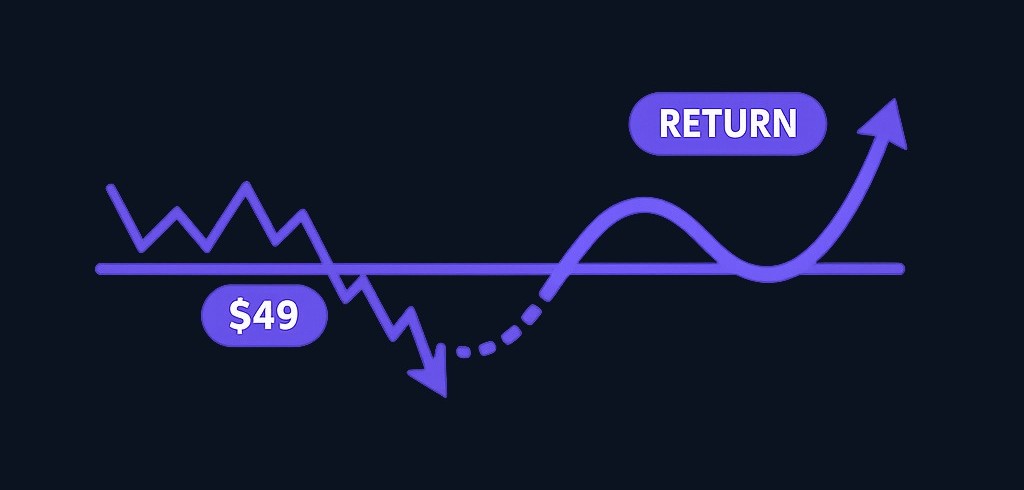
Now imagine price breaks below $50, trades at $49, then quickly returns above $50 and closes back inside the triangle. That can signal a failed breakdown. A trader who entered short without a stop may now face a difficult decision. A trader with a predefined invalidation rule can exit or reassess without improvising.
This is why confirmation and risk planning matter. The pattern may be bearish by interpretation, but false moves are part of trading.
Example 3: Bullish Reversal
Suppose price keeps holding support, then suddenly breaks above the descending resistance line. Traders who expected a breakdown may be forced to cover short positions, while new buyers may interpret the upside break as strength. In this case, the descending triangle did not resolve bearishly.
This does not mean the original pattern was useless. It means the market chose a different outcome, and the trader’s job is to respond to evidence rather than defend a bias.
Common Mistakes to Avoid When Trading Descending Triangles
The descending triangle is easy to recognize in hindsight but harder to trade in real time. These are the most common mistakes:
1. Entering Before the Pattern Is Complete
A descending triangle is only potential until the relevant boundary breaks. StockCharts specifically notes that the pattern is not complete until support is broken (StockCharts). Entering too early can expose traders to normal back-and-forth movement inside the triangle.
2. Ignoring the Broader Trend
The setup is commonly discussed as a continuation pattern, and an existing trend is part of the traditional continuation-pattern context (StockCharts). If a triangle forms in a choppy market with no clear directional pressure, confidence in the setup may be lower.
3. Treating Support as an Exact Line
Support is often a zone. A brief move below a drawn line does not always mean the market has meaningfully broken down. Waiting for a close, retest, or additional confirmation can help reduce impulsive decisions.
4. Chasing After a Large Move
If price has already fallen far below support, the risk/reward may be poor. A trader may be closer to a short-term bounce than a clean entry. The better question is not “Did the pattern work?” but “Is there still a planned trade with defined risk?”
5. Forgetting That Bullish Breaks Can Happen
The pattern is commonly bearish, but it can break upward. A trader who refuses to update their view may hold a losing position longer than planned.
Conclusion and Next Steps
The descending triangle pattern shows a market caught between repeated support and weakening rallies. Its classic interpretation is bearish, especially when price breaks below the horizontal support line, but the pattern should be treated as a structured setup rather than a prediction.
Before trading it, confirm the structure, check the broader trend, define your entry trigger, place your invalidation level, and decide whether the potential reward justifies the risk. Most importantly, be prepared for false breakdowns and less common bullish reversals.
A simple next-step routine:
- Review historical charts and mark only the clearest descending triangles.
- Separate “forming” patterns from confirmed breakdowns.
- Write down where the trade idea would be invalidated.
- Practice measuring targets, but do not treat them as guaranteed.
- Track outcomes so your decisions are based on process, not memory.
FAQs About the Descending Triangle Pattern
What does a descending triangle pattern indicate about market sentiment?
It often suggests that sellers are becoming more aggressive while buyers continue defending a support area. Lower highs show weakening rallies, while flat support shows an area where buyers have repeatedly stepped in. If support breaks, many traders interpret that as a bearish signal.
How can I effectively trade a descending triangle pattern?
A common approach is to wait for confirmation, such as a break below support, then define an entry, stop-loss, and target before placing any trade. Some traders enter on the break, while others wait for a retest of the broken support area. The key is to avoid acting without a risk plan.
What are the main risks of trading descending triangles?
The main risks include false breakdowns, entering before confirmation, placing stops too tightly or too loosely, ignoring broader market context, and assuming the pattern guarantees a bearish move. A descending triangle can also break upward, which can invalidate a bearish trade idea.
Can a descending triangle pattern lead to a bullish reversal?
Yes. Although the descending triangle is most commonly interpreted as bearish, an upside break through the descending resistance line can happen. Dukascopy notes that a bullish reversal is possible under unusual circumstances, even though the bearish breakout is the more common interpretation (Dukascopy).
descending triangle patternchart analysistrading education
Practice trading with Finelo
Practice in a simulator, learn with bite-sized lessons, and build confidence before risking real money.
About the author
Finelo Team
The Finelo Team creates practical investing and trading education designed to help beginners learn faster with structured challenges, simulator practice, and bite-sized lessons.
Keep reading — Related articles

Chart Analysis
Tick Charts: How They Work, Uses, and Limitations
A tick chart builds each bar (or candle) from a fixed count of market "ticks" — individual trades or quote changes — instead of fixed time intervals. Tick charts therefore compress activity when the market is busy and stretch it when activity is light, helping traders focus on…
Finelo Team
Chart Analysis
Renko Charts: How They Work, Uses, and Limitations
A Renko chart is a price-charting method that draws uniform "bricks" only when price moves by a predefined amount, filtering out small fluctuations to highlight trends and support/resistance zones; unlike time-based candlesticks, Renko bricks form from price movement rather than fixed time intervals TradingView renko description. This guide…
Finelo Team
Chart Analysis
A Complete Guide to Point and Figure Charts
Point and Figure (P&F) charts are a price‑only charting method that records meaningful price moves while ignoring linear time, helping traders spot clean trends, support/resistance, and breakouts. P&F is a price‑focused variant of technical analysis that emphasizes market supply-and-demand visible on a single price picture CME Group.
Finelo Team


