Bullish and bearish trading patterns are chart formations traders use to judge whether price may continue or reverse direction. A bullish pattern points to potential upward movement, while a bearish pattern points to potential downward movement; the key difference is the structure of the setup and the direction of the breakout, not the label alone bullish vs. bearish continuation patterns. The best way to use these patterns is not to “predict” the market from one shape, but to combine the pattern with confirmation, volume behavior, market context, and a predefined risk plan.
Bullish and Bearish Trading Patterns Explained

Bullish and bearish trading patterns are chart formations traders use to judge whether price may continue or reverse direction.
12 min read
Practice trading with Finelo
Practice in a simulator, learn with bite-sized lessons, and build confidence before risking real money.
Want to learn more?
Practice in a simulator, learn with bite-sized lessons, and build confidence before risking real money.
Explore FineloExplore Finelo's 28-day challenges
Turn learning into a daily habit with guided challenge paths.
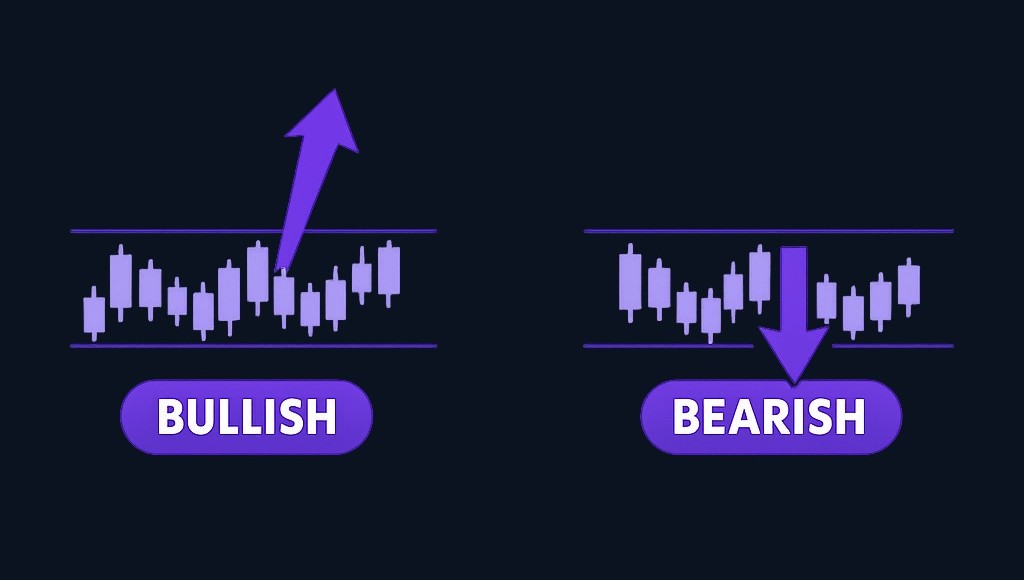
This guide explains the main pattern types, how to confirm them, and the common mistakes to avoid.
Introduction to Trading Patterns
A trading pattern is a recognizable shape on a price chart. Traders study these shapes because price often moves in waves: a strong move, a pause, a test of support or resistance, and then either continuation or reversal. Patterns help traders organize that price action into a decision framework.
Patterns are usually grouped into two broad categories:
- Continuation patterns: The market pauses, then may resume the prior trend.
- Reversal patterns: The market tests a high or low area and may change direction.
Bullish and bearish versions can exist in both groups. For example, a bullish continuation pattern may appear during an uptrend, while a bearish continuation pattern may appear during a downtrend. Continuation patterns are commonly treated as a way to identify potential trend resumption while still requiring risk management continuation pattern risk management.
The important point: a pattern is a setup, not a guarantee. The pattern gives you a possible scenario; confirmation and risk controls determine whether it is tradable.
What Are Bullish Patterns?
Bullish patterns suggest that buyers may be gaining control or that an existing uptrend may continue. They often form near support, after a pullback, or during a pause in an upward move.
Common bullish patterns include:
| Bullish pattern | What it suggests | Typical decision point |
|---|---|---|
| Bull flag | Price rises strongly, pauses in a smaller downward or sideways channel, then may continue higher | Breakout above the flag area |
| Ascending triangle | Buyers keep pressing into a resistance area while pullbacks become shallower | Breakout above resistance |
| Double bottom | Price tests a low area twice and fails to break lower | Move above the middle resistance between the two lows |
| Inverse head and shoulders | Sellers push price lower, but the final low is weaker than the prior one | Break above the neckline |
| Cup and handle | Price recovers in a rounded base, then pauses before attempting another move higher | Breakout above the handle or rim area |
A simple example: imagine a stock is already trending upward. It rises from one price area to a higher one, then spends several sessions moving slightly lower in a narrow channel. If price later breaks above that channel, traders may interpret the setup as a bull flag. The bullish idea is that the pause allowed the market to absorb selling pressure before buyers attempted to continue the prior move.
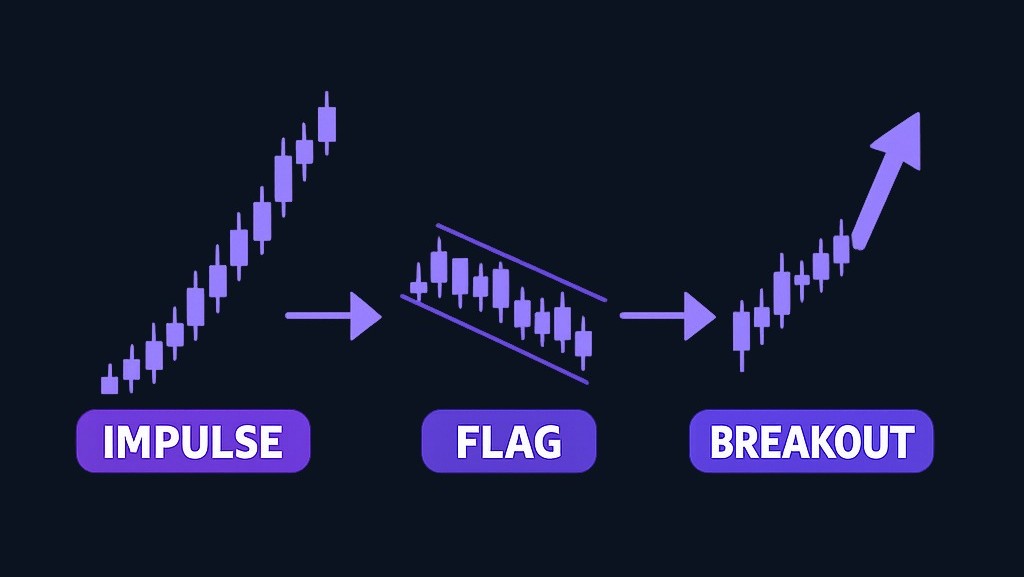
The caveat is that a bullish-looking shape can fail. A breakout that immediately reverses back into the pattern may show that buyers were not strong enough. That is why confirmation and risk management matter more than simply naming the pattern.
What Are Bearish Patterns?
Bearish patterns suggest that sellers may be gaining control or that an existing downtrend may continue. They often form near resistance, after a relief rally, or during a pause in a downward move.
Common bearish patterns include:
| Bearish pattern | What it suggests | Typical decision point |
|---|---|---|
| Bear flag | Price falls sharply, pauses in a smaller upward or sideways channel, then may continue lower | Breakdown below the flag area |
| Descending triangle | Sellers keep pressing into a support area while rallies become weaker | Breakdown below support |
| Double top | Price tests a high area twice and fails to break higher | Move below the middle support between the two highs |
| Head and shoulders | Buyers push to a peak, make a higher peak, then fail to maintain momentum | Break below the neckline |
| Rising wedge | Price rises in a narrowing structure, but momentum may be weakening | Breakdown below wedge support |
Bearish setups use the same logic as bullish setups, but in the opposite direction. The comparison is useful because bullish and bearish continuation patterns can share similar “pause-and-breakout” behavior while differing in structure and breakout direction bullish and bearish structure.
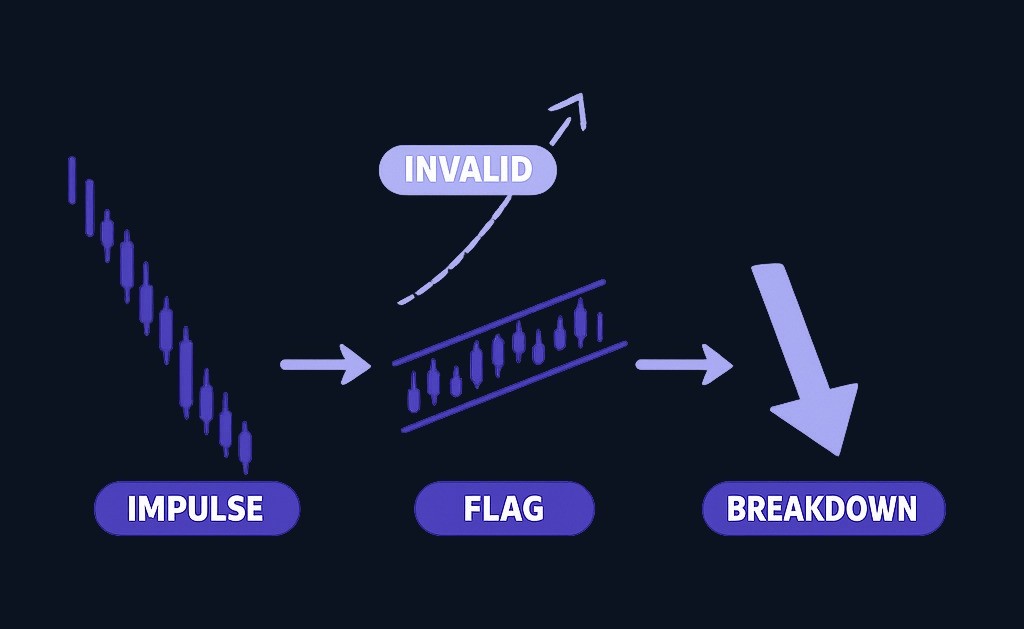
For example, a bear flag may form after a sharp drop. Price then drifts upward in a small channel, but the recovery is weak compared with the prior selloff. If price breaks below the flag, bearish traders may interpret that as a continuation signal. The setup becomes less convincing if price instead breaks upward with strength, because that would challenge the bearish thesis.
Volume Behavior and Its Importance
Volume helps traders think about participation. A price move with stronger participation may be treated differently from a move that happens with little interest. While volume does not make a pattern certain, it can help you ask better questions:
- Is the breakout supported by meaningful participation?
- Is volume drying up during the pause, suggesting indecision?
- Is the failure move stronger than the original breakout?
- Is the pattern forming during a liquid trading period, or in thin conditions?
A practical way to use volume is to compare three phases:
-
Impulse phase: The move before the pattern forms.
- In a bull flag, this is the sharp move upward.
- In a bear flag, this is the sharp move downward.
-
Pause phase: The pattern itself.
- Ideally, the pause should look controlled rather than chaotic.
- If price swings are wide and erratic, the pattern may be less useful.
-
Breakout or breakdown phase: The move out of the pattern.
- A stronger move out of the range can provide better confirmation than a weak, hesitant break.
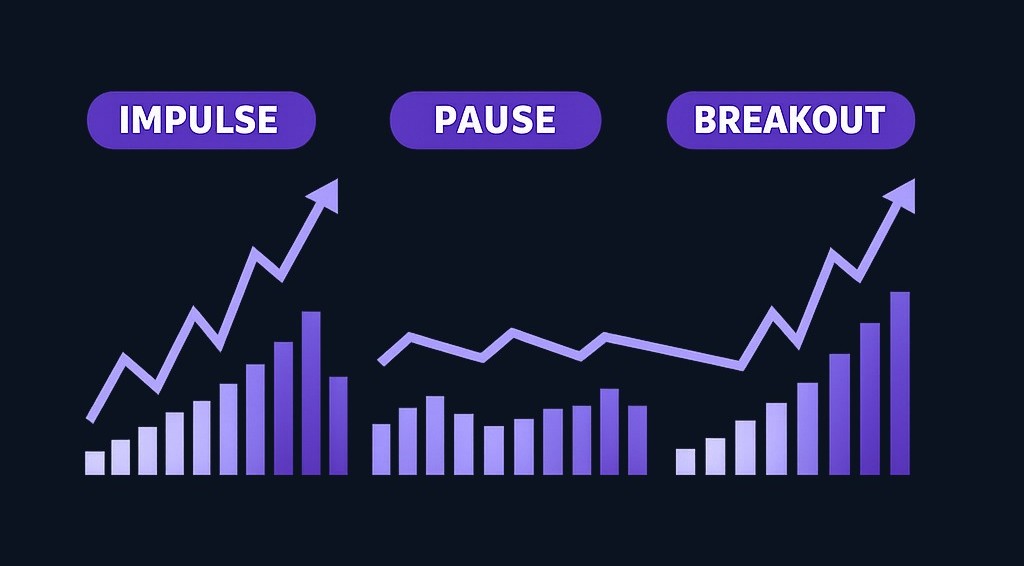
Volume should not be used in isolation. A breakout can occur on high volume and still fail. Similarly, some markets and instruments have different volume characteristics. Treat volume as one part of the evidence, not the entire trading decision.
Practice trading with Finelo
Practice in a simulator, learn with bite-sized lessons, and build confidence before risking real money.
Trading Strategies for Bullish and Bearish Patterns
A good pattern strategy starts before the entry. You need to define the trend, the setup, the confirmation trigger, the invalidation point, and the risk limit. Technical analysis and disciplined risk management should work together when trading continuation patterns trading continuation patterns.
Here is a simple framework you can use for both bullish and bearish patterns.
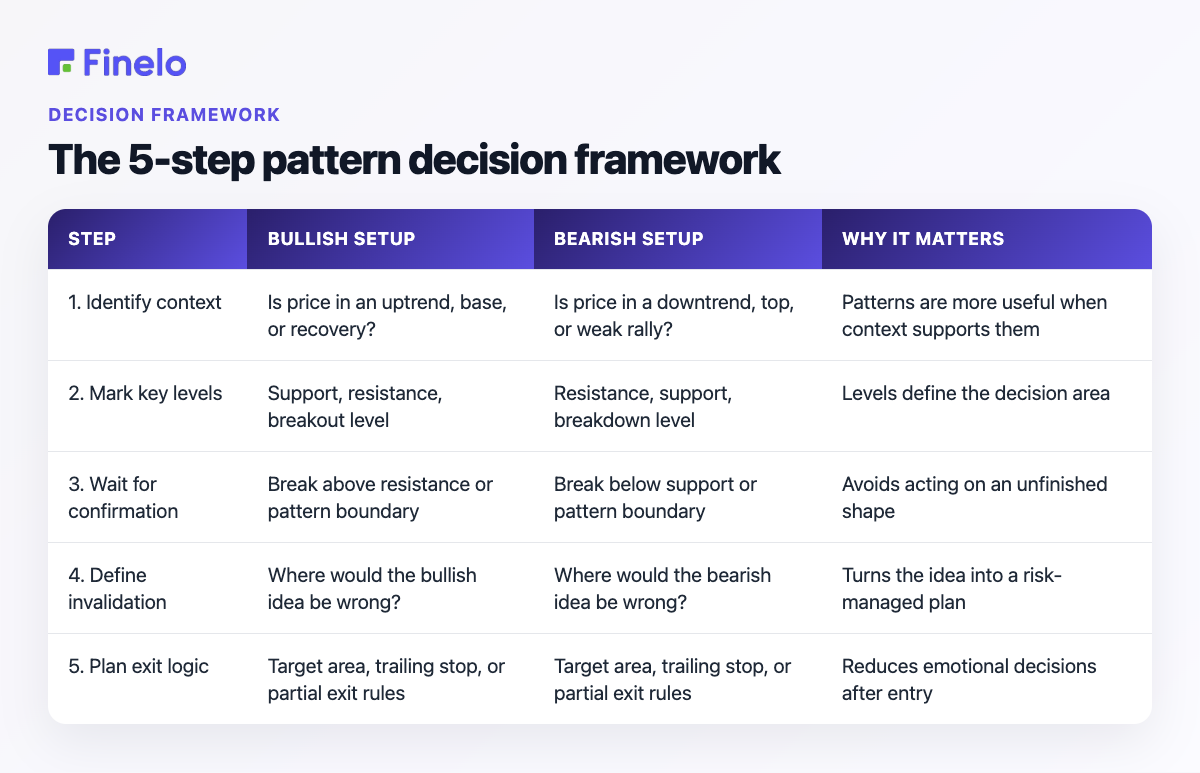
The 5-step pattern decision framework
| Step | Bullish setup | Bearish setup | Why it matters |
|---|---|---|---|
| 1. Identify context | Is price in an uptrend, base, or recovery? | Is price in a downtrend, top, or weak rally? | Patterns are more useful when context supports them |
| 2. Mark key levels | Support, resistance, breakout level | Resistance, support, breakdown level | Levels define the decision area |
| 3. Wait for confirmation | Break above resistance or pattern boundary | Break below support or pattern boundary | Avoids acting on an unfinished shape |
| 4. Define invalidation | Where would the bullish idea be wrong? | Where would the bearish idea be wrong? | Turns the idea into a risk-managed plan |
| 5. Plan exit logic | Target area, trailing stop, or partial exit rules | Target area, trailing stop, or partial exit rules | Reduces emotional decisions after entry |
Example: applying the framework
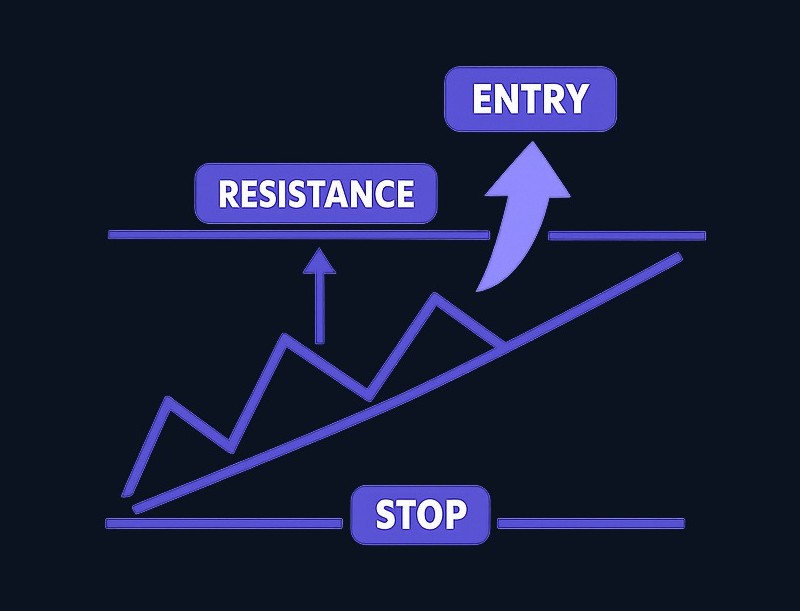
Suppose price is in an uptrend and forms an ascending triangle. The highs keep reaching the same resistance area, while the lows gradually rise. A trader might:
- Mark the resistance level.
- Wait for price to break above that level.
- Check whether the breakout holds rather than immediately falling back into the range.
- Place an invalidation point below a recent higher low or another predefined level.
- Decide in advance how much capital is at risk if the trade fails.
The same logic can be reversed for a descending triangle in a downtrend. A trader might wait for a breakdown below support, define the point where the bearish idea is invalid, and avoid entering if the risk is too large relative to the potential trade plan.
The main principle is symmetry: bullish and bearish strategies differ in direction, but the risk-management process should remain consistent. Risk controls are still needed regardless of whether the setup is bullish or bearish risk management principles.
How Market Conditions Affect Pattern Reliability
Patterns do not form in a vacuum. The same chart formation can behave differently depending on the broader market environment.
Consider these context filters before acting:
- Trend strength: Continuation patterns generally make more sense when there is a clear trend before the pattern forms.
- Volatility: In highly volatile conditions, breakouts and breakdowns may fail more often because price can swing beyond levels and reverse quickly.
- Liquidity: Thinly traded instruments may produce noisy patterns that are harder to interpret.
- Major news or events: A clean technical setup can become less reliable when a major announcement changes market expectations.
- Timeframe alignment: A bullish pattern on a short-term chart may be less convincing if the longer-term chart is bearish.
A useful decision point is to ask: Is this pattern aligned with the larger market story, or is it fighting it? A bullish breakout during a broad risk-off move may deserve more caution. A bearish breakdown during a strong market-wide rally may also require extra confirmation.
Common Mistakes to Avoid
Pattern trading often goes wrong not because the trader cannot recognize shapes, but because the trade plan is incomplete. Here are the most common mistakes.
1. Entering before the pattern is complete
Many patterns look obvious only after they finish. Entering too early can mean buying or selling inside a range before the market has made a decision. Waiting for confirmation may reduce the number of trades, but it can also help avoid weak setups.
2. Ignoring the prior trend
A continuation pattern needs a trend to continue. A flag-like shape in a sideways market may not have the same meaning as a flag after a strong directional move. Before naming the pattern, identify what came before it.
3. Treating all breakouts as equal
A breakout that barely moves beyond a level and immediately stalls is different from a clean move that holds outside the pattern. Traders often get trapped when they focus only on the first break and ignore how price behaves afterward.
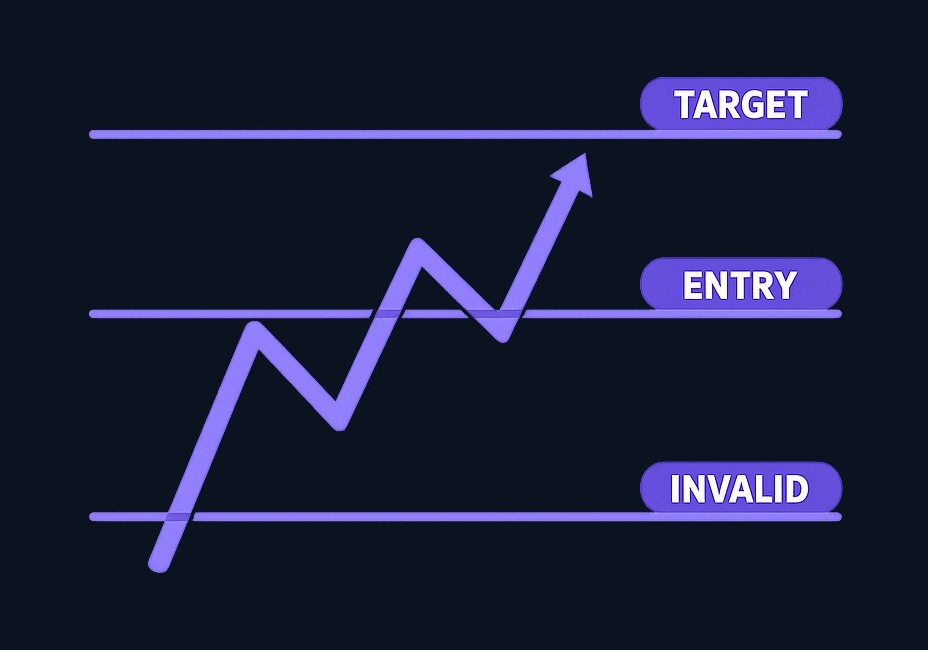
4. Skipping the invalidation point
Every trade idea needs a point where it is considered wrong. Without one, a small failed pattern can turn into a much larger loss. The invalidation point should be defined before the trade, not after emotions take over.
5. Using patterns without position sizing
Even a well-formed pattern can fail. Position sizing helps limit the damage when that happens. A common beginner mistake is risking too much because a setup “looks obvious.”
6. Forcing a pattern onto every chart
Not every market move is a pattern. If the structure is unclear, it is acceptable to wait. A clean no-trade decision can be better than trading a chart that does not offer a clear setup.
Practical Next Steps
Bullish and bearish trading patterns can help you read market structure, but they work best as part of a complete process. Start by learning the difference between continuation and reversal setups. Then practice marking support, resistance, breakout levels, and invalidation points on historical charts before risking real capital.
A simple routine:
- Pick one bullish pattern and one bearish pattern to study first.
- Review past charts and mark where the setup began, confirmed, and failed.
- Note the market context: trend, volatility, volume behavior, and major levels.
- Write down the entry trigger and invalidation point before judging the outcome.
- Keep a trade journal focused on process, not just wins and losses.
If you want a structured way to keep building investing and trading knowledge, you can explore Finelo’s educational resources at Finelo. This article is educational only and is not personalized financial advice.
Frequently Asked Questions
What are the most reliable bullish and bearish trading patterns?
No pattern is reliable in every market. Many traders start with widely recognized structures such as bull flags, bear flags, ascending triangles, descending triangles, double bottoms, double tops, and head-and-shoulders variations. The more important question is whether the pattern appears in the right context, confirms properly, and offers a manageable risk point.
How can I confirm a pattern before making a trade?
Confirmation usually means waiting for price to break above a key level in a bullish setup or below a key level in a bearish setup. Traders may also look at whether the move holds beyond the pattern boundary, whether volume supports the move, and whether the broader trend agrees with the setup.
What is the best way to manage risk when trading these patterns?
Define the invalidation point before entering. That is the level where your trade idea no longer makes sense. Then size the position so that a failed pattern does not create an outsized loss. Risk management principles apply to both bullish and bearish patterns, even when the trade direction differs risk management with continuation patterns.
How can I improve my ability to identify patterns in real time?
Practice on historical charts first, then replay charts bar by bar if your charting tools allow it. Focus on one or two patterns at a time. For each setup, write down the prior trend, the pattern boundary, the confirmation trigger, the invalidation level, and what would make you skip the trade. Over time, this builds a more disciplined pattern-recognition process.
bullish and bearish trading patternstradingtrading education
Practice trading with Finelo
Practice in a simulator, learn with bite-sized lessons, and build confidence before risking real money.
About the author
Finelo Team
The Finelo Team creates practical investing and trading education designed to help beginners learn faster with structured challenges, simulator practice, and bite-sized lessons.
Keep reading — Related articles

Trading
Options Wheel Strategy: How It Works and Its Risks
The phrase "wheel strategy options" describes a repeatable income approach: sell cash‑secured puts until assigned, buy the stock when assigned, then sell covered calls on the shares to collect more premium and define exit points. This cycle — sell puts → buy stock on assignment → sell covered…
Finelo Team
Trading
Volume Profile Trading: How It Works and Its Limitations
Volume profile trading maps how much volume traded at each price level during a chosen period, revealing levels where the market accepted or rejected price. Traders use the Point of Control (the single price with the highest traded volume), value areas, and volume nodes to identify likely support/resistance…
Finelo Team
Trading
What is Unusual Options Activity and Why Does It Matter?
Unusual options activity (UOA) is a sudden, outsized spike in options trades — volume or open interest — relative to a contract’s recent norms. Traders watch UOA because large, concentrated options orders can signal informed or institutional positioning that sometimes precedes significant stock moves. Example: a single large…
Finelo Team


