There are usually about 252 trading days in a year for U.S. stock markets. The exact number changes because markets close on weekends, exchange holidays, and occasional special closures; some years may have around 250, 251, 253, or 254 trading days depending on how the calendar falls and whether it is a leap year trading day range. For most planning, “252” is the standard annual assumption. For actual scheduling, traders should always check the official calendar for the market or exchange they trade.
How Many Trading Days Are There in a Year?

There are usually about 252 trading days in a year for U.S. stock markets. The exact number changes because markets close on weekends, exchange holidays, and occasional special closures; some years may have around 250, 2...
11 min read
Practice trading with Finelo
Practice in a simulator, learn with bite-sized lessons, and build confidence before risking real money.
Want to learn more?
Practice in a simulator, learn with bite-sized lessons, and build confidence before risking real money.
Explore FineloExplore Finelo's 28-day challenges
Turn learning into a daily habit with guided challenge paths.
What Are Trading Days?
A trading day is a day when a financial market is open for normal trading. For stocks, that usually means a weekday when the relevant exchange is open and not closed for a market holiday. If the market is closed for a holiday, that weekday does not count as a trading day.
Trading days matter because many trading and investing calculations are based on active market sessions, not calendar days. For example, a trader reviewing a “20-day” moving average is looking at roughly 20 market sessions, not 20 calendar days. A risk manager estimating daily volatility is usually working with trading days. A beginner building a study routine may also want to know how many live market sessions they can observe in a month or year.
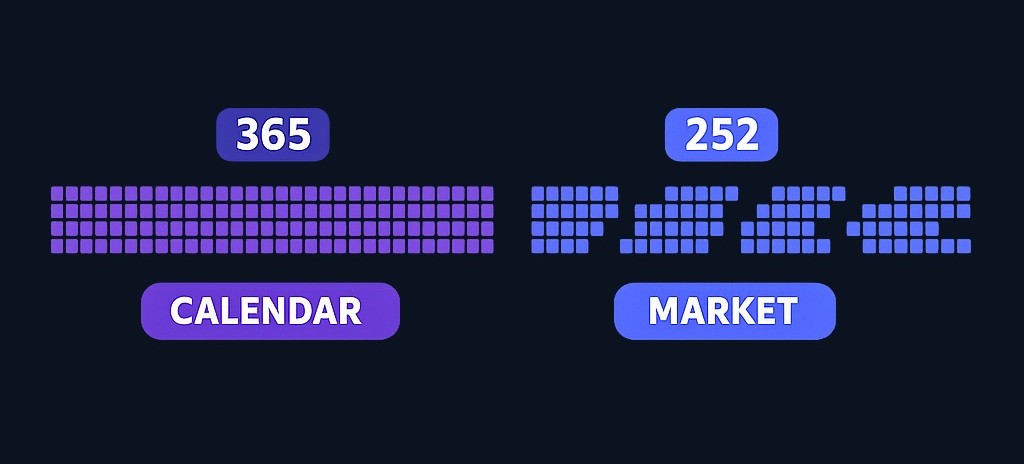
The key idea is simple: calendar days measure time; trading days measure market opportunity. A year always has 365 calendar days, or 366 in a leap year, but only a portion of those are days when a specific market is open.
Typical Number of Trading Days in a Year
For U.S. stock markets, the most common planning number is 252 trading days per year average U.S. trading days. That figure comes from a rough calendar calculation:
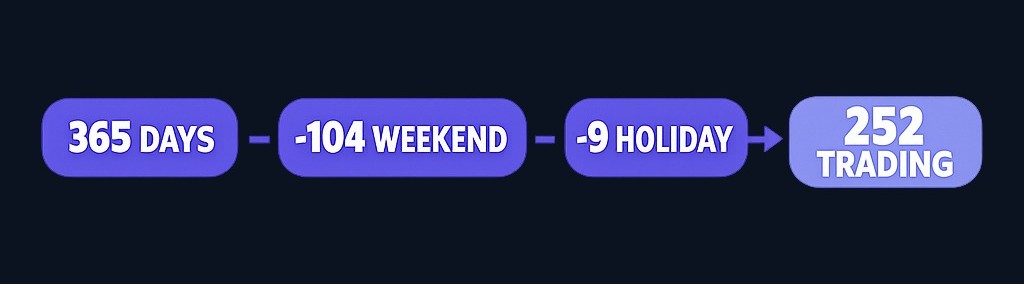
| Calendar component | Approximate effect |
|---|---|
| Days in a standard year | 365 |
| Weekend days | -104 |
| Weekdays before holidays | 261 |
| Market holidays and special closures | Usually reduce the total |
| Typical planning estimate | About 252 |
This is not a fixed rule. The number can change slightly each year because holidays may fall on weekdays or weekends, and rare extra closures can occur calendar variation. That is why one year may have fewer usable sessions than another, even if both feel like “normal” years.
For practical purposes, use this framework:
- For quick annual estimates: use 252 trading days.
- For backtesting or performance reviews: use the actual trading calendar for the exchange and year.
- For live trading plans: check the upcoming holiday calendar before setting trade frequency or review dates.
Why the Number Changes: Weekends, Holidays, Leap Years, and Special Closures
The number of trading days changes because markets do not simply open every weekday of the year.
Weekends remove the largest block of days
Most stock exchanges are closed on weekends. In a standard 52-week year, that removes about 104 days from the calendar before holidays are even considered. This is why the number starts near 260 weekdays, then falls toward the common 252-day estimate after holidays.
Holidays reduce weekday sessions
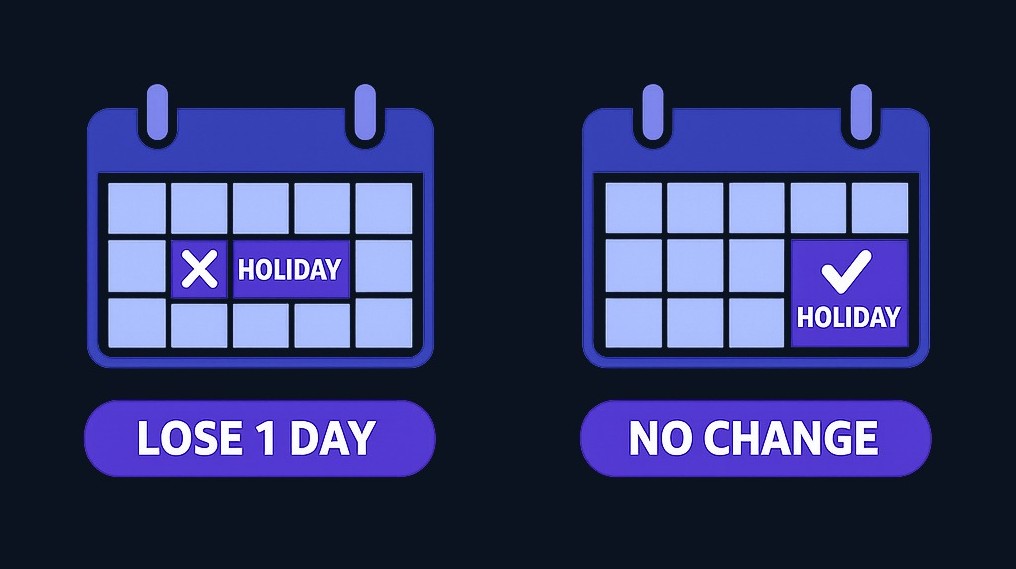
Market holidays are the main reason the count changes from year to year. If a holiday falls on a weekday, it usually removes a trading session. If it falls on a weekend and is not observed on a trading day, the effect may be different. The supplied market overview notes that the annual count changes depending on whether holidays fall on weekdays or weekends holiday timing.
A simple way to visualize the impact:
| Holiday situation | Effect on annual trading days |
|---|---|
| Holiday falls on a weekday and market closes | Trading days decrease by 1 |
| Holiday falls on a weekend with no weekday closure | Little or no direct reduction |
| Exchange announces a half-day session | May count differently depending on your analysis method |
| Rare special closure occurs | Trading days decrease unexpectedly |
Half-days deserve special attention. Some traders count them as trading days because the market is open, while others treat them differently in volume or volatility analysis. If your strategy depends on liquidity, volume, or intraday movement, a shortened session may not behave like a full session.
Leap years can add a day, but not always a trading day
A leap year has 366 calendar days, but the extra day does not automatically become an extra trading day. If the added calendar day falls on a weekend or market holiday, it may not increase the trading-day count. This is why leap years can affect the total, but the effect depends on the calendar structure leap year variation.
Special closures can create exceptions
Markets may occasionally close for reasons outside the standard holiday calendar. The annual number can change because of rare additional closures, including events such as national mourning special closures. These are uncommon, but they are one reason exact trading-day counts should come from official exchange calendars rather than estimates.
Trading Days Across Different Markets
Trading days are not the same across all markets. A U.S. stock trader, an international stock investor, a Forex trader, and a crypto trader may all be using different definitions of “available trading day.”
For stocks, the relevant exchange calendar matters. U.S. stock markets commonly use the 252-day planning assumption, but global exchanges can differ. Investors with international exposure should track the calendars of the exchanges they use, such as the LSE, NSE, and HKEX global exchange calendars.
India is a useful example of why local calendars matter. A supplied overview estimates roughly 250 annual sessions for Indian equities and separately cites an NSE circular listing 246 trading days for 2026 India trading days. That difference shows why traders should avoid assuming that every market follows the U.S. average.
| Market type | What to check | Practical implication |
|---|---|---|
| U.S. stocks | U.S. exchange holiday calendar | 252 is a common estimate, but exact years vary |
| International stocks | Local exchange calendar | Holidays and closures differ by country |
| Forex | Broker or market schedule | “Trading day” may depend on how your provider defines sessions |
| Crypto | Platform availability and liquidity conditions | Calendar availability may differ from exchange-traded stocks |
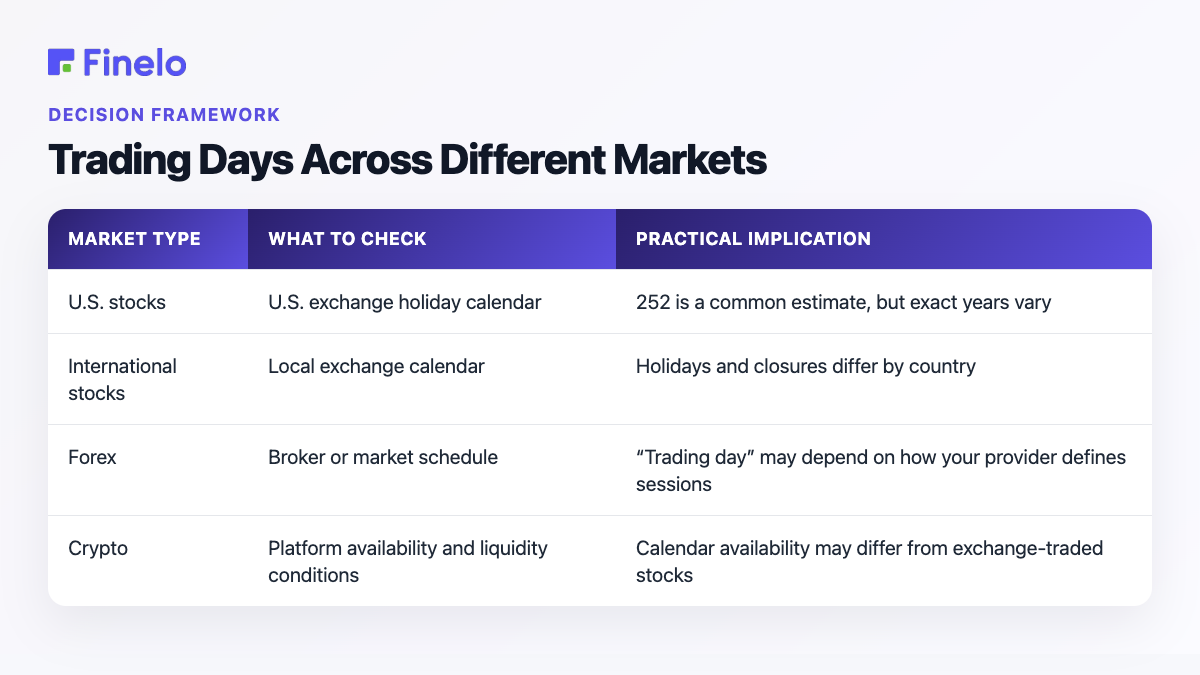
The main takeaway: do not use one market’s calendar for another market’s plan. If your portfolio, watchlist, or education routine spans multiple markets, create separate calendars for each.
Practice trading with Finelo
Practice in a simulator, learn with bite-sized lessons, and build confidence before risking real money.
Yearly Variations in Trading Days
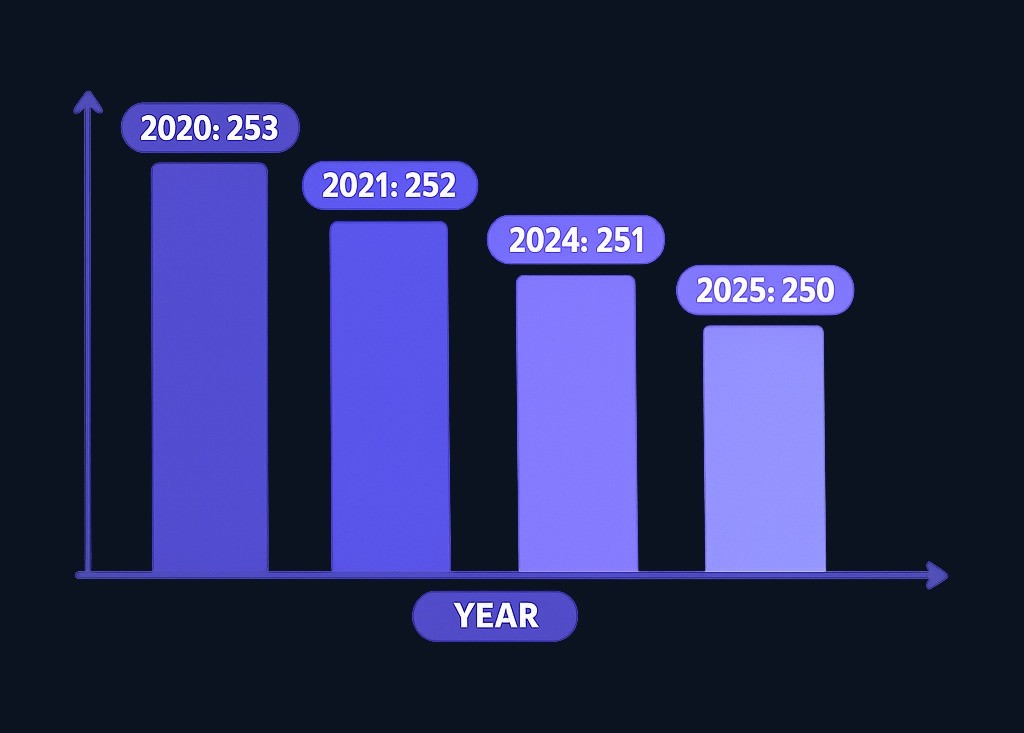
The annual count can shift by a few sessions. For example, one supplied overview reports 253 trading days in 2020 and 252 trading days in 2021 2020 and 2021 examples. Another notes that 2025 was expected to have around 250–251 trading days, with full holidays and half-day sessions affecting the schedule 2025 estimate.
Because the packet does not provide verified official counts for every recent year, the responsible approach is to use examples rather than pretend every historical count is confirmed here:
| Year or market example | Trading-day count or range | What it shows |
|---|---|---|
| U.S. markets, typical planning estimate | About 252 | Useful for annualized calculations |
| 2020 example | 253 | Some years have more sessions |
| 2021 example | 252 | Some years match the standard assumption |
| 2025 U.S. expectation cited in supplied source | 250–251 | Holidays and half-days can reduce the count |
| NSE 2026 figure cited in supplied source | 246 | International markets can differ materially |
This variation may look small, but it can matter. A day trader planning the number of sessions they will actively trade may care about every market day. A long-term investor may care less about the exact total, but still needs to understand how market holidays affect order timing, settlement expectations, and portfolio review dates.
Practical Implications for Traders
Trading-day counts are not just trivia. They affect how traders plan, measure, and review activity.
1. Annualized calculations often assume 252 trading days
Many traders use 252 as a shortcut when converting daily figures into annual estimates. That is reasonable for broad educational calculations, but exact research should use the actual number of sessions in the dataset. If you are comparing two years, a 250-day year and a 253-day year do not contain the same number of opportunities.
2. Strategy frequency depends on actual sessions
Suppose a beginner plans to practice reviewing charts for 30 minutes after each market close. Using the 252-day estimate, that is roughly 252 study sessions per year. But if the actual year has fewer sessions, the plan should adjust. The same applies to traders who place trades only on specific days, such as Mondays or the first trading day after a monthly report.
3. Holidays can change liquidity and behavior
A market day before or after a holiday may not feel like a normal session. Some participants may be away, and shortened sessions may have different conditions than full days. Because this depends on the market and year, traders should treat holiday weeks as planning exceptions rather than routine periods.
4. Backtests should match the real calendar
If a strategy is tested on historical data, the calendar matters. A backtest should use actual market sessions, not a generic 365-day year. This is especially important for strategies based on daily bars, rolling averages, monthly rebalancing, or options-related timing.
5. International traders need multiple calendars
A trader who follows U.S. stocks and Indian stocks cannot rely on one holiday schedule. As noted above, global exchanges vary, and investors with international exposure should track each relevant exchange calendar global variation.
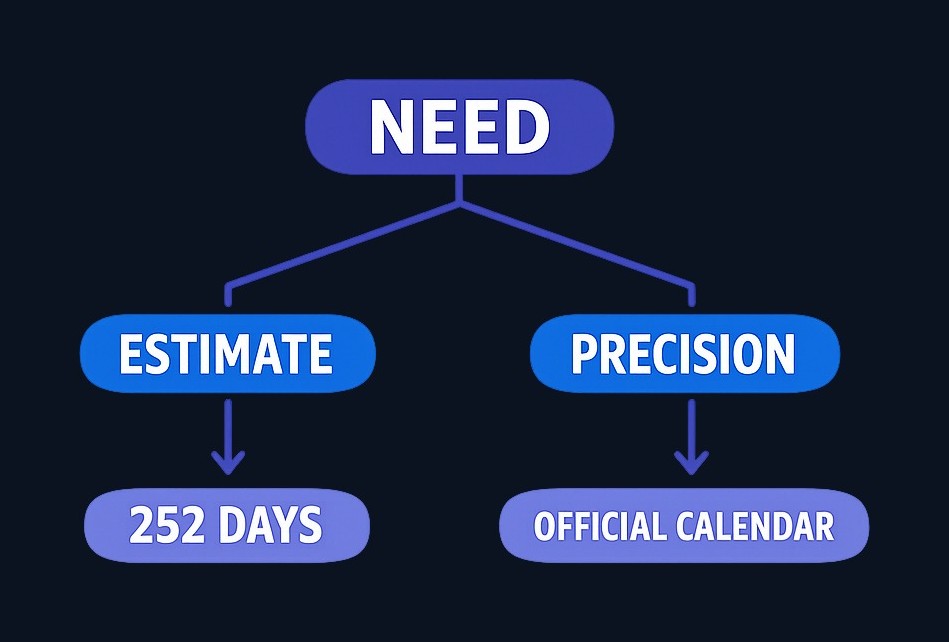
Here is a simple decision framework:
| If your goal is… | Use this trading-day approach |
|---|---|
| Quick mental estimate | Use about 252 U.S. stock trading days |
| Annual performance review | Use the exact calendar for that year and exchange |
| Day-trading schedule | Mark full days, half-days, and holidays in advance |
| International portfolio planning | Keep separate calendars for each exchange |
| Beginner education routine | Plan around live sessions, but review on non-trading days too |
This article is educational and not personalized financial advice. Before making trading decisions, consider your risk tolerance, costs, time horizon, and whether the market you trade is actually open.
How to Plan Around Trading Days
A practical annual plan can be simple:
- Choose your market. Do not mix U.S. stock, international stock, Forex, and crypto calendars into one assumption.
- Start with the estimate. For U.S. stocks, use about 252 trading days as a rough planning number.
- Check the official exchange or provider calendar. Replace the estimate with actual holidays, half-days, and special closures.
- Mark low-routine weeks. Holiday weeks and shortened sessions may require different expectations.
- Review your plan monthly. Calendars are predictable most of the time, but your availability and market conditions can change.
For example, a beginner who wants to learn from live market behavior might plan three activities:
- Observe the market during full trading days.
- Review notes on weekends or holidays.
- Avoid judging a strategy based only on unusual holiday-week sessions.
If you are building your investing knowledge, Finelo provides financial education resources that can help you learn market concepts in a structured way: explore Finelo.
FAQs About Trading Days
What is the average number of trading days in a year?
For U.S. stock markets, the common average is about 252 trading days per year average trading days. The actual number can vary slightly depending on weekends, holidays, leap years, and special closures.
How do holidays affect trading days?
If a market holiday falls on a weekday and the exchange closes, it reduces the number of trading days. The annual total changes depending on whether holidays fall on weekdays or weekends holiday impact.
Are trading days the same across different markets?
No. Trading days vary by market and country. U.S. stocks, international exchanges, Forex providers, and crypto platforms may all follow different schedules or definitions. Investors with international exposure should track the relevant exchange calendars market calendar variation.
What happens to trading days in a leap year?
A leap year adds one calendar day, but it does not always add one trading day. If the extra day falls on a weekend or market holiday, the trading-day count may not increase. This is one reason some years can have around 250, 251, 253, or 254 trading days leap year effect.
Key Takeaways
The best answer to “how many trading days are in a year?” is: about 252 for U.S. stock markets, but the exact number depends on the year and the market. Weekends, holidays, leap years, half-days, and rare special closures can all affect the final count.
Use 252 for quick estimates, but use the official calendar for real planning, backtesting, performance reviews, and international market exposure. A small difference in trading days may not matter for every investor, but it can matter for active traders, data analysis, and anyone trying to build a consistent market routine.
how many trading days in a yeartradingtrading education
Practice trading with Finelo
Practice in a simulator, learn with bite-sized lessons, and build confidence before risking real money.
About the author
Finelo Team
The Finelo Team creates practical investing and trading education designed to help beginners learn faster with structured challenges, simulator practice, and bite-sized lessons.
Keep reading — Related articles

Trading
Options Wheel Strategy: How It Works and Its Risks
The phrase "wheel strategy options" describes a repeatable income approach: sell cash‑secured puts until assigned, buy the stock when assigned, then sell covered calls on the shares to collect more premium and define exit points. This cycle — sell puts → buy stock on assignment → sell covered…
Finelo Team
Trading
Volume Profile Trading: How It Works and Its Limitations
Volume profile trading maps how much volume traded at each price level during a chosen period, revealing levels where the market accepted or rejected price. Traders use the Point of Control (the single price with the highest traded volume), value areas, and volume nodes to identify likely support/resistance…
Finelo Team
Trading
What is Unusual Options Activity and Why Does It Matter?
Unusual options activity (UOA) is a sudden, outsized spike in options trades — volume or open interest — relative to a contract’s recent norms. Traders watch UOA because large, concentrated options orders can signal informed or institutional positioning that sometimes precedes significant stock moves. Example: a single large…
Finelo Team


