A double bottom pattern is a bullish reversal shape that forms after a downtrend, when price drops to a low, bounces, drops again to roughly the same level, and then turns back up, tracing a "W" across the chart. The two lows mark a support area that sellers failed to break twice. The high between them is the neckline, and most traders treat the pattern as confirmed only when price closes above it. On its own, the shape is a clue that selling pressure may be fading. It is not a promise that the price will rise.
The Double Bottom Pattern: A Complete Guide for Traders
A double bottom pattern is a bullish reversal shape that forms after a downtrend, when price drops to a low, bounces, drops again to roughly the same level, and then turns back up, tracing a W across the chart.
12 min read
Practice trading with Finelo
Practice in a simulator, learn with bite-sized lessons, and build confidence before risking real money.
Want to learn more?
Practice in a simulator, learn with bite-sized lessons, and build confidence before risking real money.
Explore FineloExplore Finelo's 28-day challenges
Turn learning into a daily habit with guided challenge paths.
This guide is for beginners who want a clearer explanation than "wait for the breakout and buy." You will learn how the structure forms, what confirmation requires, how a failed double bottom pattern gives itself away, and how it differs from its mirror image, the double top.
The "W" gets your attention. The neckline earns the decision.
What a double bottom pattern is
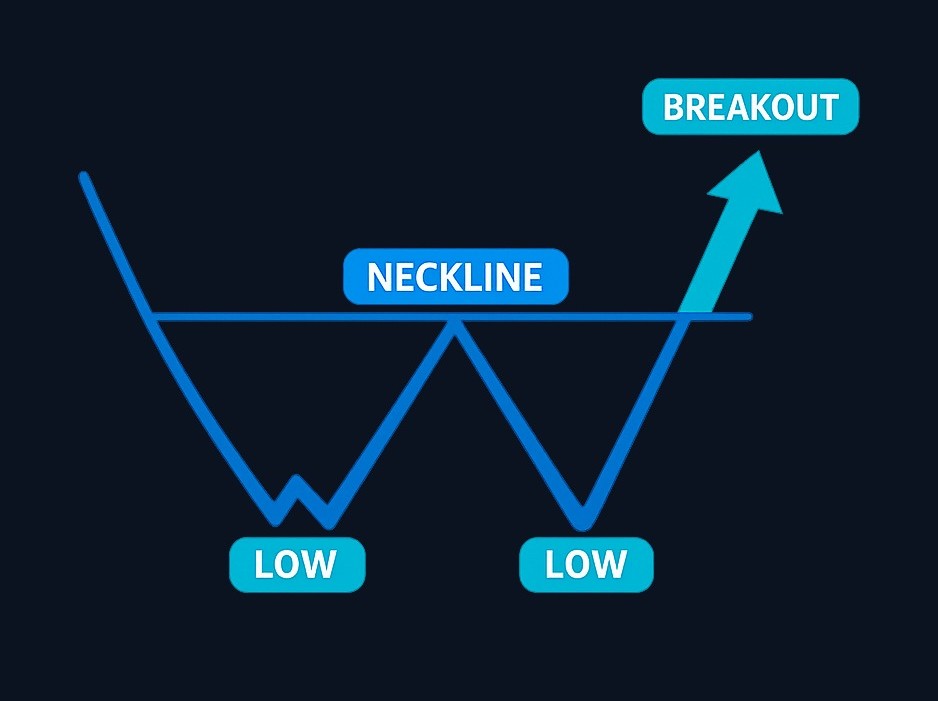
A double bottom is a multi-bar chart pattern, not a single candle. It appears after a decline, and it has the same three parts every time. The two lows sit at a similar level, distinct troughs rather than single spikes. The neckline is the intermediate high between them, the level that confirms or denies the whole idea. The breakout is a close above that neckline. Until it arrives, you have a shape, not a signal.
The same structure gets searched under several names — a double bottom chart pattern, a double bottom candlestick pattern, a double bottom stock pattern — and they all describe one thing. Be careful with the tolerance figures you see quoted for how close the lows must be. Sources differ, some cite a few percent, others give no number, and there is no agreed standard. What matters is whether both lows tested the same support zone.
The meaning lives in those two lows. The first is where the downtrend paused. The second shows that sellers tried again and could not push through. That repeated failure marks a support level buyers were willing to defend, which is why the formation reads as a possible shift from selling to buying.
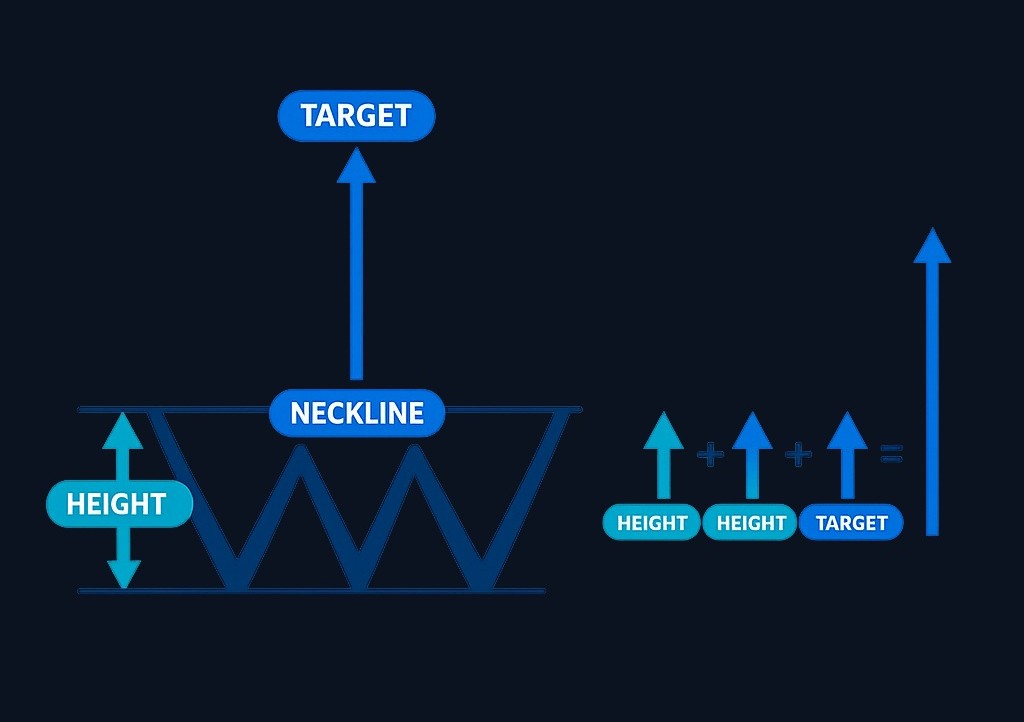
What it cannot tell you is whether buyers actually take control. Support that held twice can still break on the third attempt. The distance from the lows up to the neckline is the pattern height, which many traders project above the breakout as a double bottom pattern target, a method called the measured move.
How to spot one on a chart
The most common beginner mistake is spotting the shape first and reasoning backward into a trade. A steadier process runs the other way: context, then structure.
- Check the trend. A double bottom reverses a decline, so a prior downtrend matters. A "W" inside a choppy range means far less.
- Check the lows and the spacing. Two real troughs at a similar level, with a genuine recovery between them, not one low and a wobble.
- Mark the neckline. Draw the intermediate high. That is your confirmation level.
- Define invalidation. Know what would prove the read wrong, commonly a move back below the second low.
Timeframe changes the message. A formation built over weeks on a daily chart, at a support level the market has tested before, is a different animal from a noisy "W" on a five-minute chart.
Why confirmation is the whole game
Price testing support twice tells you sellers failed twice. It does not tell you buyers have won. The neckline break is the market's vote on that question, which is why most sources treat the pattern as incomplete until price closes above the intermediate high.
Buying the second low is tempting, because it looks like catching the exact turn. It is also the fastest route to a failed pattern, since a second low can always become the first leg of a deeper decline. Waiting for the double bottom breakout costs part of the move, but the market speaks before you act, and you get a level to be wrong against.
Volume deserves a warning of its own, because the usual advice is less settled than it sounds. The common teaching is that participation fades into the second low as sellers run out of conviction. But a heavy, climactic second low can equally mark capitulation, and some analysts read that as the stronger case. The claim that survives both readings is simpler: a breakout on thin participation is a caution, whatever the second low did.
A pattern you have to squint at is a pattern you should skip.
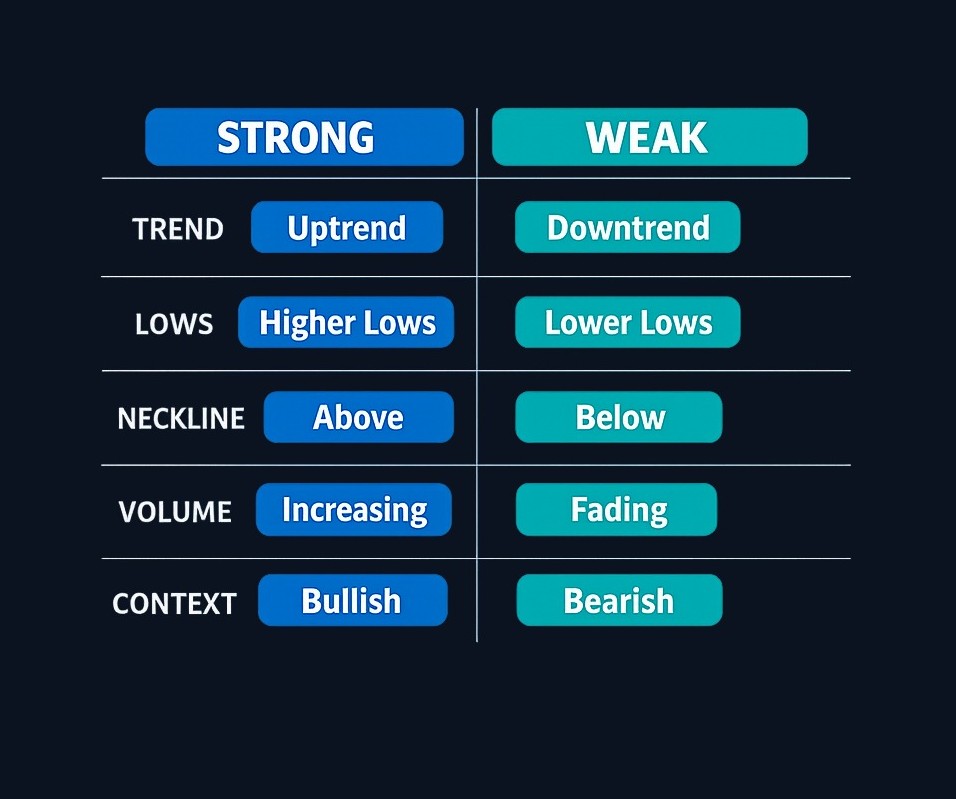
A decision framework: grade the setup before you act
The useful version of this pattern is not "see W, place trade." It grades the setup first.
| Decision point | Stronger setup | Weaker setup | Practical next step |
|---|---|---|---|
| Trend context | A clear, extended prior downtrend | A sideways or choppy range | Favor patterns with something real to reverse |
| The two lows | Distinct troughs at a similar level | One spike, or lows far apart | Do not force the label if it is unclear |
| Spacing | A genuine recovery between the lows | A quick wiggle inside one leg | Zoom out a timeframe and look again |
| Neckline | Marked in advance, clearly defined | Guessed at after the fact | Draw the level before the breakout |
| Volume | Expands on the neckline break | Breakout on thin participation | Weigh the breakout's volume, not the second low's |
| Confirmation | A close above the neckline | Price still under it | Wait, or study it as an example instead |
| Risk | Invalidation sits at a sensible distance | Stop would be uncomfortably wide | Skip, or size down in practice |
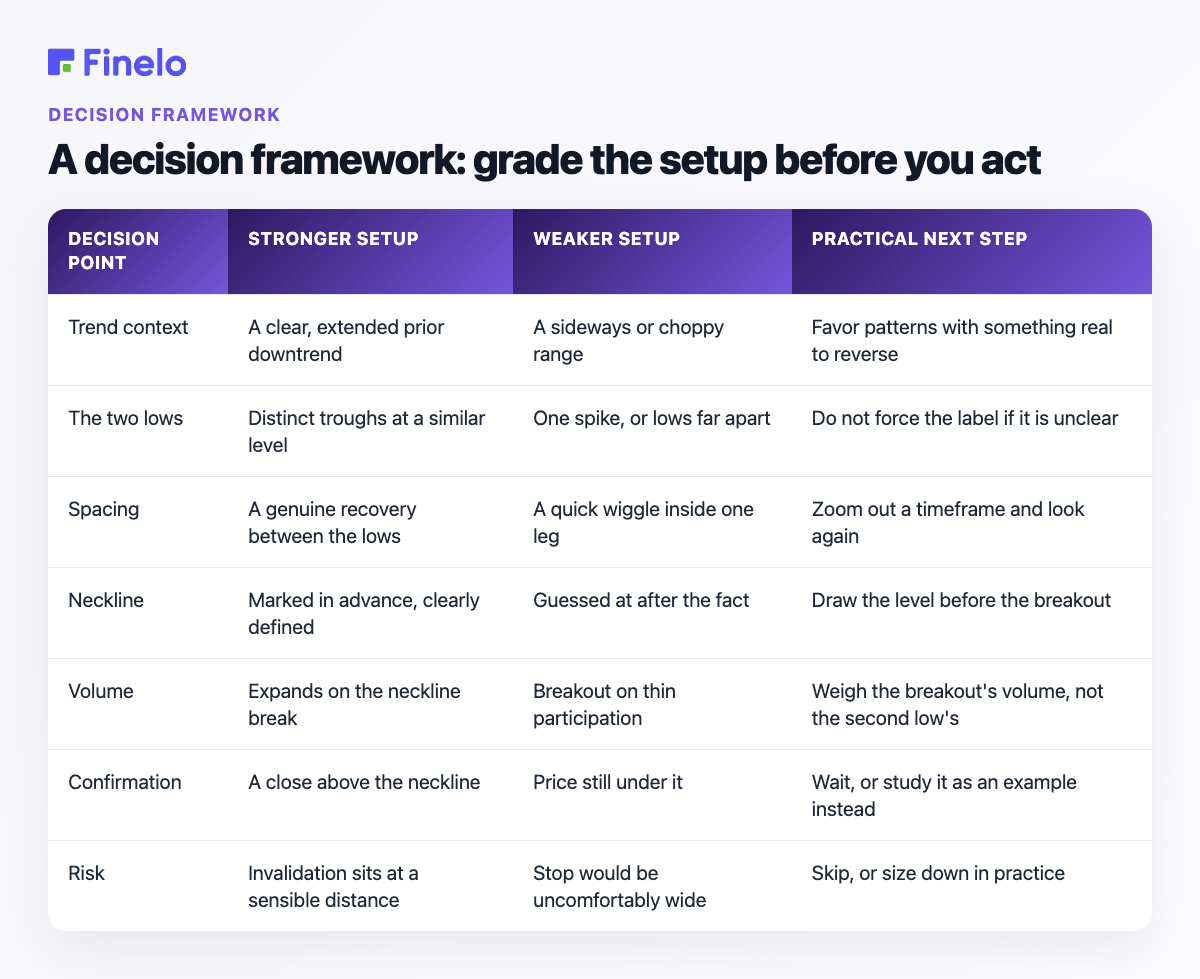
Use it as a scorecard, not a formula. If two or more rows land on the weaker side, observing beats trading.
A worked example
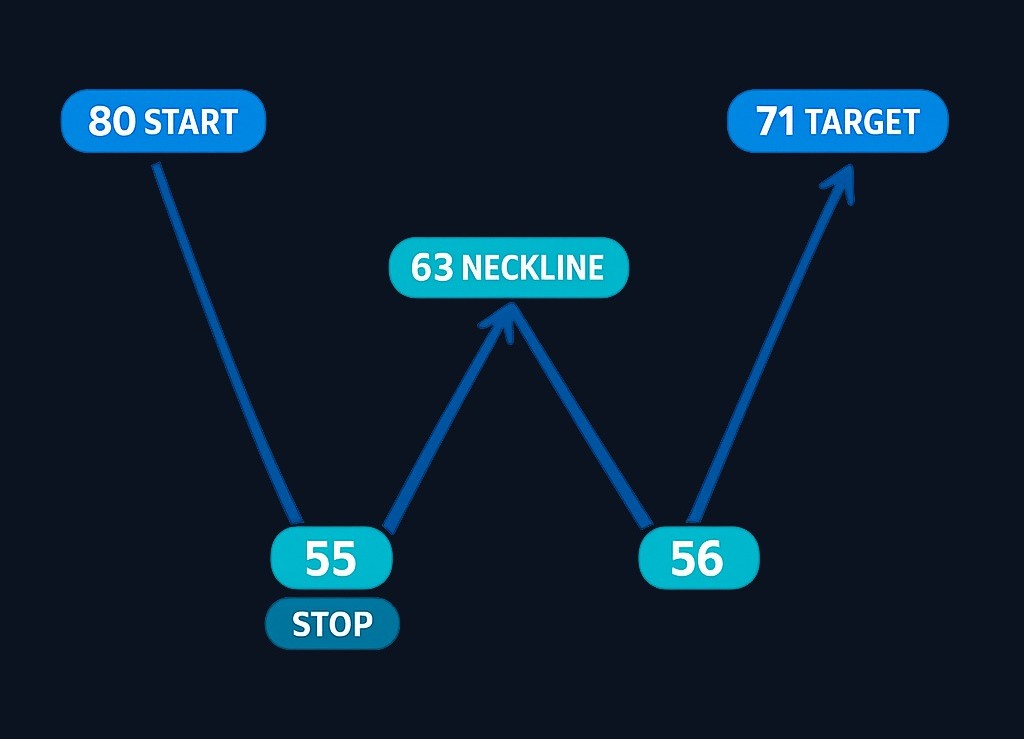
Here is an illustrative scenario, not a real trade or a recommendation. Say a stock falls from 80 to 55, bounces to 63, then declines again and stalls near 56. The 55 to 56 area is the support zone, now tested twice. The 63 high is the neckline.
A confirmation-based trader would not buy at 56. They would mark 63 as the level that has to break, and wait. Pattern height is measured from the lower low, so 63 minus 55 is 8, and a measured move projects a hypothetical target near 71, checked against any resistance in between. The most commonly cited invalidation places the stop-loss below the second low, though some sit under both lows, beneath the whole 55 to 56 zone. These numbers are illustrative, not a prediction, and none of this is a recommendation.
Decision quality comes from defining invalidation before entry, not from being right about one pattern.
Practice trading with Finelo
Practice in a simulator, learn with bite-sized lessons, and build confidence before risking real money.
Double bottom vs other patterns
The "W" is easy to confuse with shapes that mean something quite different. Compare structure and location rather than trusting the name.
| Pattern | What it looks like | Where it appears | Common interpretation |
|---|---|---|---|
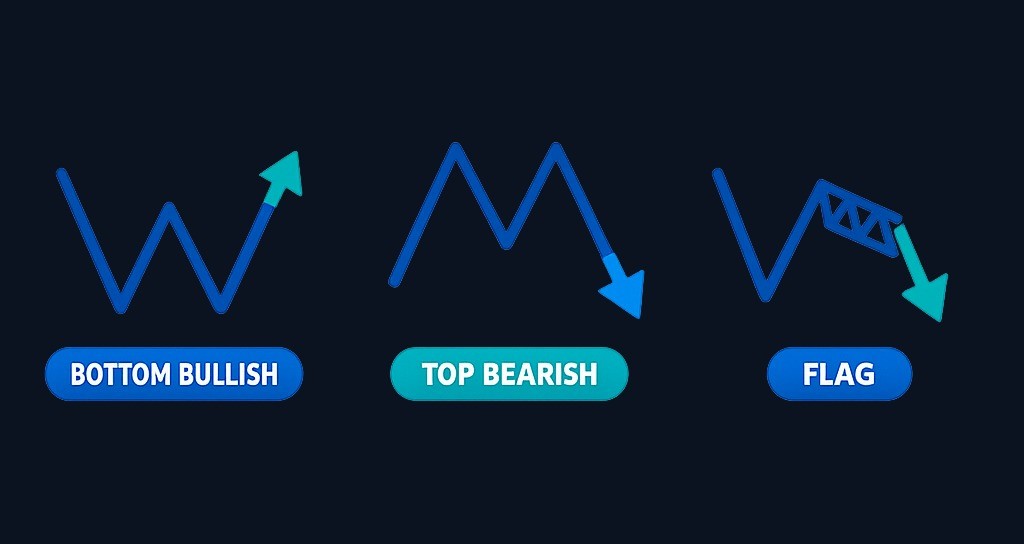
| Double bottom | Two lows at a similar level, "W" shape | After a downtrend | Possible bullish reversal, confirmed on a close above the neckline |
| Double top | Two highs at a similar level, "M" shape | After an uptrend | Possible bearish reversal, confirmed on a close below the neckline |
| Triple bottom | Three lows at a similar level | After a downtrend | Similar read, with a third test of the same support |
| Bear flag | A sharp drop, then a small upward drift | Inside a downtrend | Possible continuation lower, easily mistaken for a "W" |
The double top and double bottom are mirror images in opposite trend contexts, which settles whether a double bottom is bullish or bearish: the "W" is the bullish one, the "M" the bearish one. The bear flag is the dangerous lookalike, because a drop followed by a weak bounce resembles the left half of a "W" right up until price continues lower.
How reliable is a double bottom pattern?
Reliability is conditional, and any specific success rate should make you suspicious rather than confident. Performance depends on the market, the timeframe, the liquidity, the definition of a valid low, the confirmation rule, the target method, and the costs. A figure quoted without those details is decoration.
What can be said honestly is where it holds up and where it struggles. It is considered more meaningful over longer timeframes, at a well-tested support level, and in an improving market. It is weaker in strong downtrends and in range-bound markets, which produce "W"-like shapes constantly and resolve them at random.
A failed double bottom pattern usually announces itself. It breaks out, then closes back below the neckline within a session or two, which is a false breakout. Or the second low undercuts the first by too much, suggesting sellers were stronger than the shape implied. Studying those failures beats collecting textbook winners, because the textbook version is not what you meet on a live chart.
Common mistakes to avoid
The biggest one is calling every dip-bounce-dip a double bottom. A valid setup needs a real prior downtrend, two lows testing the same support zone, a marked neckline, and confirmation. A rough "W" is not enough, and neither is a shape you noticed because you wanted one.
A subtler mistake is redrawing the neckline. If you are nudging the level so a breakout finally counts, you have stopped reading the chart and started negotiating with it. Mark it once, before price gets there.
Related is treating the double bottom pattern target as an expectation rather than a hypothesis: a measured move says where price could go, not where it owes you.
The last one is cherry-picking. Most examples online were chosen after the outcome was known, which makes every pattern look obvious. Scroll historical charts with the future hidden and judge each setup on what was visible at the time. That is the difference between studying a pattern and admiring a highlight reel.
Practice before you risk anything
If you are still learning this pattern, do not start on a live chart with real money. Collect examples first: clean setups, breakouts that failed, bear flags that faked a "W," and formations that only looked obvious in hindsight. Mark the lows, draw the neckline, note the breakout volume, and write down what confirmation would have looked like.
Inside the Finelo app, you can study chart structure and practice buy, sell, and hold decisions on real market data with virtual funds. There are no deposits, no withdrawals, and no broker connection, it is a closed practice loop, so the only cost of a wrong read is the lesson.
The Finelo trading simulator pairs that practice with short lessons and a review habit. For the underlying candlestick literacy, start with what a doji candle is.
Final decisions are always yours. A pattern is a tool for thinking more clearly, not a substitute for judgment.
Practice reading chart patterns in the Finelo app →
Where to learn more
Finelo also publishes educational material for beginners; you can check Finelo reviews, the About Finelo page, or the Finelo support center.
Finelo is an educational product, not a brokerage. The simulator uses virtual funds and real market data, and final trading and investing decisions are yours, made through your own brokerage account when you choose to act. This article is for education and is not financial advice.
Frequently asked questions
Is a double bottom pattern bullish or bearish?
It is read as bullish. The pattern forms after a downtrend and suggests selling pressure may be exhausting, since buyers defended the same support twice. Its mirror image, the double top, is the bearish version. The read is only valid once price closes above the neckline.
What happens after a double bottom pattern?
After a confirmed close above the neckline, traders may look for continuation toward a measured target based on the pattern's height. It can also fail, with price dropping back below the neckline. The outcome depends on follow-through, not the shape.
How reliable is a double bottom pattern?
Conditional. It matters more over longer timeframes, at a well-tested support level, and in an improving market, and less in strong downtrends and choppy ranges, where false breakouts are common. Be skeptical of any success-rate figure offered without a sourced test.
How is a double bottom different from a double top?
They are mirror images. A double bottom forms after a downtrend, looks like a W, and reads as potentially bullish, confirming on a break above the neckline. A double top forms after an uptrend, looks like an M, and confirms bearish below it.
Can a double bottom pattern fail?
Yes, often. It fails when the breakout has no follow-through, when price closes back below the neckline, when the second low undercuts the first by too much, or when broader conditions work against it. A bear flag can also masquerade as a W before price falls further.
double bottom patternchart analysistrading education
Practice trading with Finelo
Practice in a simulator, learn with bite-sized lessons, and build confidence before risking real money.
About the author
Finelo Team
The Finelo Team creates practical investing and trading education designed to help beginners learn faster with structured challenges, simulator practice, and bite-sized lessons.
Keep reading — Related articles

Chart Analysis
What Is VWAP? Volume-Weighted Average Price Explained
VWAP stands for volume-weighted average price: the average price a security has traded at over a period, usually one trading session, with each price weighted by the volume that traded there.
Finelo Team
Chart Analysis
What Is MACD? How to Read Momentum With Moving Averages
MACD, short for Moving Average Convergence Divergence, is a momentum indicator built from two moving averages of price.
Finelo Team
Chart Analysis
What Is the Three White Soldiers Pattern? How to Read It on a Chart
Three white soldiers is a bullish candlestick pattern made of three consecutive long-bodied up candles that step higher like a staircase.
Finelo Team