A doji candle is a candlestick where the open and close finish at nearly the same price, leaving a very small body and usually wicks on one or both sides. It is the market showing indecision: buyers and sellers pushed price around, but neither closed with control. On its own a doji says little about direction; it becomes useful only when read against the trend, the level it forms at, and what price does next.
What Is a Doji Candle? How to Read Market Indecision
A doji candle is a candlestick where the open and close finish at nearly the same price, leaving a very small body and usually wicks on one or both sides. Learn the main types, how to read one in context, and what tends to happen after a doji forms.
10 min read
Practice trading with Finelo
Practice in a simulator, learn with bite-sized lessons, and build confidence before risking real money.
Want to learn more?
Practice in a simulator, learn with bite-sized lessons, and build confidence before risking real money.
Explore FineloExplore Finelo's 28-day challenges
Turn learning into a daily habit with guided challenge paths.
This guide is for beginners who keep seeing the cross-shaped candle and want to know what the doji candle is actually telling them. You will learn the main types, how to read one in context, what tends to happen after a doji candle, and the mistakes that turn a neutral clue into a bad trade. The goal is not to memorize a shape or call every one a reversal, but to build a repeatable way of judging whether a pause matters.
A doji is a question the market is asking, not an answer.
What a doji candle is
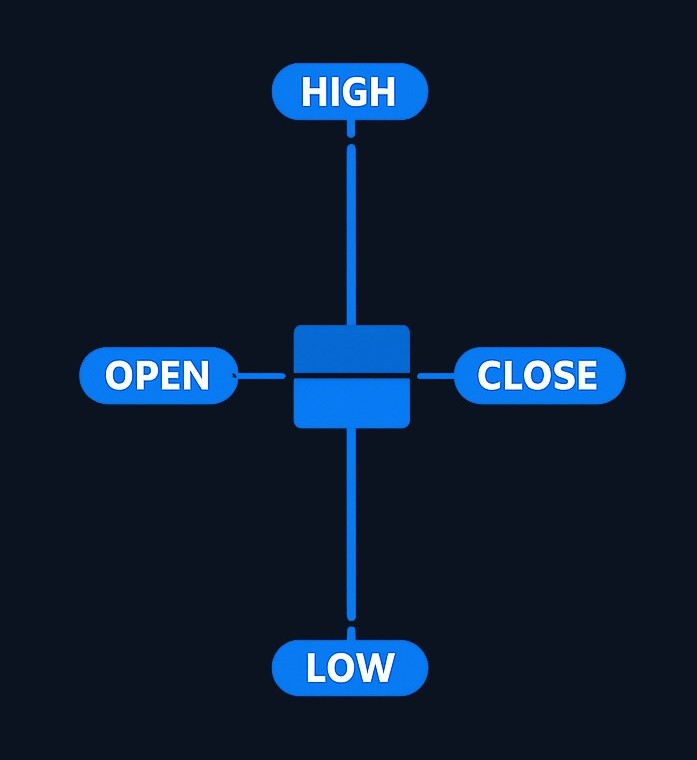
The defining feature is a tiny real body: the open and close land near the same price. The wicks, or shadows, can be long or short, and their position is what gives each variation its character. Because the body is so small, a candle doji looks like a cross or a T rather than the solid rectangle of a strong up or down session.
"Near the same price" is relative, not absolute. A two-cent gap is trivial on a high-priced stock but meaningful on a penny instrument, so the useful test is whether the body is small compared with recent candles, not whether it is mathematically perfect. A single small body in isolation is just a quiet session; what makes it a signal is where it appears and how decisively the next candle resolves it.
Types of doji candles
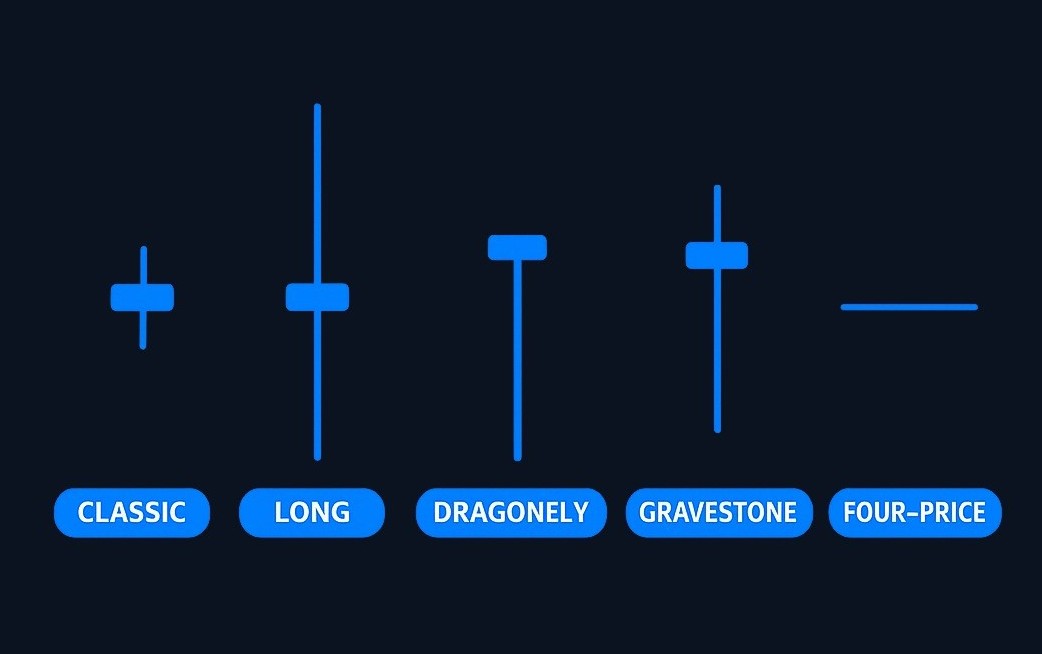
Most variations share the same tiny body. What differs is where that body sits inside the high-low range, and that position changes the story.
| Type | What it looks like | Common read | Best context to review |
|---|---|---|---|
| Classic doji | Tiny body near the middle, wicks both sides | Balanced indecision, neither side in control | After a strong move or at a key level |
| Long-legged doji | Tiny body, long upper and lower wicks | Active disagreement, high intraperiod volatility | Around news, breakouts, or major levels |
| Dragonfly doji | Tiny body near the top, long lower wick | Sellers lost control by the close, possible bullish rejection | After a decline or near support |
| Gravestone doji | Tiny body near the bottom, long upper wick | Buyers lost control by the close, possible bearish rejection | After an advance or near resistance |
| Four-price doji | Open, high, low, and close nearly identical | Very little movement or thin liquidity | Thinly traded markets, use caution |
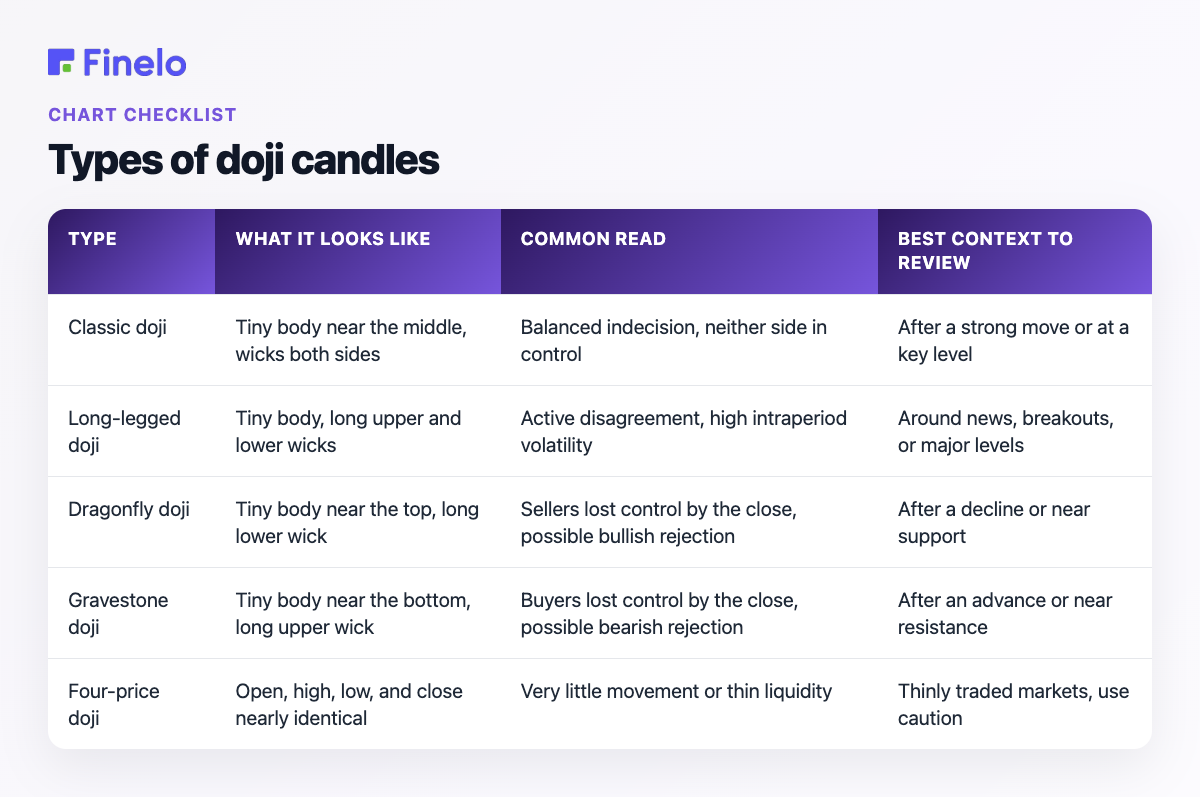
These names sound more precise than real charts allow, so treat them as visual shorthand, not rigid labels, and never assume the label alone sets direction. A dragonfly inside a choppy range is ordinary; a gravestone after a long rally is worth attention, but only if the next candle follows through.
How to read a doji candle in context
The most useful question a doji raises is not "is this bullish or bearish," but "what changes around it." The shape only reports that one period ended in balance; the meaning comes from the setting it appears in.
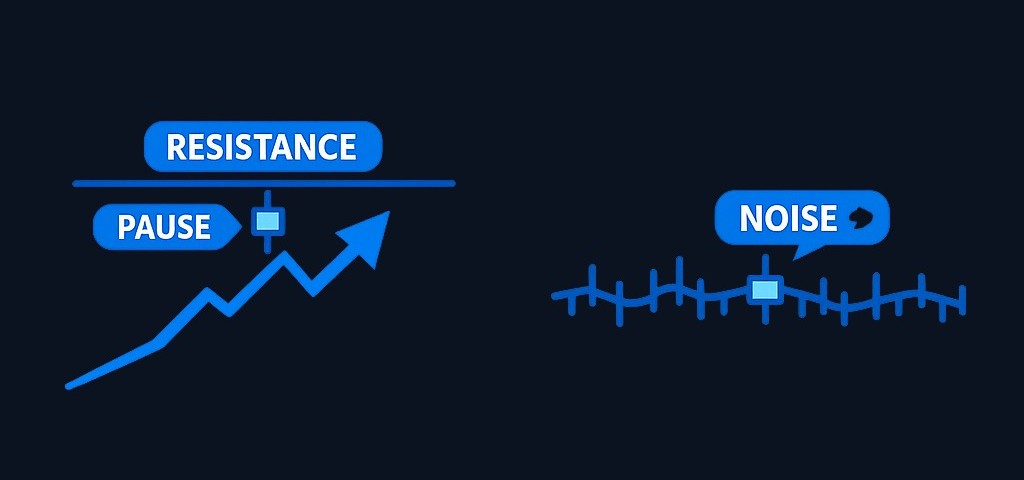
A small-bodied session after several strong green candles reads very differently from the same shape drifting through a directionless range. In the first case it hints that momentum is stalling, and in the second it is usually just noise, one of many indecisive bars in a market that has not committed.
Location sharpens that read. A doji resting on a prior swing high, a round number, a moving average, or a support zone matters more than one floating in open space, because it marks a level the market already respects. The wicks add another layer, since long shadows show that price explored well above and below the open before settling, and a long upper or lower wick points to where a push was rejected. Volume can either confirm or deflate the story: a small body on heavy volume suggests genuine disagreement at that level, while the same shape on thin volume may only reflect a quiet session.
A decision framework
The point of a framework is to slow the decision down so one bar does not become a prediction. Before acting on a doji, work through a short checklist and treat unclear answers as reasons to wait.
- What came before? A clear prior advance or decline gives the pause meaning; a messy sideways range does not.
- Where did it form? Near support, resistance, a trendline, or a prior swing is stronger than the middle of nowhere.
- What do the wicks show? A long wick rejecting a key level says more than a tiny, featureless range.
- What happens next? Follow-through is the real signal: does the next bar break the doji's high or low, or stay inside it?
- Is risk defined? If you cannot name an invalidation level and a position size, you have a chart, not a plan.
- Does it fit your system? A signal that fights the primary trend, volume, and timeframe is weaker than one that agrees with them.
If two or more of those answers are unclear, observing beats trading.
What happens after a doji candle
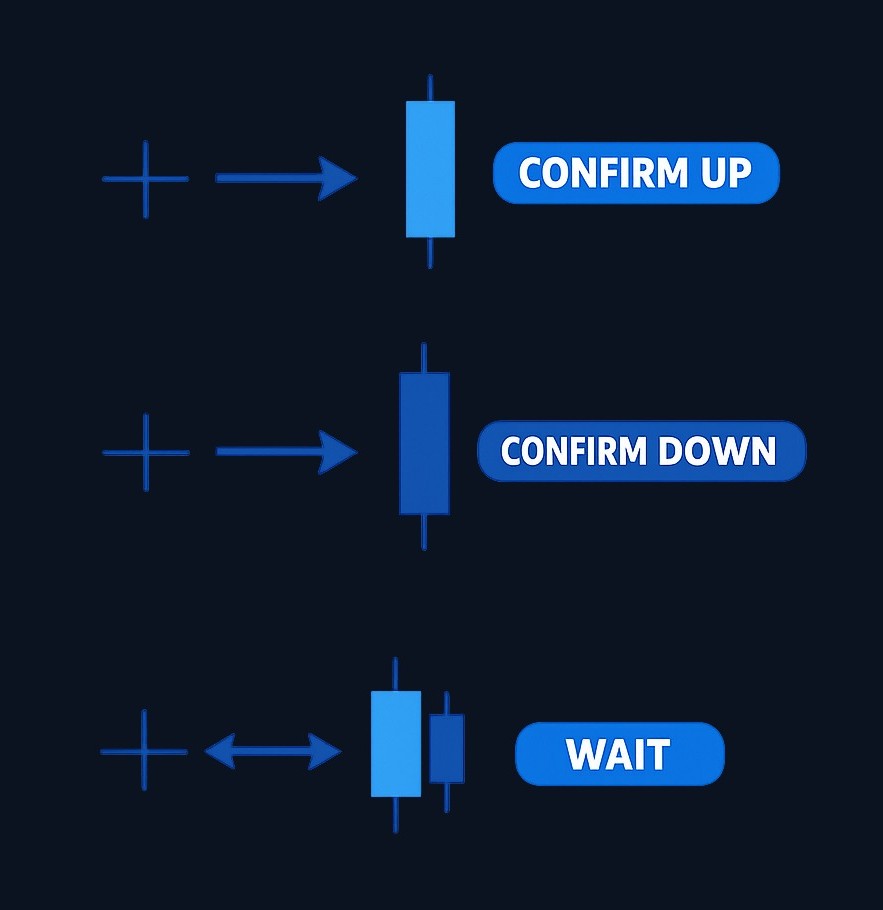
If you searched for "after doji candle," the honest answer is: look for confirmation, not certainty. The next session is what turns a pause into information. A close above the high of the doji can support a bullish read, especially after a decline or near support. A close below the low can support a bearish read, especially after an advance or near resistance.
If the next bar stays inside the doji's range, nothing is resolved. Some traders treat that compression as a coiled spring and wait for a later breakout; others skip it because the signal never developed. Both are reasonable, as long as the rule is set in advance. The shape got your attention; the follow-through earns the trade.
Practice trading with Finelo
Practice in a simulator, learn with bite-sized lessons, and build confidence before risking real money.
A worked example
Here is an illustrative scenario, not a real trade or a suggestion. Say a stock rallies from 40 to 52 and stalls at a prior high near 52. The next session pushes to 53, fails to hold, and closes back at 52, printing a gravestone-like doji with a long upper wick and a tiny body.
A confirmation-based trader would not act on the close alone. They might wait for the next candle to close below the doji's low near 51 before treating rejection as confirmed, place invalidation above 53, and look toward prior support near 48. If price instead closes back above 53, the pause resolved higher and the idea is gone.
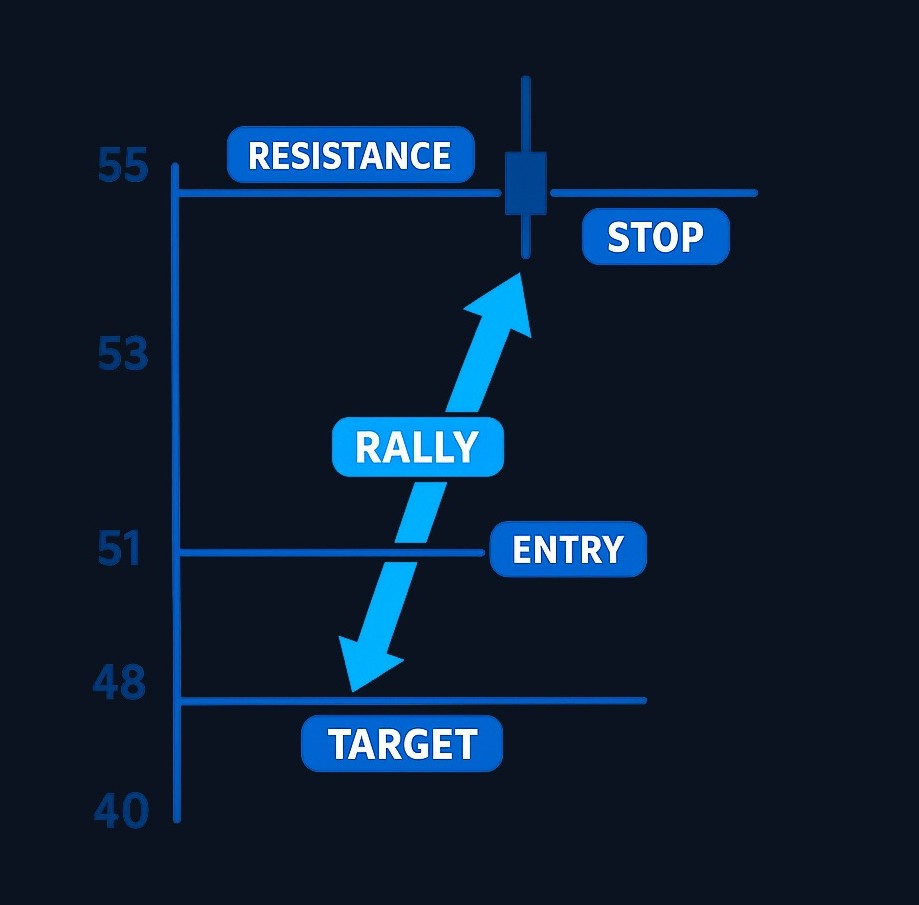
Decision quality comes from defining invalidation before entry.
Doji vs other candlestick patterns
A doji is easy to confuse with its neighbors, and the difference is body size and message. A spinning top has a small body too, just larger than a doji's, and both signal hesitation more than direction. A hammer or shooting star emphasizes rejection from one side, reading as more directional than a doji's balance, and an engulfing pattern is stronger still, since one body overtakes the previous one.
So a doji is usually an early warning of a possible reversal rather than a decisive signal. That is a role, not a weakness: the cross-shaped bar flags hesitation, and a stronger candle, such as a bearish engulfing after a rally, does the confirming.
As for reliability, there is no universal figure: it depends on the definition, timeframe, asset, market regime, and confirmation rule, and any performance claim worth trusting comes with a transparent, defined test.
Common mistakes to avoid
The most common mistake is acting before confirmation. A doji tells you the period ended near where it began, not what the next must do, so an early entry is often a trade into a market that is only pausing.
Close behind is ignoring the preceding move: the formation means more after a clear trend than inside sideways chop, where similar shapes appear constantly and cancel out.
Traders also overlook liquidity and news: a tiny-range session in a thinly traded asset may reflect low participation rather than genuine balance, and around earnings or major releases wicks can stretch and follow-through can turn erratic.
The last mistake is focusing on the shape and forgetting the trade. A setup needs an entry trigger, an invalidation level, target logic, and a position size, or the pattern is a story, not a plan.
Practice before you risk anything
If you are still learning these candles, do not start on a live chart with real money. Collect examples first: dojis that marked real turns, dojis that led nowhere, and cross-shaped bars that meant nothing. Mark the trend, the level, and the wick structure, and note what confirmation would have looked like. That habit separates a real signal from chart noise.
Inside the Finelo app, you can study candlestick structure and practice buy, sell, and hold decisions on real market data with virtual funds. There are no deposits, no withdrawals, and no broker connection, it is a closed practice loop, so the only cost of a wrong read is the lesson.
Final decisions are always yours. A pattern is a tool for thinking more clearly, not a substitute for judgment.
Practice reading candlesticks in the Finelo app →
Where to learn more
For broader candlestick foundations, start with how to read candlesticks. Finelo also publishes educational material for beginners; you can check Finelo reviews, the About Finelo page, or the Finelo support center.
Finelo is an educational product. The simulator uses virtual funds and real market data and is not a brokerage. Final trading and investing decisions are yours and are made through your own brokerage account when you choose to act. Not financial advice.
Frequently asked questions
What does a doji candle indicate?
It indicates indecision: the open and close finished near the same price, so neither buyers nor sellers ended the period in control. The read becomes more useful with trend context, a nearby level, volume, and follow-through.
Is a doji candle bullish or bearish?
Neither on its own. After a decline near support, a dragonfly form can support a bullish thesis if price confirms upward; after a rally near resistance, a gravestone form can support a bearish thesis if price breaks lower. Without confirmation it is best read as neutral.
What should I look for after a doji candle?
Watch the next candle. A close above the doji's high can support a bullish reading, a close below its low a bearish one, and price staying inside the range means the market is still undecided.
What are the main types of doji candles?
The common ones are classic, long-legged, dragonfly, gravestone, and four-price. All share a tiny body; the wick structure is what differs and hints at where price was rejected.
How reliable is a doji candle?
Its reliability is conditional. It tends to matter more after a clear trend or at an important level, and less in quiet, rangebound markets. Any reliability figure should come with a defined test covering timeframe, asset, sample size, and confirmation rules.
doji candlecandlestick patternschart analysistrading education
Practice trading with Finelo
Practice in a simulator, learn with bite-sized lessons, and build confidence before risking real money.
About the author
Finelo Team
The Finelo Team creates practical investing and trading education designed to help beginners learn faster with structured challenges, simulator practice, and bite-sized lessons.
Keep reading — Related articles

Chart Analysis
What Is VWAP? Volume-Weighted Average Price Explained
VWAP stands for volume-weighted average price: the average price a security has traded at over a period, usually one trading session, with each price weighted by the volume that traded there.
Finelo Team
Chart Analysis
What Is MACD? How to Read Momentum With Moving Averages
MACD, short for Moving Average Convergence Divergence, is a momentum indicator built from two moving averages of price.
Finelo Team
Chart Analysis
What Is the Three White Soldiers Pattern? How to Read It on a Chart
Three white soldiers is a bullish candlestick pattern made of three consecutive long-bodied up candles that step higher like a staircase.
Finelo Team