For U.S. readers: This article discusses U.S. rules and financial products. State rules and individual eligibility may differ.
Volume Profile vs Market Profile: What Each Chart Measures
Volume Profile groups traded volume by price level.
7 min read
Practice trading with Finelo
Practice in a simulator, learn with bite-sized lessons, and build confidence before risking real money.
Want to learn more?
Practice in a simulator, learn with bite-sized lessons, and build confidence before risking real money.
Explore FineloExplore Finelo's 28-day challenges
Turn learning into a daily habit with guided challenge paths.
Quick answer
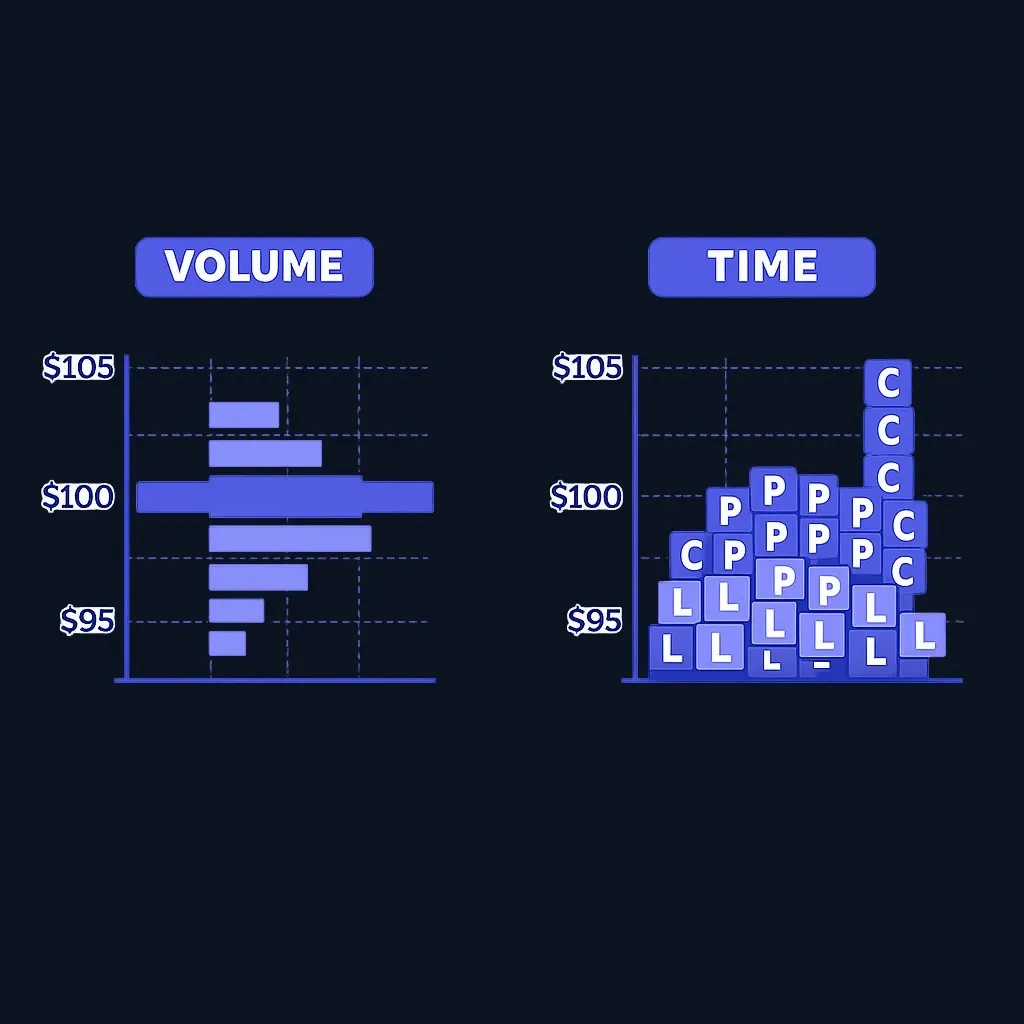
Volume Profile groups traded volume by price level. Market Profile groups the time a market spent at each price, commonly using time-price-opportunity blocks. The charts can look similar, but they answer different questions: Volume Profile describes where recorded volume concentrated; Market Profile describes how a session developed across price and time. Neither predicts the next price move, and both depend on the data range and session settings selected. Finelo provides financial education, not financial or investment advice.
The essential distinction
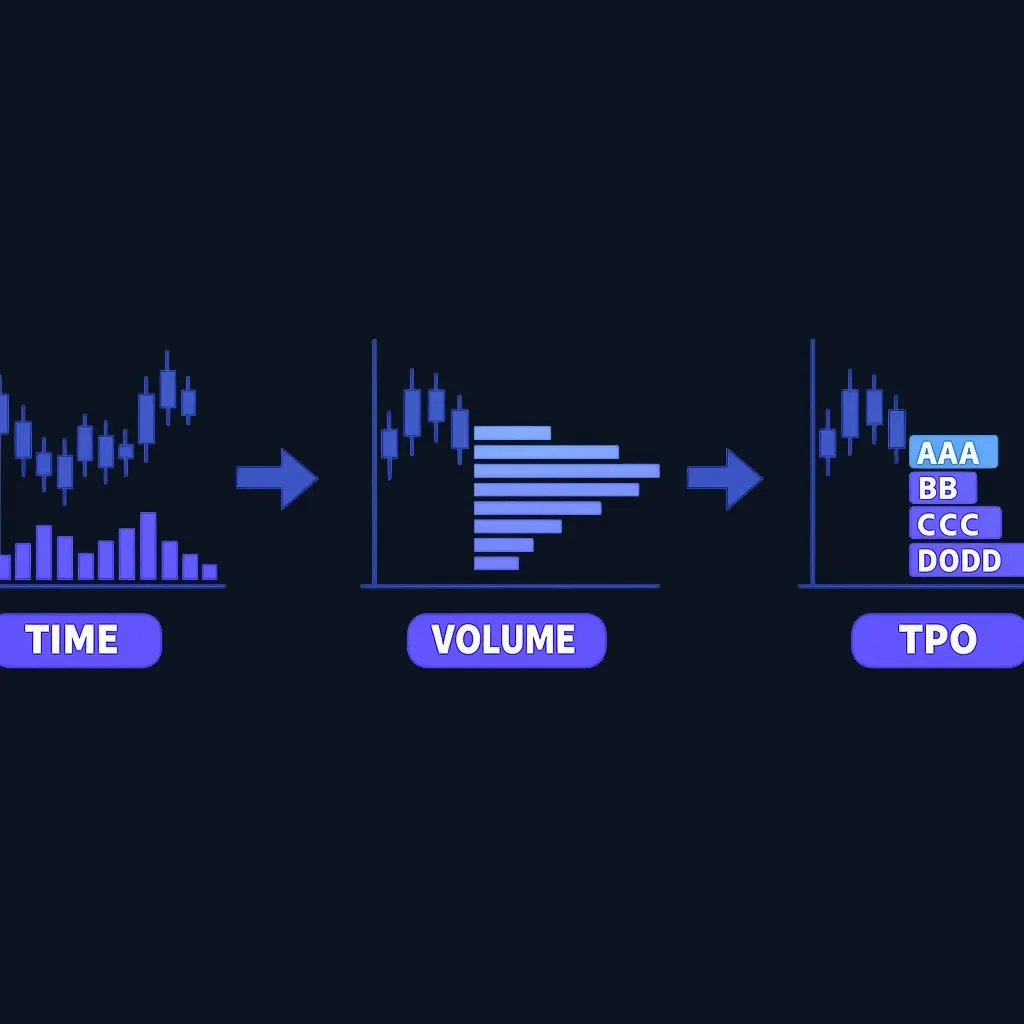
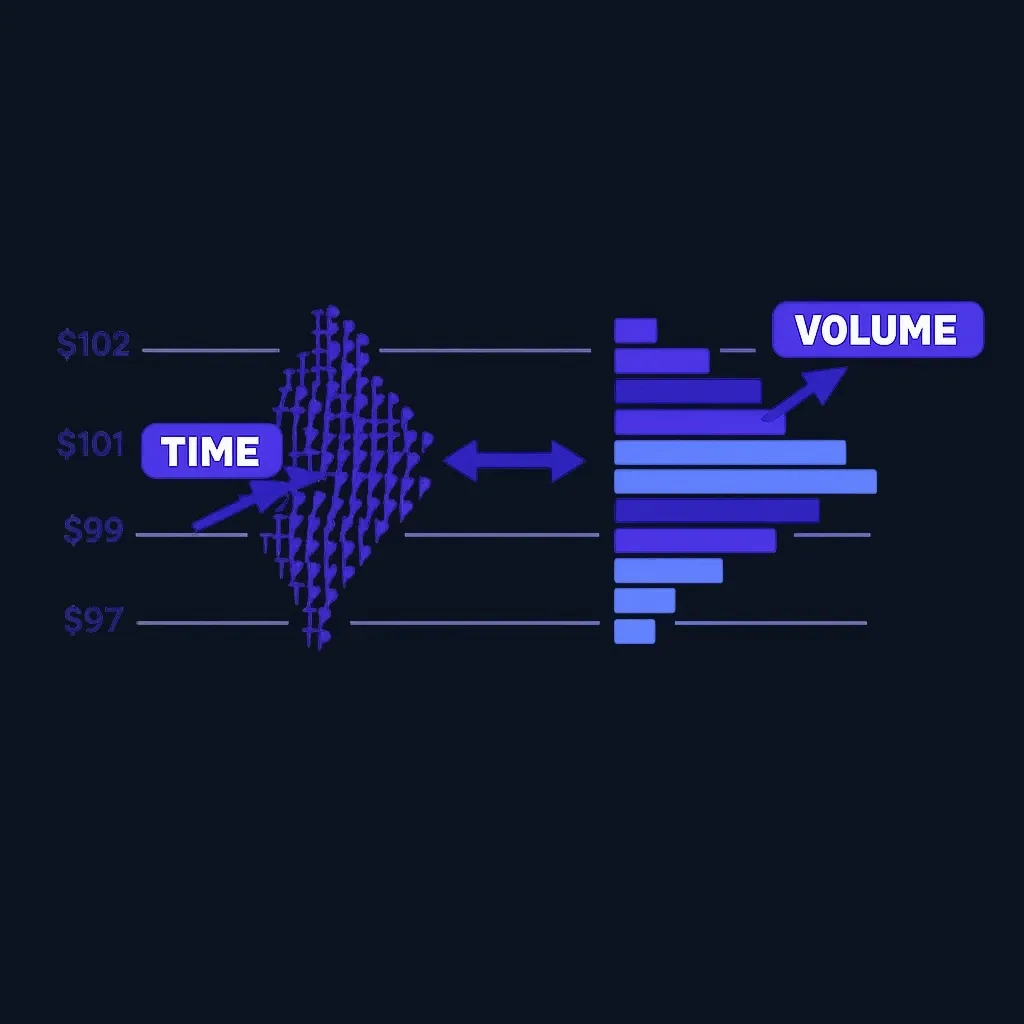
A standard volume histogram shows volume by time bar. Volume Profile rotates that idea: it aggregates volume into price buckets and displays the result horizontally beside the price scale.
Market Profile also creates a horizontal distribution, but its input is time-at-price rather than volume-at-price. Many implementations divide a session into fixed intervals and mark every price bucket visited during each interval. The resulting distribution is often called a TPO profile.
| Question | Volume Profile | Market Profile |
|---|---|---|
| Primary input | Recorded volume in each price bucket | Count of selected time intervals that included each price bucket |
| Main output | Volume-at-price distribution | Time-at-price distribution |
| Common reference | Highest-volume price bucket | Price bucket with the most TPOs |
| Main sensitivity | Data feed, aggregation method, and selected range | Session template, interval length, and selected range |
| What it does not show | Why the trades occurred or where price will go next | Actual volume unless volume is added separately |
How Volume Profile is constructed
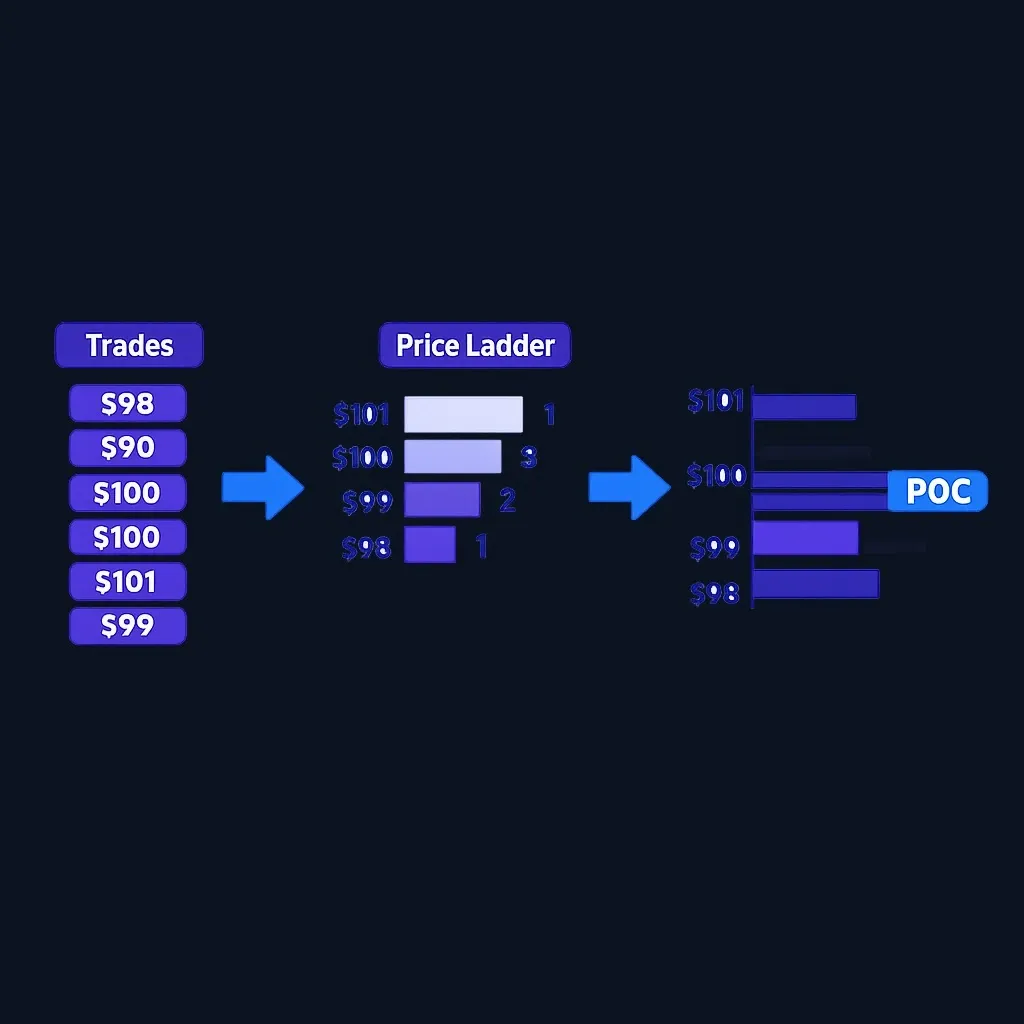
A platform starts with trades or volume reported for chart bars, assigns that activity to price buckets, and totals the volume in each bucket. The longest bar is the price bucket with the largest recorded volume for the selected period. Some platforms also calculate a “value area,” but the percentage, algorithm, and tie-breaking rules can vary.
Before interpreting a profile, verify:
- whether the feed includes exchange volume, tick volume, or another proxy;
- whether bar-level volume is distributed across prices or true trade-at-price data is used;
- whether regular and extended sessions are combined;
- the price-bucket size; and
- the start and end of the profiled range.
Changing any of these inputs can change the shape. A profile is therefore a description of a defined dataset—not a universal map of market liquidity.
How Market Profile is constructed
A TPO implementation divides a session into time intervals. If price trades within a bucket during an interval, the chart records one TPO for that bucket and interval. Repeated activity at a price creates a wider distribution.
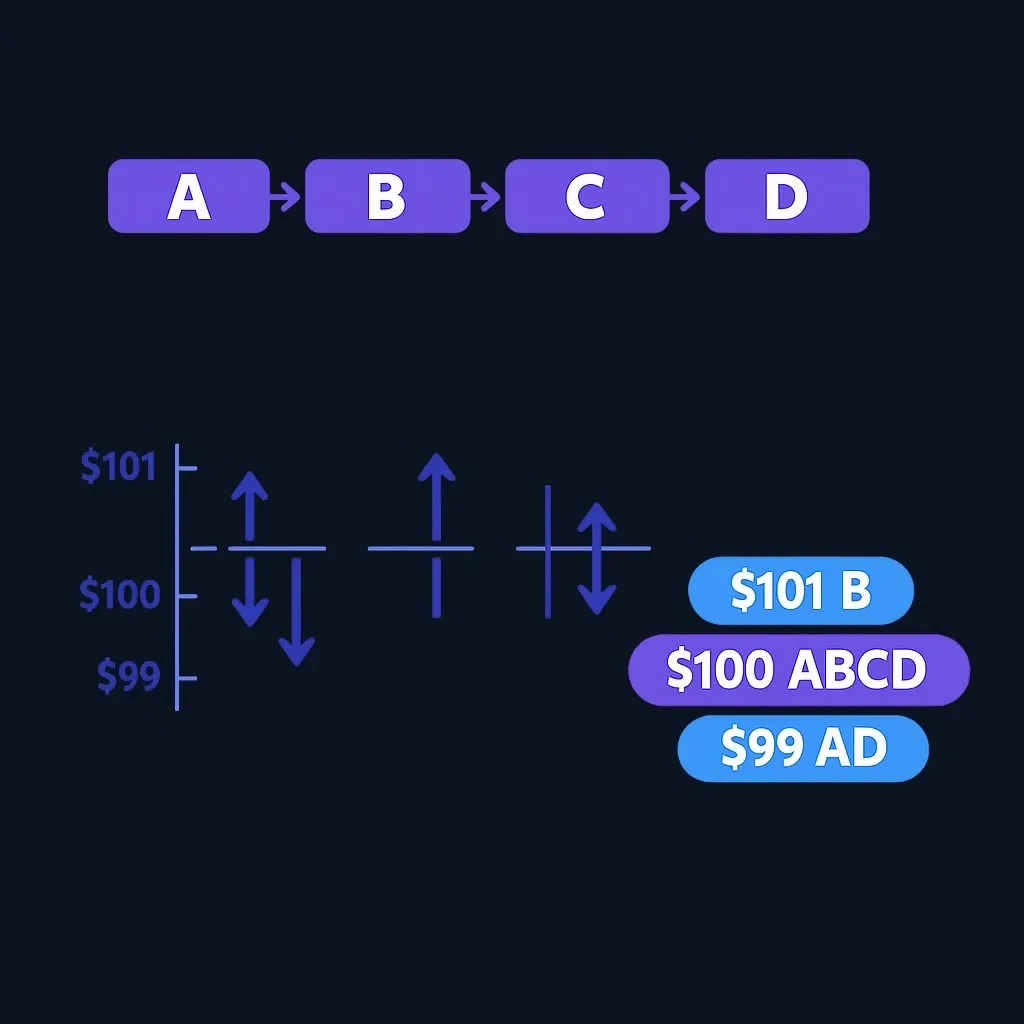
Key settings include:
- session start and end;
- interval length;
- price-bucket size;
- treatment of overnight trading; and
- whether sessions are displayed separately or combined.
Market Profile terminology is not perfectly standardized across charting platforms. Labels such as value area, initial balance, single print, and excess can depend on platform settings and a user's chosen methodology. Consult the documentation for the exact implementation rather than assuming two platforms calculate identical values.
How to compare the two responsibly
Use identical boundaries before drawing a comparison:
- Select the same instrument and data feed.
- Set the same date range and trading-session hours.
- Use comparable price-bucket sizes.
- Record whether the platform recalculates historical profiles after data corrections.
- Export or screenshot the settings so a later review is reproducible.
If one chart covers only regular hours and the other includes overnight activity, any apparent difference may come from the inputs rather than the method.
Practice trading with Finelo
Practice in a simulator, learn with bite-sized lessons, and build confidence before risking real money.
What each profile may help you examine
Volume Profile
Volume Profile may help describe where the selected feed recorded relatively high or low trading volume. Researchers can use those areas as variables in a broader study—for example, to test how often price revisited a high-volume area under a defined rule. That is not the same as assuming the area will act as support or resistance.
Market Profile
Market Profile may help describe how a session distributed time across prices. It can make a balanced or elongated session visually apparent, but those labels are descriptive. A profile does not identify the reason for the distribution or guarantee a continuation or reversal.
Using both
The charts can be viewed together because time concentration and volume concentration are not identical. If they disagree, inspect the settings and data before treating the difference as a signal. A useful research question is whether a rule based on one profile remains stable after changing the session template or bucket size.
Testing instead of assuming
A disciplined evaluation separates a chart observation from a trade rule:
- Write an objective definition, such as “previous session's highest-volume bucket.”
- Define entry, exit, position-size, and risk rules before examining the test result.
- Include commissions, spreads, slippage, and rejected or partial fills.
- Test on data that was not used to design the rule.
- Report losing periods, drawdowns, trade counts, and sensitivity to settings—not only the best outcome.
- Use simulation before risking capital.
Short-term trading can produce rapid and substantial losses. The SEC's investor education page, Day Trading: Your Dollars at Risk, explains that day trading is highly risky and that costs can materially affect results.
Common mistakes
- Treating a high-volume area as a prediction. It reports past recorded activity; it does not establish future demand or support.
- Calling Volume Profile a complete liquidity map. Displayed volume may omit activity or depend on the market and feed.
- Mixing session definitions. Regular-hours and full-session profiles can produce different distributions.
- Assuming every platform uses the same formula. Bucket allocation and value-area calculations may differ.
- Optimizing settings on the full dataset. Repeatedly adjusting boundaries until a chart fits past moves creates selection bias.
- Ignoring transaction costs. A visually convincing short-term rule can become unprofitable after realistic costs.
FAQ
Is Market Profile the same as Volume Profile?
No. Market Profile commonly counts time intervals at each price, while Volume Profile aggregates recorded volume at each price.
Which profile is more accurate?
Accuracy depends on the question. Volume Profile is appropriate for describing the volume data provided to it. Market Profile is appropriate for describing time-at-price under its session and interval rules. Neither is inherently a more accurate forecast.
What is a point of control?
The phrase usually refers to the largest bucket in a profile. In a Volume Profile it is typically the highest-volume bucket; in a TPO profile it may mean the bucket with the most TPOs. Confirm the platform's definition.
Can these profiles be used for long-term investing?
They can describe historical distributions over longer ranges, but they do not replace analysis of objectives, valuation, diversification, costs, and risk. Their usefulness should be tested for the specific horizon and decision.
Conclusion
Volume Profile summarizes recorded volume by price; Market Profile summarizes time by price. The safest way to use either is to document the exact data and settings, treat the output as descriptive, and validate any resulting rule with out-of-sample testing and realistic costs. Do not infer certainty from the visual shape of a profile.
For more educational explanations of markets and trading methods, visit the Finelo Blog.
TradingFinancial Education
Practice trading with Finelo
Practice in a simulator, learn with bite-sized lessons, and build confidence before risking real money.
About the author
Finelo Team
The Finelo Team creates practical investing and trading education designed to help beginners learn faster with structured challenges, simulator practice, and bite-sized lessons.
Keep reading — Related articles

Trading
Understanding Walk Forward Analysis in Trading
Brief educational note: this article is educational — not investment advice — and trading involves the risk of loss.
Finelo Team
Trading
VWAP vs Moving Average: Formulas, Uses, and Limits
VWAP weights price by recorded volume over a defined period, while a moving average summarizes a sequence of prices over a rolling lookback.
Finelo Team
Trading
Treynor Ratio vs. Sharpe Ratio: A Detailed Comparison
The Treynor and Sharpe ratios both compare excess return with a measure of risk, but they use different denominators.
Finelo Team


