For U.S. readers: This article discusses U.S. rules and financial products. State rules and individual eligibility may differ.
Treynor Ratio vs. Sharpe Ratio: A Detailed Comparison
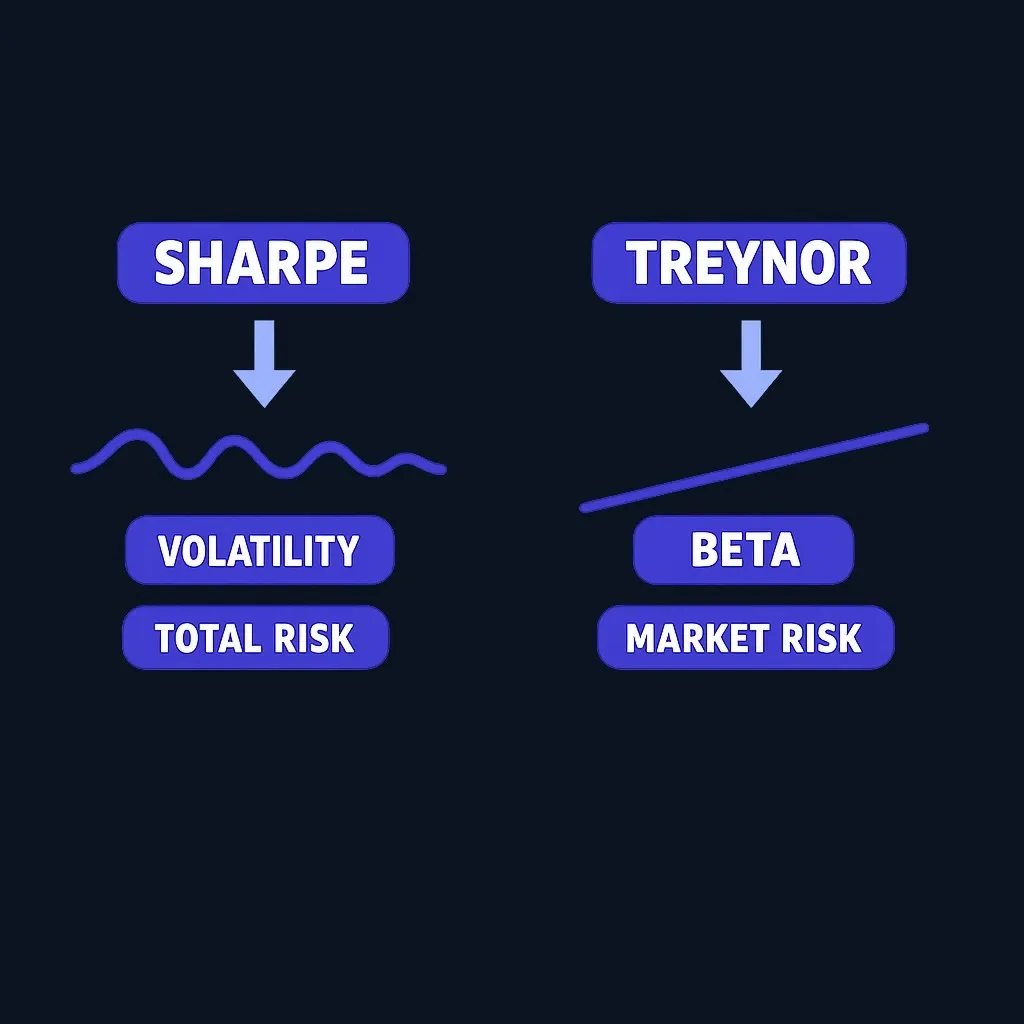
The Treynor and Sharpe ratios both compare excess return with a measure of risk, but they use different denominators.
7 min read
Practice trading with Finelo
Practice in a simulator, learn with bite-sized lessons, and build confidence before risking real money.
Want to learn more?
Practice in a simulator, learn with bite-sized lessons, and build confidence before risking real money.
Explore FineloExplore Finelo's 28-day challenges
Turn learning into a daily habit with guided challenge paths.
Quick answer
The Treynor and Sharpe ratios both compare excess return with a measure of risk, but they use different denominators. Sharpe uses total volatility (standard deviation); Treynor uses systematic risk (beta). Their outputs are not interchangeable, and neither ratio proves that a portfolio is suitable or will perform similarly in the future. Finelo provides financial education, not financial or investment advice.
Quick comparison answer
The shortest practical answer: Sharpe = (return − risk-free rate) / standard deviation, so it uses total volatility; Treynor = (return − risk-free rate) / beta, so it uses market (systematic) risk. CFA Institute discusses these measures within the broader topic of risk-adjusted performance. Downside-focused measures such as Sortino answer a different question and should not be treated as interchangeable.
What is the Sharpe Ratio?
The Sharpe ratio expresses how much excess return a portfolio generates per unit of total risk (volatility). Algebraically:
- Sharpe = (Rp − Rf) / σp
- Rp = portfolio return
- Rf = risk‑free rate
- σp = standard deviation of portfolio returns
Interpretation: a higher Sharpe indicates more excess return per unit of total volatility. The Sharpe ratio is a fundamental risk‑adjusted performance measure and is routinely used in performance assessment (CFA Institute).
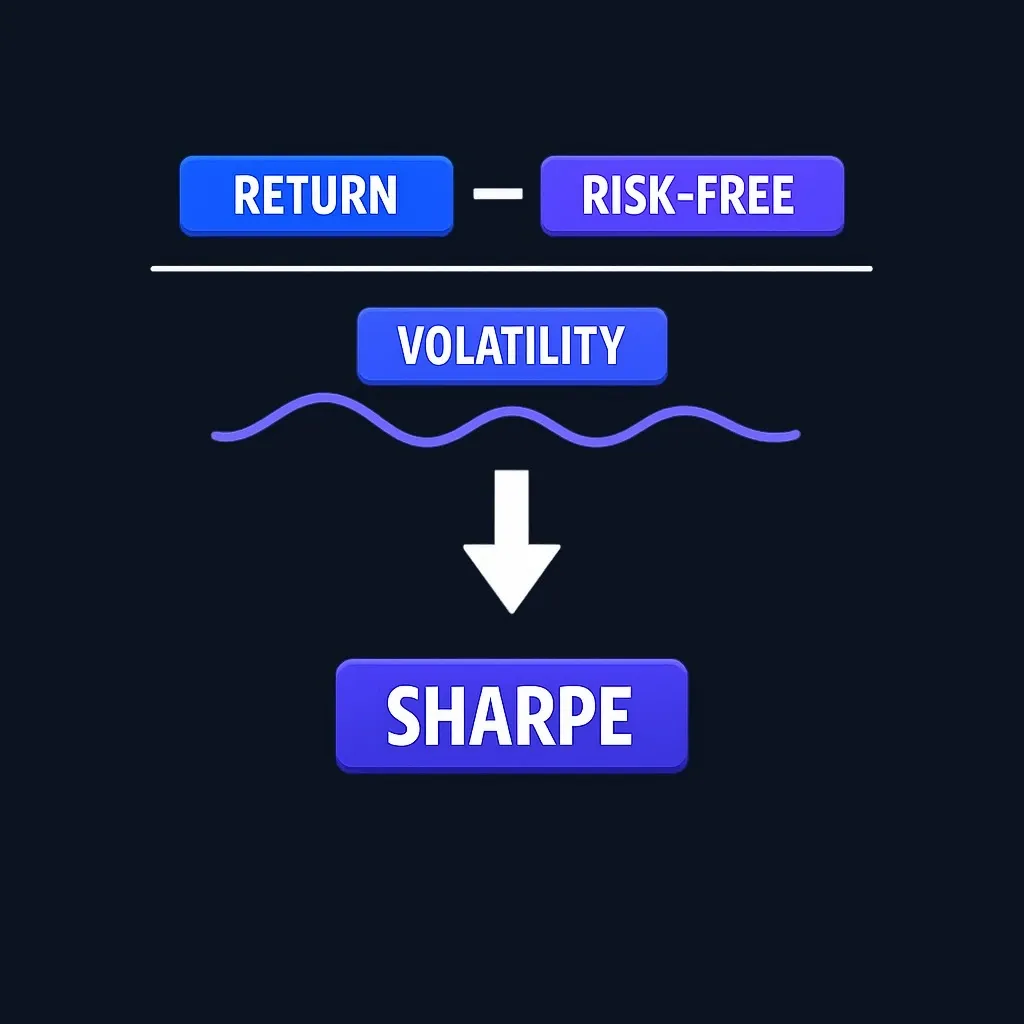
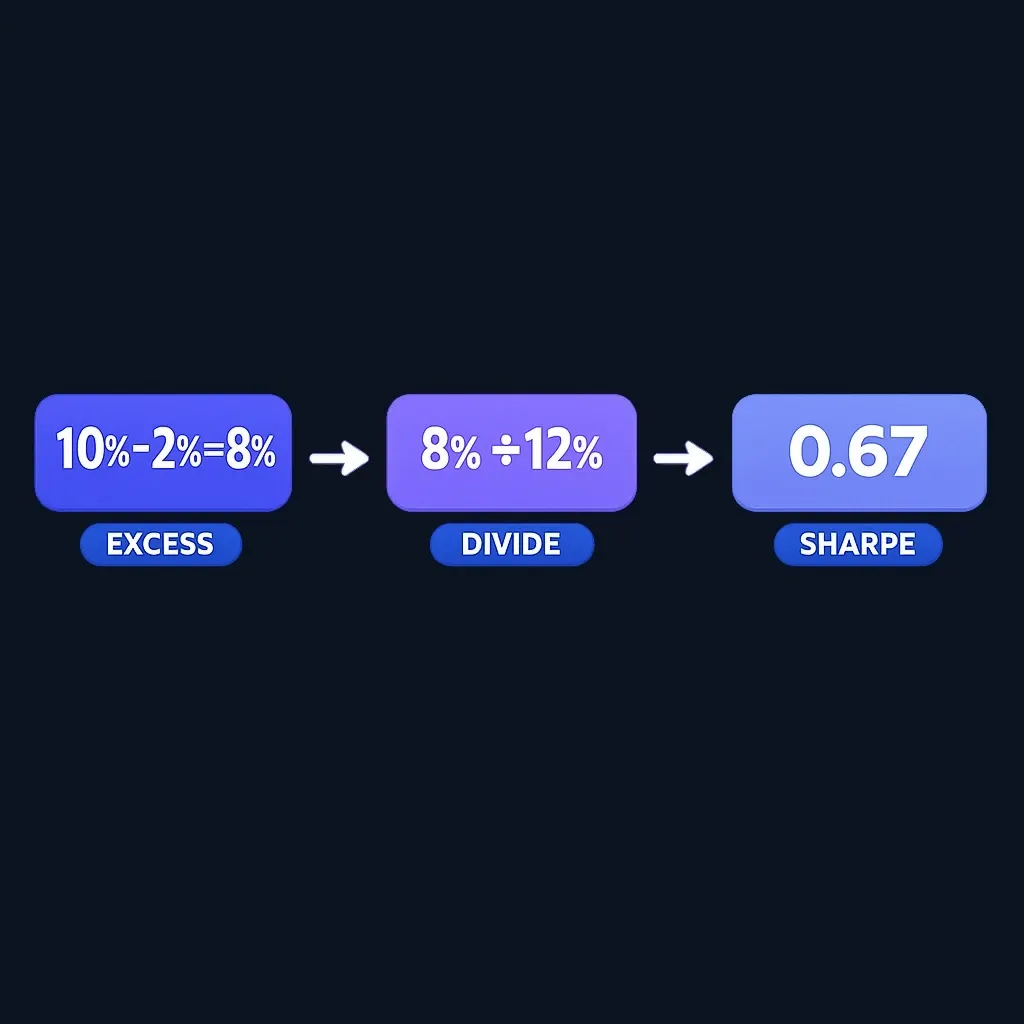
Worked example (illustrative): if a portfolio returns 10% (Rp), the risk‑free rate is 2% (Rf), and the portfolio standard deviation is 12% (σp), then Sharpe = (0.10 − 0.02) / 0.12 ≈ 0.67. That number means the portfolio earned 0.67 units of excess return per unit of total risk. Use algebraic form or a spreadsheet to plug your own returns and standard deviation; the math is straightforward.
Practical implication: because the Sharpe uses total volatility, it treats upside and downside variation the same. That makes it useful when comparing across asset classes or when a portfolio is not fully diversified.
(Definition and explanation adapted for classroom use; see Finelo for related educational materials: Finelo Blog.)
What is the Treynor Ratio?
The Treynor ratio measures excess return per unit of systematic risk — the risk attributable to market movements — using beta as the denominator. Algebraically:
- Treynor = (Rp − Rf) / βp
- βp = portfolio beta versus a chosen market benchmark
Interpretation: a higher Treynor ratio means more excess return per unit of market (systematic) risk. Because beta depends on the chosen benchmark and on historical covariances, Treynor is most meaningful when the portfolio is compared to an appropriate index and when unsystematic (idiosyncratic) risk is small.
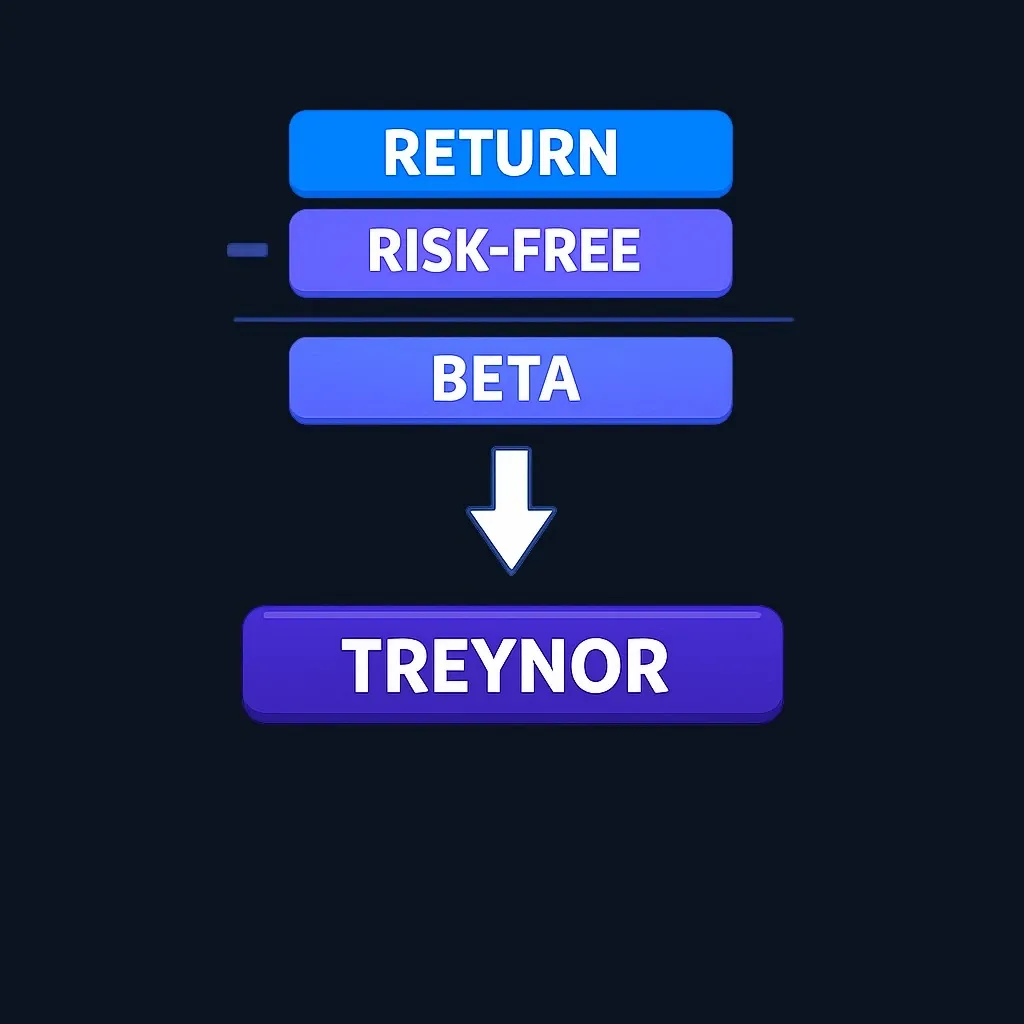
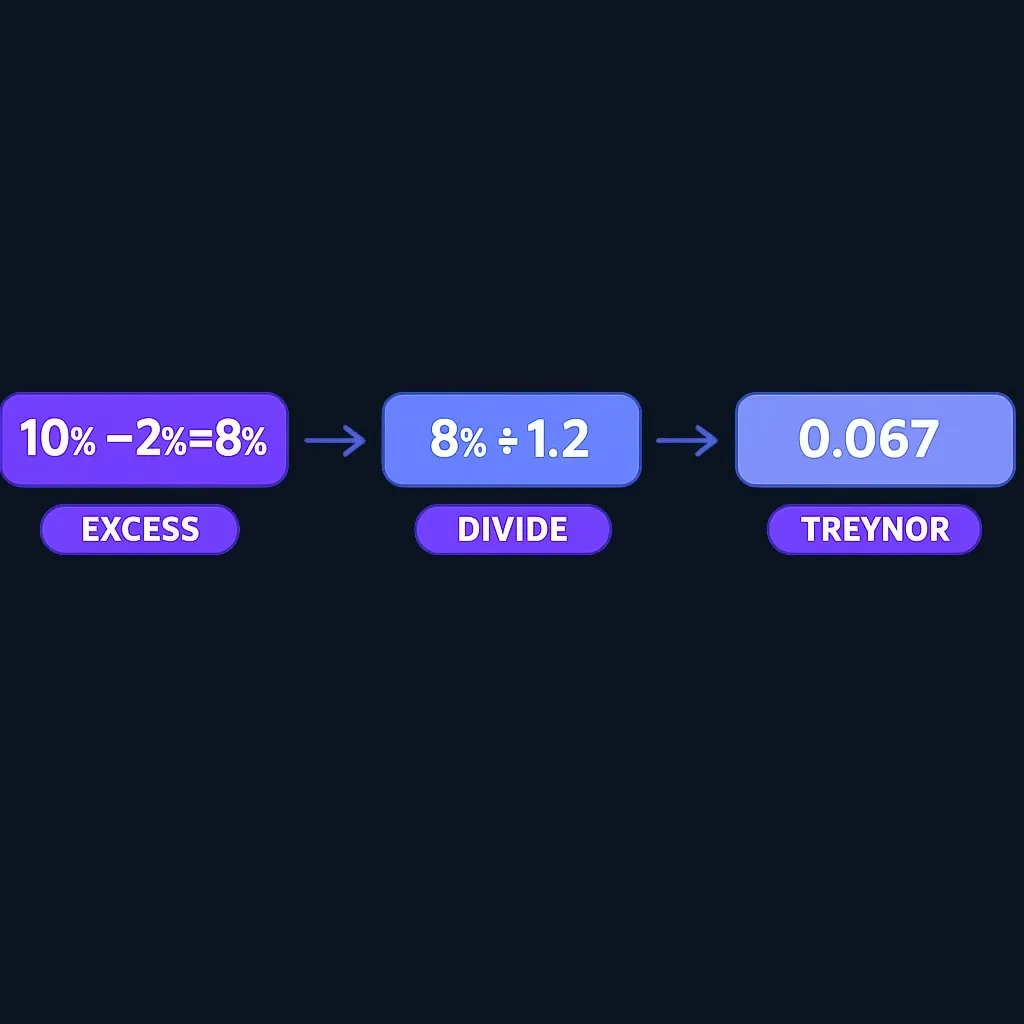
Worked example (illustrative): with Rp = 10%, Rf = 2%, and βp = 1.2, Treynor = (0.10 − 0.02) / 1.2 ≈ 0.067 (or 6.7% of excess return per unit of beta). Use the same benchmark and beta timeframe across funds when comparing managers.
(Definition and explanation adapted for classroom use; see Finelo for related educational materials: Finelo Blog.)
Practice trading with Finelo
Practice in a simulator, learn with bite-sized lessons, and build confidence before risking real money.
Side-by-side comparison table
| Feature | Sharpe ratio | Treynor ratio |
|---|---|---|
| Risk measured | Total volatility (standard deviation) | Systematic risk (beta) |
| Formula | (Rp − Rf) / σp | (Rp − Rf) / βp |
| Best for | Comparing across asset classes or undiversified portfolios | Comparing well‑diversified portfolios or manager performance vs. benchmark |
| Assumption about diversification | No need to assume full diversification | Assumes unsystematic risk is negligible (diversified portfolio) |
| Benchmark dependence | Independent of a market benchmark | Depends on chosen market benchmark (beta) |
| Penalizes upside volatility? | Yes | No (only market sensitivity matters) |
Notes: the Sharpe ratio's role among classic risk-adjusted measures is documented by CFA Institute. For practical comparisons, keep the risk-free rate, return window, benchmark, and data frequency consistent across calculations.
Decision criteria
Use this checklist to choose which metric fits your objective:
- Diversification: if the portfolio is not well diversified (single stock, concentrated sector), prefer Sharpe; if it is broadly diversified, Treynor isolates market risk better.
- Benchmarking goal: if you are evaluating a manager relative to a market index, Treynor’s beta‑based approach is a natural fit; if you want apples‑to‑apples comparisons across different markets or asset classes, Sharpe is simpler.
- Sensitivity you care about: choose Sharpe when total volatility (both upside and downside) matters; choose Treynor when you care about exposure to market swings only.
- Data quality: Treynor requires a reliable beta estimate against an appropriate benchmark; if beta is unstable or the benchmark is unclear, Sharpe is more robust.
- Investment horizon and frequency: match the return and risk measurement frequencies (monthly, annualized, etc.) across all candidates before comparing ratios.
Educational note: this content is educational, not financial or investment advice. Investing carries the risk of loss; use these metrics as part of a broader evaluation that includes fees, constraints, and your objectives.
When to choose each option
Sharpe is preferable when:
- You compare funds that differ in asset class (e.g., equity fund vs. bond fund).
- Your portfolio may be concentrated or you want a single‑number view of total variability.
- Beta is unreliable or no clear benchmark exists.
Treynor is preferable when:
- You evaluate professional managers who run broadly diversified portfolios.
- You want to know how much extra return a manager earns per unit of market exposure.
- You compare funds that share the same benchmark (so beta is comparable).
Practical scenarios:
- Individual investor comparing a single mutual fund against cash and bonds: compute Sharpe to weigh total volatility alongside return.
- Institutional allocator comparing two diversified equity managers tracking the same index: compute Treynor to isolate performance per unit of market risk.
- When both perspectives are useful, report both ratios side‑by‑side and explain the differences in interpretation to stakeholders.
Tradeoffs and caveats
Key limitations to keep in mind:
- Sharpe treats upside and downside volatility equally. A downside-focused metric such as Sortino changes the denominator and answers a different risk question; define the calculation consistently before comparing results.
- Treynor depends on beta and the chosen benchmark. A mis‑specified benchmark or unstable beta distorts Treynor comparisons; ensure consistent benchmark selection and look at beta stability across the same window and frequency.
- Both ratios are backward‑looking. They summarize historical performance and risk; they do not guarantee future outcomes. Use them alongside forward‑looking analysis and qualitative assessment.
- Units and scaling: Sharpe values are unitless (excess return per standard deviation) but often quoted on annualized inputs; Treynor values depend on how beta is computed (matching periodicity matters). Always report how returns, risk‑free rates, and risk measures were annualized.
- Small portfolios and short time windows produce noisy standard deviation and beta estimates. Larger samples and consistent data frequency improve reliability.
Avoid common mistakes:
- Comparing Treynor across funds with different benchmarks.
- Using mismatched return windows or mixing daily volatility with monthly returns without proper annualization.
- Relying on a single ratio to make a hire/fire or allocation decision; ratios are summary statistics, not verdicts.
FAQs
What is the difference between the Sharpe and Treynor ratios?
Sharpe measures excess return per unit of total volatility (standard deviation); Treynor measures excess return per unit of market risk (beta). Sharpe is benchmark‑agnostic and suits cross‑asset comparisons; Treynor assumes a diversified portfolio and requires a benchmark to compute beta (CFA Institute).
When should I use the Sharpe ratio?
Use Sharpe when comparing investments across asset classes or when the portfolio may not be well diversified. Sharpe summarizes total risk and is useful when no single market benchmark applies.
When should I use the Treynor ratio?
Use Treynor when evaluating broadly diversified portfolios or fund managers measured against the same market index, because Treynor isolates systematic risk through beta.
What are the limitations of each ratio?
Sharpe penalizes upside volatility and can be distorted by non‑normal return distributions; Treynor depends on a reliable beta and appropriate benchmark. Both are historical measures and should be combined with other analysis and context.
To compare the ratios in a spreadsheet, create clearly labeled cells for return, risk-free rate, standard deviation, and beta, then apply the formulas shown above. Finelo does not currently provide a separate downloadable calculator for this article.
TradingFinancial Education
Practice trading with Finelo
Practice in a simulator, learn with bite-sized lessons, and build confidence before risking real money.
About the author
Finelo Team
The Finelo Team creates practical investing and trading education designed to help beginners learn faster with structured challenges, simulator practice, and bite-sized lessons.
Keep reading — Related articles

Trading
Understanding Walk Forward Analysis in Trading
Brief educational note: this article is educational — not investment advice — and trading involves the risk of loss.
Finelo Team

Trading
VWAP vs Moving Average: Formulas, Uses, and Limits
VWAP weights price by recorded volume over a defined period, while a moving average summarizes a sequence of prices over a rolling lookback.
Finelo Team
Trading
Volume Profile vs Market Profile: What Each Chart Measures
Volume Profile groups traded volume by price level.
Finelo Team


