For U.S. readers: This article discusses U.S. rules and financial products. State rules and individual eligibility may differ.
VWAP vs Moving Average: Formulas, Uses, and Limits
VWAP weights price by recorded volume over a defined period, while a moving average summarizes a sequence of prices over a rolling lookback.
6 min read
Practice trading with Finelo
Practice in a simulator, learn with bite-sized lessons, and build confidence before risking real money.
Want to learn more?
Practice in a simulator, learn with bite-sized lessons, and build confidence before risking real money.
Explore FineloExplore Finelo's 28-day challenges
Turn learning into a daily habit with guided challenge paths.
Quick answer
VWAP weights price by recorded volume over a defined period, while a moving average summarizes a sequence of prices over a rolling lookback. VWAP is often used as an execution or session benchmark; moving averages are commonly used to smooth price and describe trend. Neither line predicts returns, and results depend on the data, calculation settings, and trading costs. Finelo provides financial education, not financial or investment advice.
The formulas
For bars indexed from 1 through t, a common bar-based approximation is:
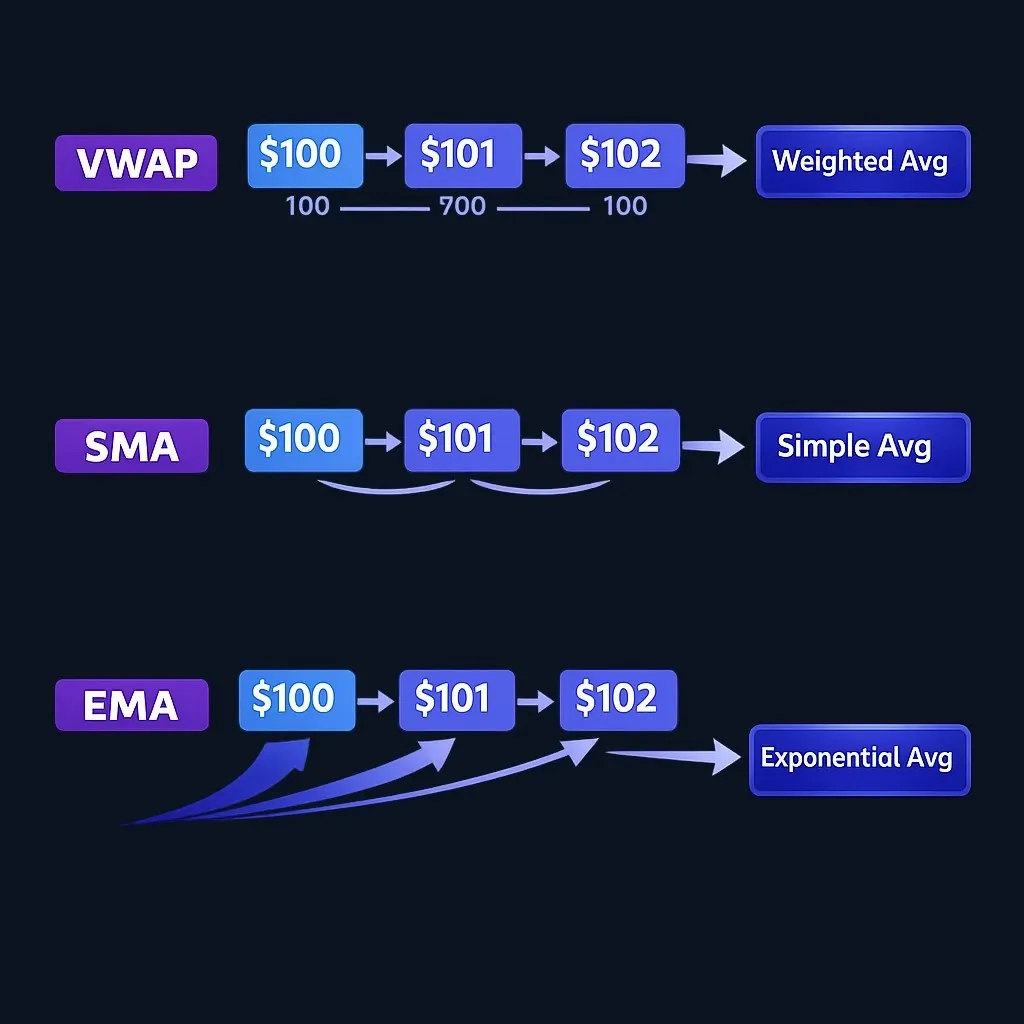
VWAP(t) = Σ(Price(i) × Volume(i)) ÷ ΣVolume(i)
The chosen price may be the trade price, close, or a typical price such as (high + low + close) ÷ 3. A platform that uses aggregated bars can therefore differ from one using every trade.
A simple moving average over n observations is:
SMA(t) = ΣPrice(i) ÷ n
An exponential moving average gives more weight to recent observations. Its exact recursive formula depends on the chosen smoothing factor, commonly derived from the lookback length.
What changes the result
VWAP inputs
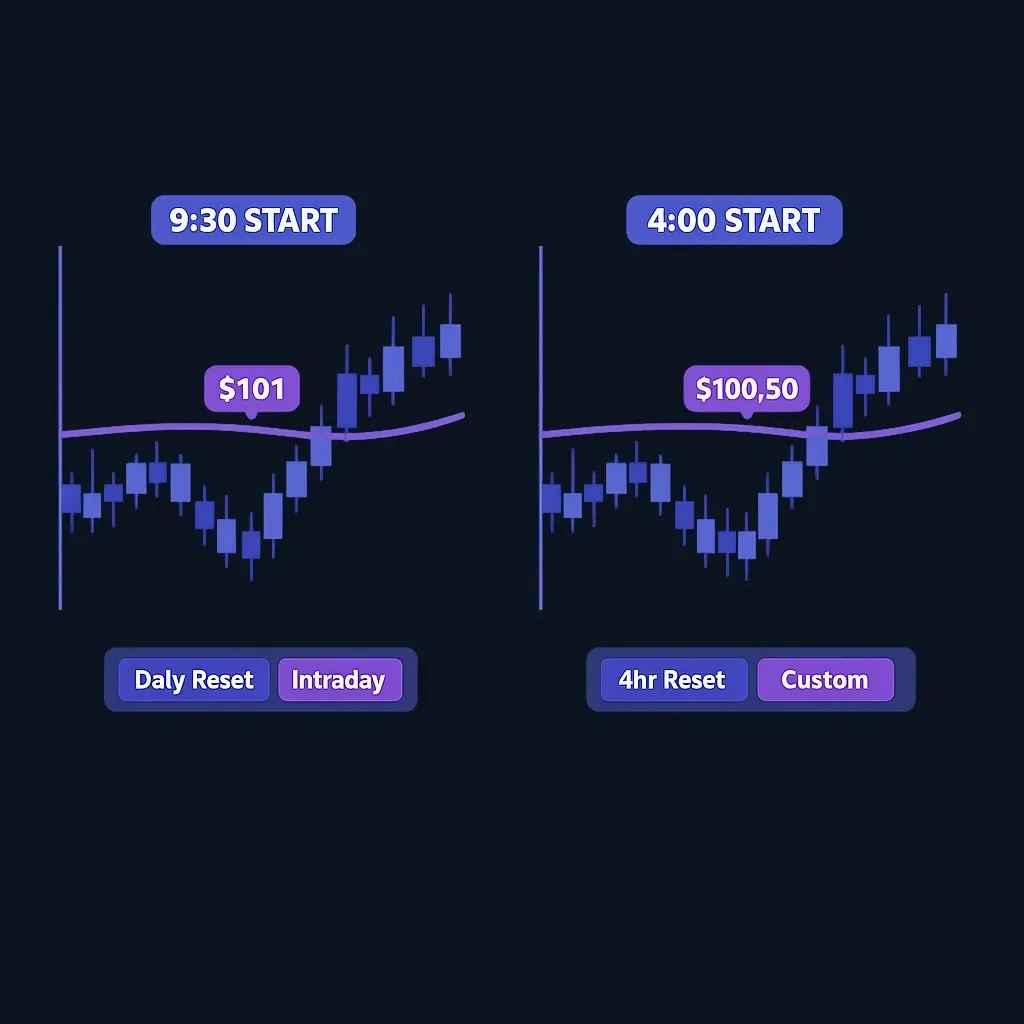
- start and reset time;
- trade-level versus bar-level data;
- regular-hours versus extended-hours volume;
- the price input used for each bar; and
- corrections or omissions in the volume feed.
Moving-average inputs
- price field, such as close or typical price;
- average type, such as simple or exponential;
- lookback length;
- chart timeframe; and
- treatment of missing observations or corporate-action adjustments.
Two charts displaying “VWAP” or “20-day EMA” can therefore differ if their inputs or implementation differ.
Side-by-side comparison
| Attribute | VWAP | Moving average |
|---|---|---|
| Weighting | Price weighted by recorded volume | Price weighted equally for SMA or by a chosen decay for EMA |
| Window | Often cumulative from a defined reset point | Usually rolling over a selected number of observations |
| Common use | Execution benchmark or session reference | Price smoothing and trend description |
| Volume sensitivity | Direct | None unless volume is added separately |
| Main implementation risk | Feed quality and reset rules | Lookback selection and lag |
| Predictive guarantee | None | None |
CME Group notes that certain market fixing prices are calculated from a volume-weighted average price during a defined window. That is an example of VWAP as a transparent benchmark calculation—not evidence that trading above or below VWAP predicts the next move.
Interpreting VWAP carefully
If current price is above VWAP, it means the current price is above the volume-weighted average calculated from the selected data and reset point. It does not by itself mean the asset is undervalued, overvalued, bullish, or likely to continue higher.
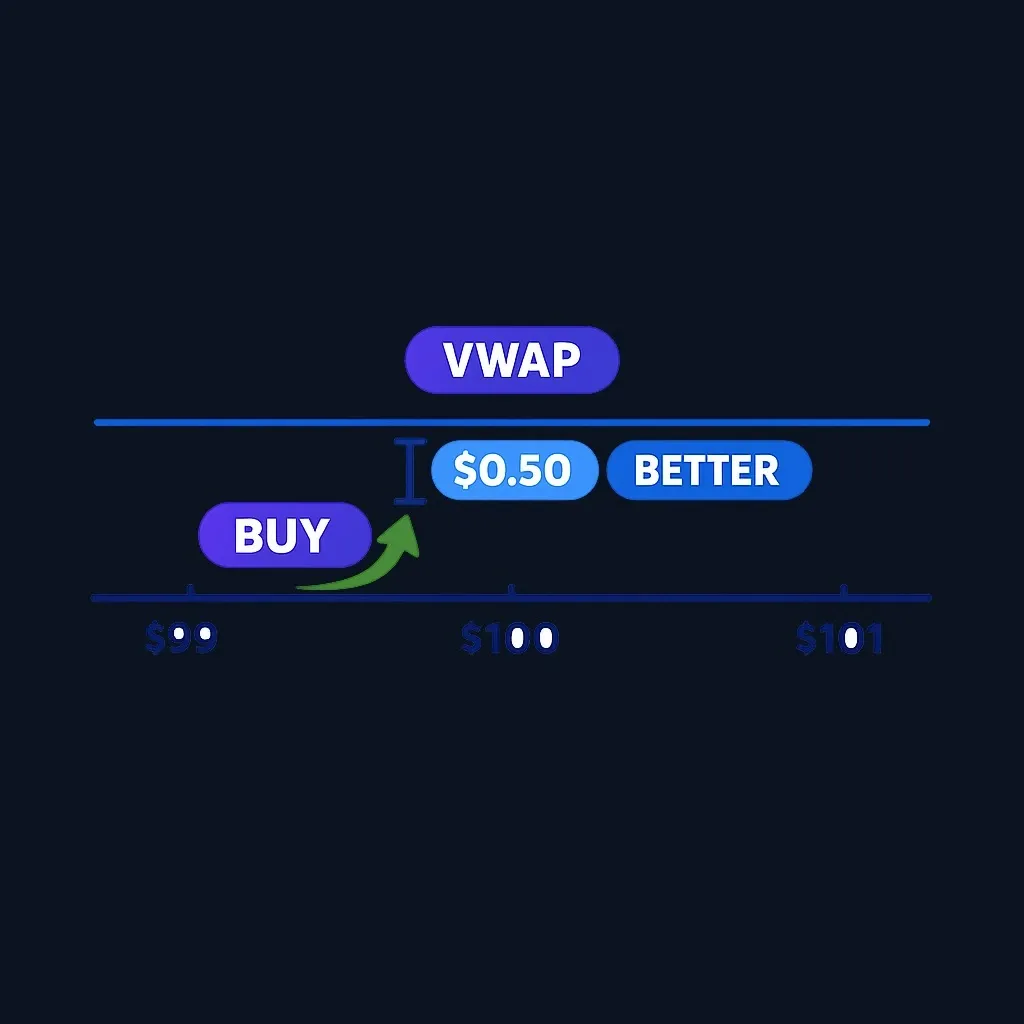
VWAP can help evaluate a fill relative to the benchmark. For example, a buy executed below the same correctly calculated benchmark has a lower execution price than that benchmark. Whether the trade was economically good still depends on subsequent prices, opportunity cost, market impact, fees, and the investor's objective.
Practice trading with Finelo
Practice in a simulator, learn with bite-sized lessons, and build confidence before risking real money.
Interpreting moving averages carefully
A moving average smooths past prices. A short lookback usually reacts faster but is noisier; a long lookback is smoother but lags more. A crossover simply records a relationship between calculated averages. It does not establish that a new trend will persist.
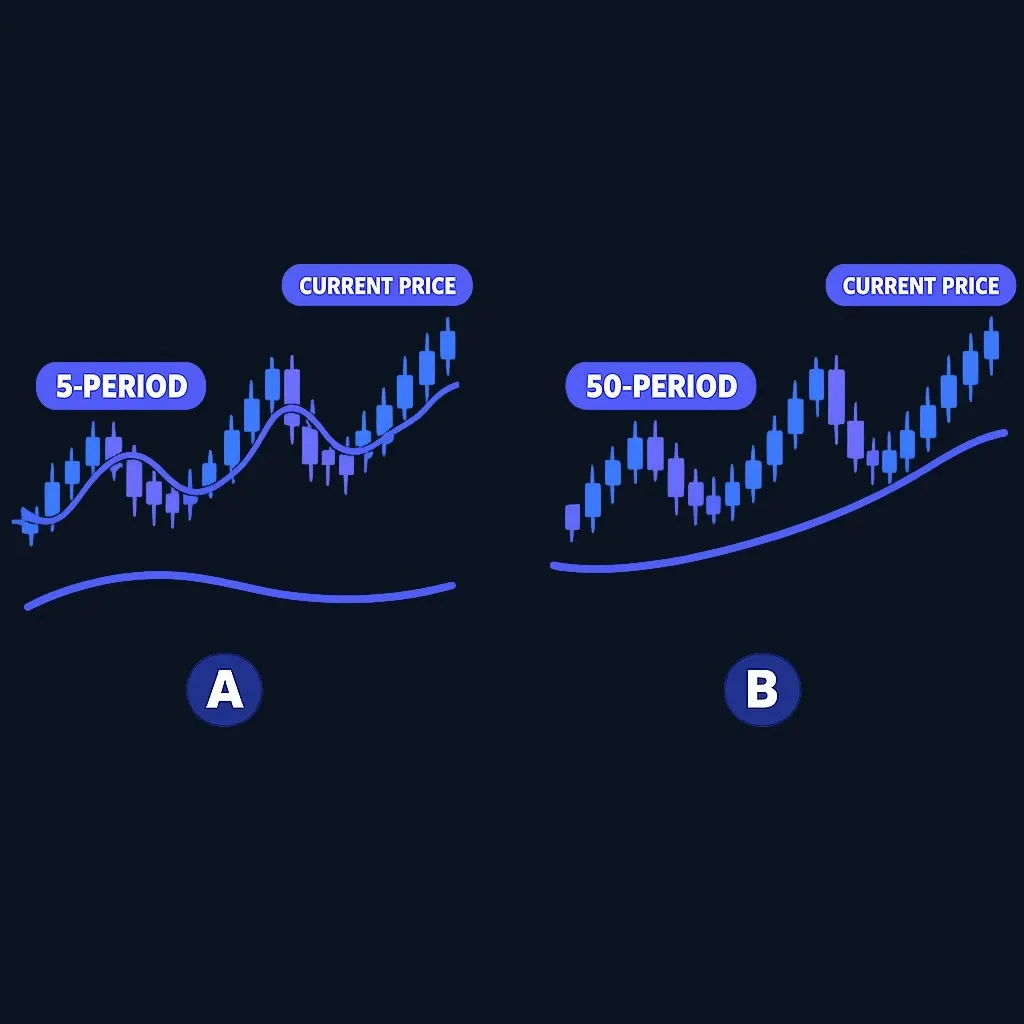
Changing the lookback after observing results can create selection bias. A credible evaluation states the rule in advance and tests it on data that was not used to choose the parameters.
A research framework for comparing them
Instead of asking which indicator is “better,” define a measurable task:
- State the purpose. Is the line an execution benchmark, a trend filter, or an entry condition?
- Lock the formula. Record the price input, timeframe, reset rule, lookback, and session hours.
- Define the decision rule. Avoid vague statements such as “buy when strong.”
- Model implementation. Include commissions, bid-ask spread, slippage, delay, and partial fills.
- Separate design and evaluation data. Do not use the same period both to tune and judge the rule.
- Run sensitivity checks. A small change in lookback or reset time should not completely reverse a supposedly robust conclusion.
- Report the full result. Include losses, drawdown, turnover, and the number of observations.
Worked illustration
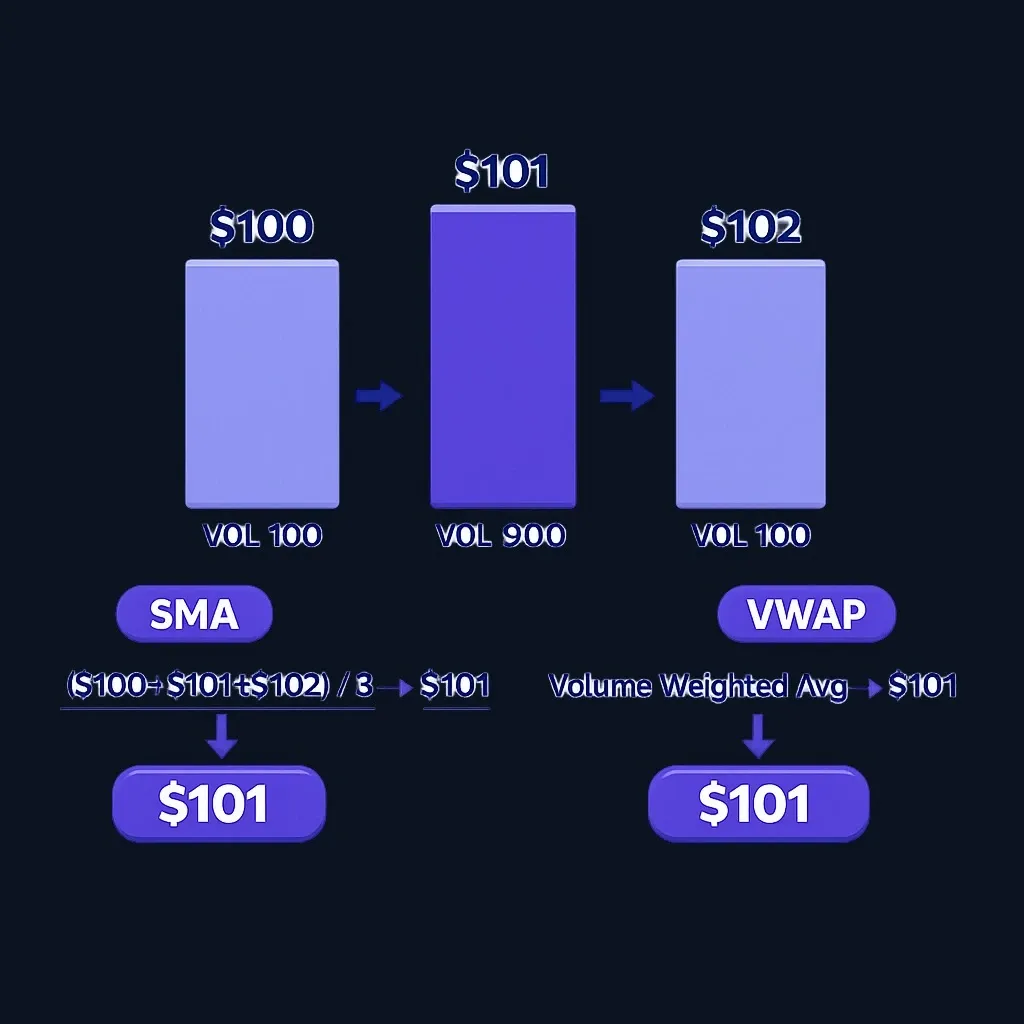
Assume three bars have representative prices of $100, $101, and $102, with volumes of 100, 900, and 100 units.
- Three-bar SMA = ($100 + $101 + $102) ÷ 3 = $101.
- Bar-based VWAP = (($100 × 100) + ($101 × 900) + ($102 × 100)) ÷ 1,100 = $101.
In this symmetric example they are equal. If the high-volume bar occurred at a different price, VWAP would move toward that bar while the SMA would not. The illustration explains the weighting difference; it is not a trading recommendation.
Common mistakes
- Assuming above VWAP means “buy.” It only describes price relative to the selected benchmark.
- Forgetting the reset. A session VWAP and an anchored VWAP measure different windows.
- Using incomplete volume. Some markets or feeds do not provide comparable consolidated volume.
- Treating a moving average as support or resistance by definition. That behavior must be tested, not assumed.
- Optimizing until a backtest looks attractive. Trying many settings increases the chance of a result caused by noise.
- Ignoring costs and risk. Short-horizon strategies can generate high turnover and substantial losses.
The SEC warns that day trading is highly risky and that expenses can materially affect whether a strategy is profitable. See Day Trading: Your Dollars at Risk.
FAQ
Does VWAP reset every day?
Many charting platforms default to a session reset, but anchored and other VWAP variants use different starting points. Check the platform's exact setting.
Is VWAP a moving average?
Both are averages, but the weighting and window differ. VWAP weights by volume, while a conventional moving average weights price observations equally or by recency.
Is an EMA better than an SMA?
Neither is universally better. An EMA responds faster to recent changes, while an SMA is simpler and smoother. Suitability depends on the defined task and verified results.
Can VWAP and a moving average be used together?
They can be compared in a research model, but adding indicators does not automatically improve performance. The combined rule still needs independent testing and risk controls.
Conclusion
VWAP is principally a volume-weighted benchmark; a moving average is a price-smoothing calculation. Use transparent formulas, lock the settings before testing, and treat chart relationships as hypotheses rather than predictions. No indicator removes market, execution, or loss risk.
For more educational material about trading methods and risk, visit the Finelo Blog.
TradingFinancial Education
Practice trading with Finelo
Practice in a simulator, learn with bite-sized lessons, and build confidence before risking real money.
About the author
Finelo Team
The Finelo Team creates practical investing and trading education designed to help beginners learn faster with structured challenges, simulator practice, and bite-sized lessons.
Keep reading — Related articles

Trading
Understanding Walk Forward Analysis in Trading
Brief educational note: this article is educational — not investment advice — and trading involves the risk of loss.
Finelo Team
Trading
Volume Profile vs Market Profile: What Each Chart Measures
Volume Profile groups traded volume by price level.
Finelo Team
Trading
Treynor Ratio vs. Sharpe Ratio: A Detailed Comparison
The Treynor and Sharpe ratios both compare excess return with a measure of risk, but they use different denominators.
Finelo Team


