For U.S. readers: This article discusses U.S. rules and financial products. State rules and individual eligibility may differ.
Understanding Walk Forward Analysis in Trading
Brief educational note: this article is educational — not investment advice — and trading involves the risk of loss.
7 min read
Practice trading with Finelo
Practice in a simulator, learn with bite-sized lessons, and build confidence before risking real money.
Want to learn more?
Practice in a simulator, learn with bite-sized lessons, and build confidence before risking real money.
Explore FineloExplore Finelo's 28-day challenges
Turn learning into a daily habit with guided challenge paths.
Quick answer
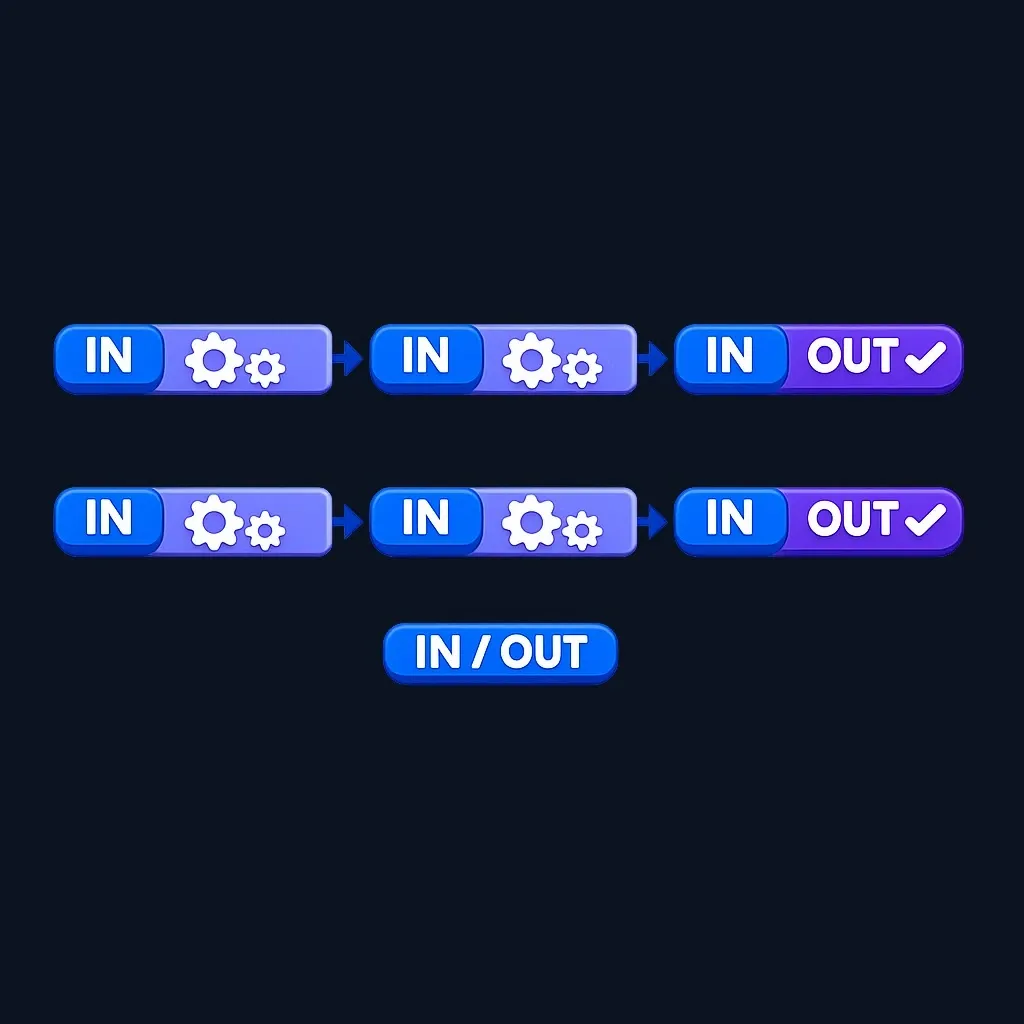
Walk forward analysis (also called walk‑forward optimization, WFO) is a rolling process that repeatedly optimizes strategy parameters on a trailing “in‑sample” window and then tests them immediately forward on the next “out‑of‑sample” window to estimate how the strategy adapts to new data a published overview of walk-forward analysis. Finelo provides financial education, not financial or investment advice.
Brief educational note: this article is educational — not investment advice — and trading involves the risk of loss.
What to know before deciding
Who this helps and what you can evaluate
Walk‑forward approaches are most useful when you want a more realistic check of a strategy’s ability to adapt to changing market conditions than a single, fixed backtest can provide. After reading this page you should be able to:
- Describe the walk‑forward cycle and how it differs from a single backtest.
- Build a simple rolling WFO plan for a strategy and spot common overfitting traps.
- Judge whether WFO adds value for your time horizon, data length, and re‑optimization cadence.
Key assumptions and limits to consider
Using WFO assumes you have enough historical data to split into repeated in‑sample and out‑of‑sample windows. It also assumes that re‑optimizing on recent data is a reasonable proxy for how you would adapt a live strategy. WFO is not a guarantee of future performance; it is a robustness check that attempts to approximate live adaptation, not to predict returns.
Decision framework
This section explains how WFO works, gives a compact step plan you can adapt, compares it to traditional backtesting, and highlights practical choices you must make.
How the walk‑forward cycle works (mechanics)
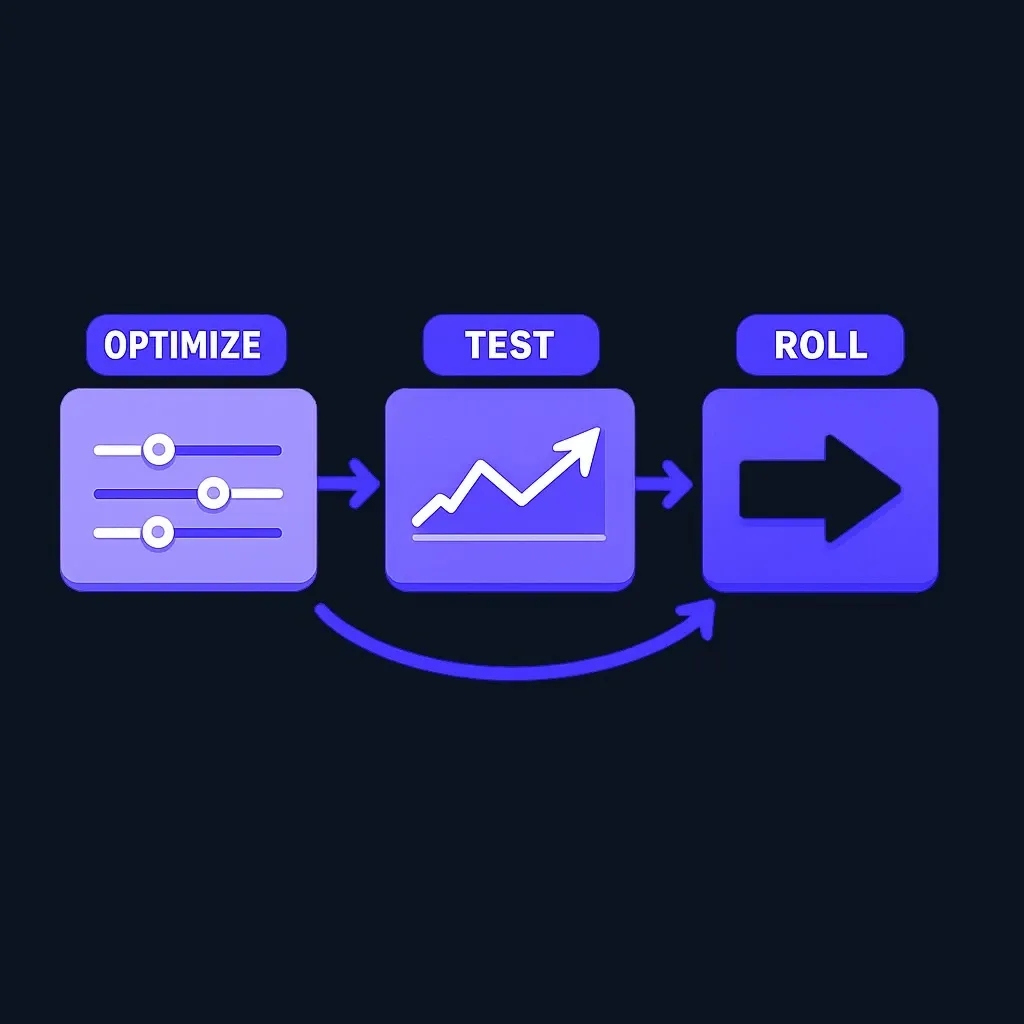
At each cycle you:
- Select an in‑sample (IS) window of past data and optimize the strategy parameters to maximize a chosen objective (for example, Sharpe, net profit, or a custom metric).
- Freeze the optimized parameters and run the strategy on the immediately following out‑of‑sample (OOS) window to test real‑time performance.
- Record OOS metrics and then roll the windows forward (for example, move both IS and OOS forward by the OOS length or by a fixed step) and repeat the process.
This rolling re‑optimization simulates how you would periodically re‑tune a live system with newly available data.
Step‑by‑step implementation (practical framework)
Use this actionable framework as a template you can adapt to your markets and timeframes.
- Define objective and constraints: pick the metric you’ll optimize (e.g., risk‑adjusted return) and realistic constraints (max position size, slippage assumptions).
- Choose windows: decide IS length, OOS length, and roll step. Longer IS windows give more stable parameter estimates; shorter OOS windows provide more frequent validation.
- Select parameter ranges and granularity: restrict search space to plausible ranges to avoid extreme, data‑fitted rules.
- Optimize on IS, test on OOS: store OOS metrics and trade logs.
- Aggregate results across all folds: examine median, percentiles, and failure modes rather than a single average.
- Decide deployment rules: choose whether to re‑optimize on a schedule or use parameter ensembles from top IS fits.
Treat the steps above as a checklist you repeat until you are confident the process fits your data and operational constraints. The core mechanics are described in the WFO definition and guide.
Comparison: Walk Forward Analysis vs. traditional backtesting
| Aspect | Walk‑Forward Analysis (WFO) | Traditional backtest |
|---|---|---|
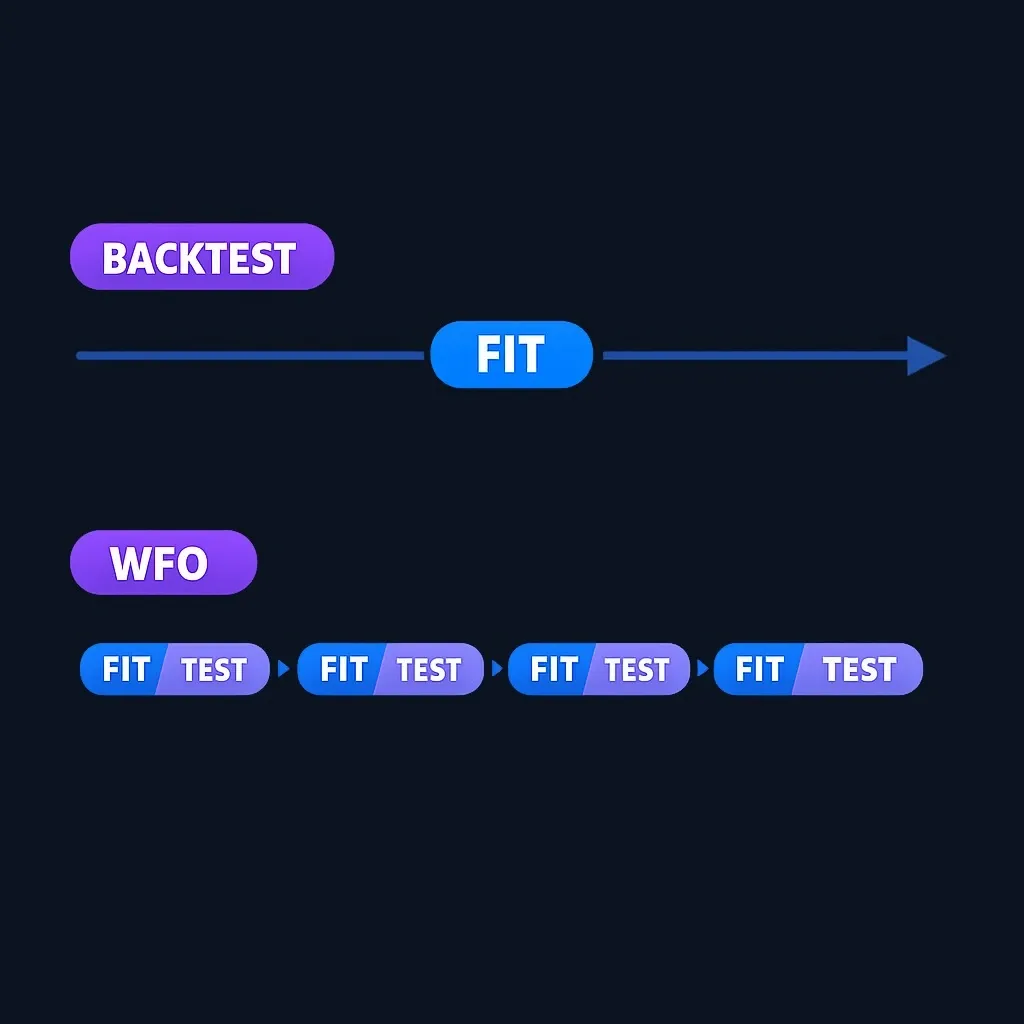
| Parameter selection | Re‑optimizes on rolling IS windows, then validates OOS | Single optimization (or none) across full historical period |
| Realism of adaptation | Simulates periodic re‑tuning to new data | Static parameters may miss regime changes |
| Overfitting check | OOS results across folds expose fragile fits | A single fit can hide curve‑fitting to the whole sample |
| Operational complexity | Higher: requires repeated optimization and bookkeeping | Lower: one run, simpler reporting |
Use WFO when adaptation and robustness matter; use single backtests for quick exploratory checks or when data is extremely limited.
Common pitfalls and how to avoid them
- Over‑optimizing the search: searching an overly fine or vast parameter grid invites curve‑fitting. Restrict ranges and prioritize economically plausible parameter sets.
- Too-short OOS windows: tiny OOS windows create noisy validation and false confidence. Choose OOS lengths that reflect the time between re‑optimizations you would actually run.
- Ignoring execution realism: not modeling slippage, commissions, or fill delays inflates both IS and OOS results. Always include realistic trade costs.
- Cherry‑picking folds: evaluating only the best OOS folds biases the view. Aggregate all folds and report medians and percentile bands.
- Not planning deployment: optimization cadence must fit your operational ability to re‑test and re‑deploy parameters in live trading.
Practice trading with Finelo
Practice in a simulator, learn with bite-sized lessons, and build confidence before risking real money.
Worked example and hypothetical use cases
This section gives a worked example and two realistic scenarios showing how parameter choices change outcomes. These are illustrative worked examples for learning, not claims about live performance.
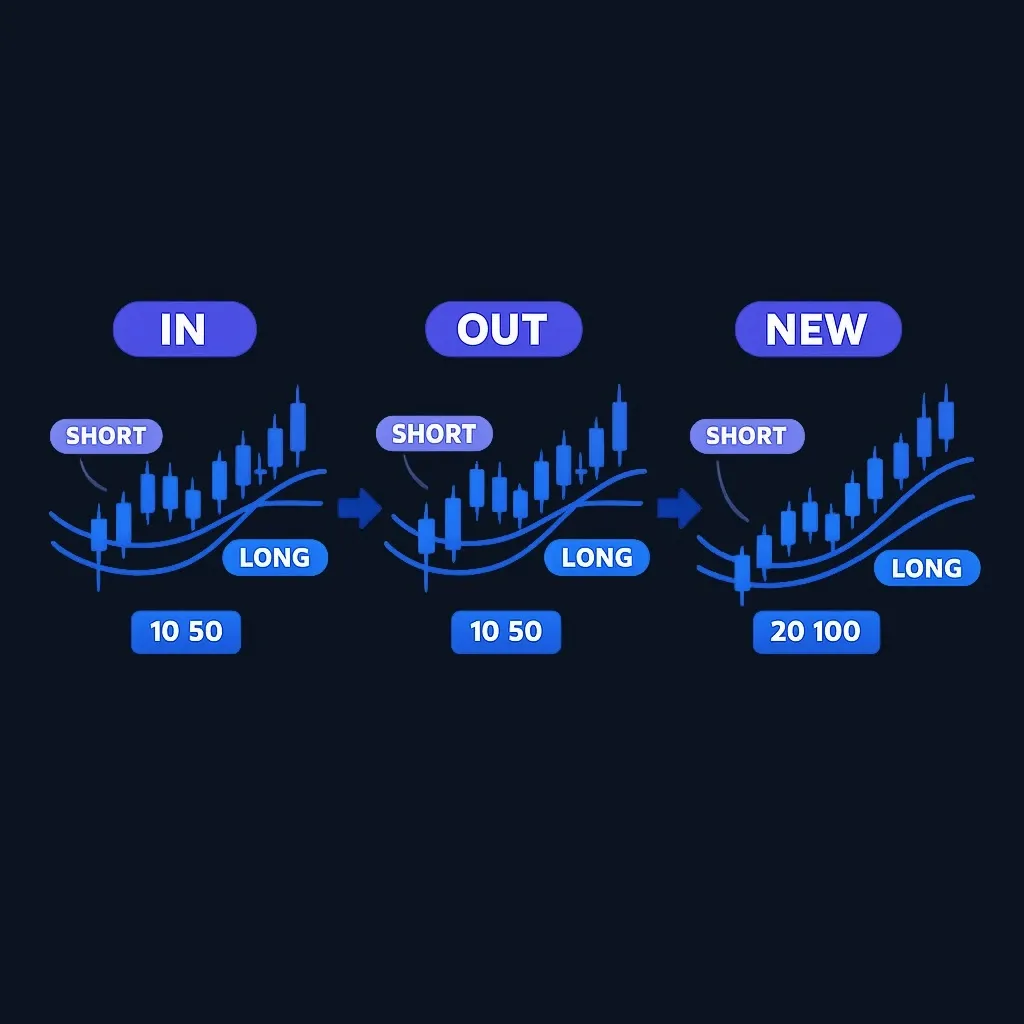
Worked example: moving average crossover (illustrative)
Setup:
- Strategy rule: go long when short‑MA > long‑MA, exit otherwise.
- Parameters: short MA ∈ {5, 10, 20, 50}, long MA ∈ {50, 100, 200}.
- Windowing plan: IS = 2 years, OOS = 1 year, roll forward by 1 year.
Process:
- Optimize the MA pair on IS (choose best by your objective).
- Apply those settings to the next OOS year and record performance metrics.
- Roll windows forward and repeat for the full historical range.
- Aggregate OOS outcomes. If many OOS years fail or show large dispersion, the strategy may be regime‑dependent or overfit.
What to watch:
- If optimal parameter pairs jump wildly between IS windows, the strategy may be unstable.
- If OOS metrics systematically lag IS metrics, the optimization is likely overfitting IS quirks.
This example shows how WFO exposes parameter instability and helps you form deployment rules (for instance, use parameter ensembles rather than single best fits).
Scenario analysis: when WFO adds most value
- Regime changes expected: WFO helps detect strategies that need re‑tuning after market regime shifts.
- Medium‑frequency strategies: when you can re‑optimize without extreme transaction costs, WFO shows practical adaptation.
- Sufficient historical depth: WFO needs enough data to create multiple IS/OOS folds; without it, WFO may only add noise.
Frequently Asked Questions (FAQ)
What is walk forward analysis?
Walk forward analysis, or walk‑forward optimization, repeatedly optimizes strategy parameters on a trailing in‑sample window and then tests those parameters on the subsequent out‑of‑sample window to approximate how re‑optimization would behave in live trading.
How does walk forward analysis improve trading strategies?
WFO improves confidence in a strategy’s robustness by validating optimized parameters on unseen forward data repeatedly; it exposes fragile parameter fits and helps you decide whether optimization benefits persist out of sample. Use WFO to test adaptability rather than to guarantee future gains.
How do I choose in‑sample and out‑of‑sample windows?
Match window lengths to your strategy’s timeframe and how often you could re‑deploy in live trading. Longer IS windows stabilize parameter estimates; longer OOS windows provide stronger validation but fewer folds. There is no universal rule — run sensitivity checks with several window schemes.
How can I avoid overfitting when using WFO?
Limit parameter ranges, prefer simpler models, model realistic costs, and report aggregated fold statistics (medians, percentiles) rather than highlighting best‑case folds. Consider ensemble rules (combining several good IS fits) instead of relying on a single “best” parameter set.
Conclusion and next steps
Walk‑forward analysis is a practical, systematic way to test how a strategy would behave when regularly re‑tuned to new market data. It doesn’t guarantee future performance, but it gives a more realistic robustness check than a single historical fit. Next practical steps:
- Pick one strategy you already backtest and create a simple WFO plan (IS/OOS lengths and roll step).
- Run a small grid search with realistic cost assumptions and collect OOS fold metrics.
- Use the aggregation approach above to decide whether to deploy, ensemble, or discard the strategy.
For additional learning resources and structured courses, visit the Finelo Blog: Finelo Blog.
TradingFinancial Education
Practice trading with Finelo
Practice in a simulator, learn with bite-sized lessons, and build confidence before risking real money.
About the author
Finelo Team
The Finelo Team creates practical investing and trading education designed to help beginners learn faster with structured challenges, simulator practice, and bite-sized lessons.
Keep reading — Related articles
Trading
VWAP vs Moving Average: Formulas, Uses, and Limits
VWAP weights price by recorded volume over a defined period, while a moving average summarizes a sequence of prices over a rolling lookback.
Finelo Team
Trading
Volume Profile vs Market Profile: What Each Chart Measures
Volume Profile groups traded volume by price level.
Finelo Team
Trading
Treynor Ratio vs. Sharpe Ratio: A Detailed Comparison
The Treynor and Sharpe ratios both compare excess return with a measure of risk, but they use different denominators.
Finelo Team


