Quantitative trading, often called quant trading, is a method of making trading decisions with data, mathematical models, and predefined rules. A trader develops a hypothesis, translates it into measurable conditions, tests it on historical data, and then uses the resulting model to identify or execute trades. The process can be partly manual or highly automated.
What is Quantitative Trading?

Quantitative trading, often called quant trading, is a method of making trading decisions with data, mathematical models, and predefined rules. A trader develops a hypothesis, translates it into measurable conditions…
9 min read
Practice trading with Finelo
Practice in a simulator, learn with bite-sized lessons, and build confidence before risking real money.
Want to learn more?
Practice in a simulator, learn with bite-sized lessons, and build confidence before risking real money.
Explore FineloExplore Finelo's 28-day challenges
Turn learning into a daily habit with guided challenge paths.
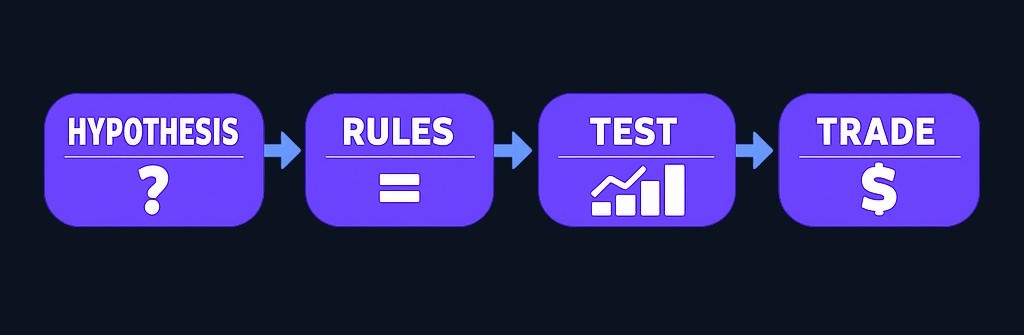
The key idea is discipline: the system decides according to explicit inputs and rules instead of reacting mainly to news, instinct, or emotion. That does not make quant trading predictable or risk-free. A model can fit the past yet fail in live markets, and automated errors can spread quickly. Quantitative trading is therefore as much about testing and risk control as it is about finding opportunities.
How Quantitative Trading Works
A quantitative strategy starts with a specific question. For example: do unusually large short-term price moves tend to reverse, or do established trends tend to continue? The researcher then defines the market, data, time horizon, entry conditions, exit conditions, and risk limits.
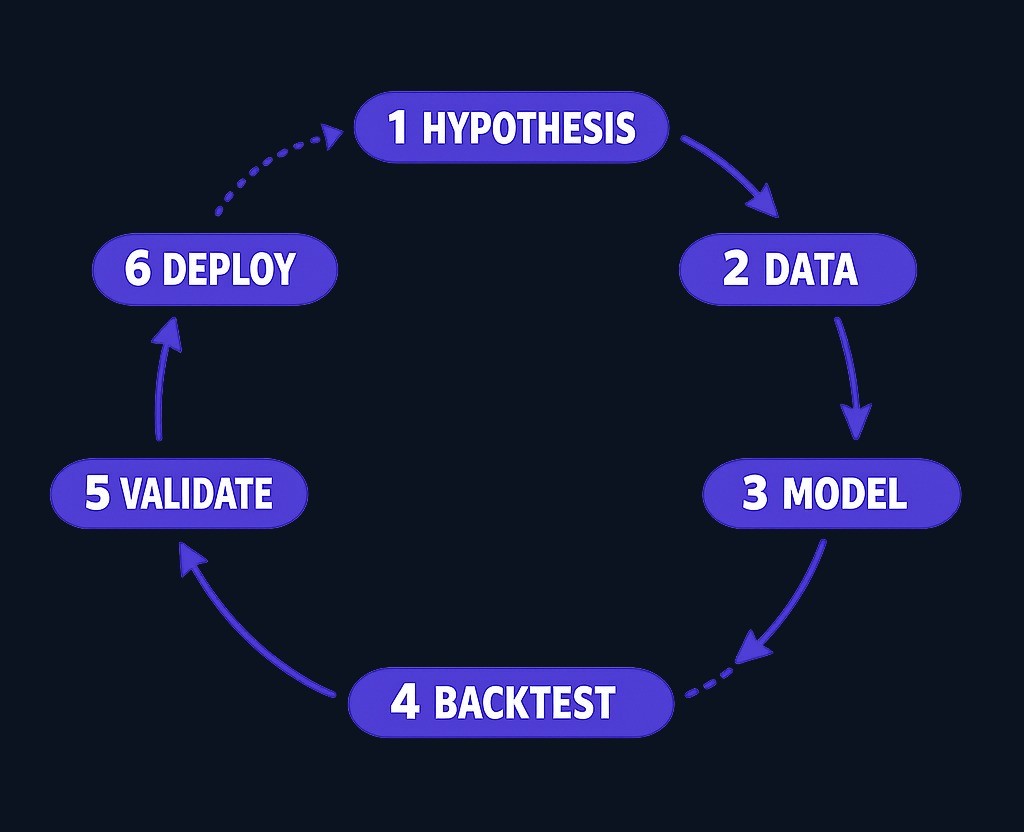
The typical workflow has six stages:
- Form a hypothesis. State the proposed market behavior clearly enough to disprove it.
- Collect and clean data. Check for missing values, inconsistent timestamps, duplicate observations, and information that would not have been available at the time of a simulated decision.
- Build the model. Convert the hypothesis into calculations and unambiguous trading rules.
- Backtest it. Apply those rules to historical data while accounting for realistic costs and execution constraints.
- Validate it. Test the model on data that was not used to develop it and examine how it behaves under different assumptions.
- Deploy and monitor it. Trade cautiously, compare live behavior with the test, and pause the system if its performance or inputs depart from expectations.
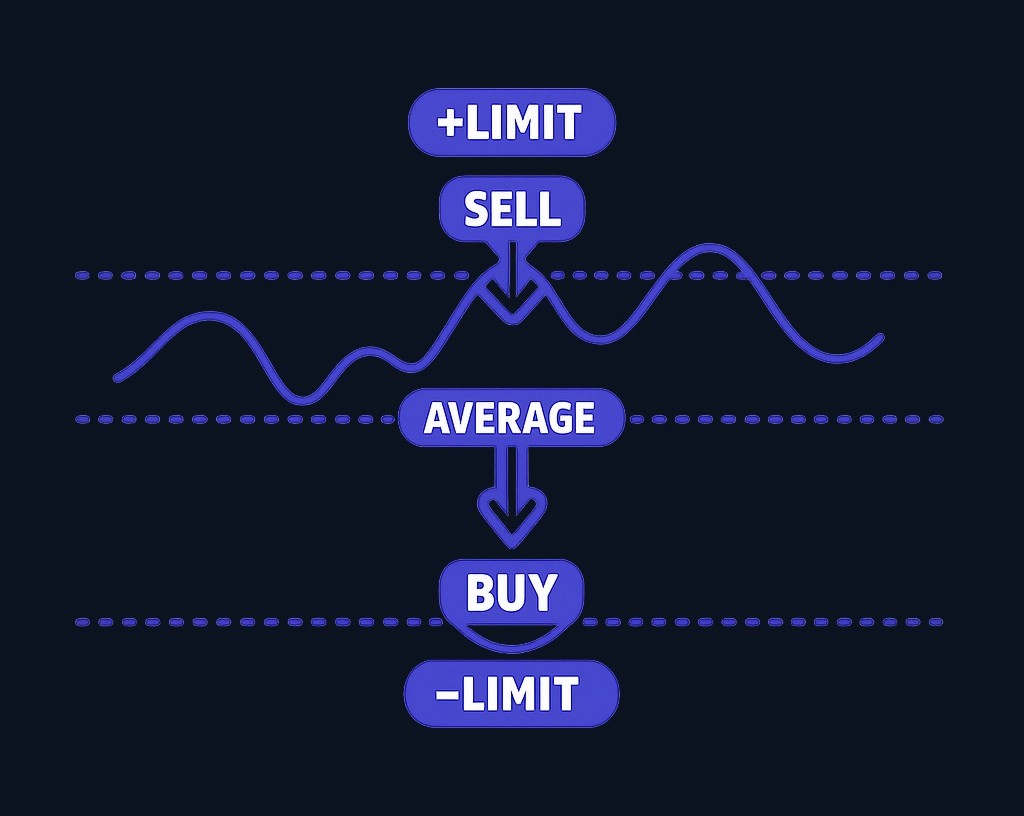
Consider a simplified mean-reversion model. It might calculate an asset’s recent average price, measure how far the current price has moved from that average, and produce a signal when the deviation crosses a threshold. The rule sounds simple, but a usable system must still decide how much to trade, when to exit, what to do during a sharp market move, and whether expected gains are large enough to cover costs.
The Core Components of a Quant System
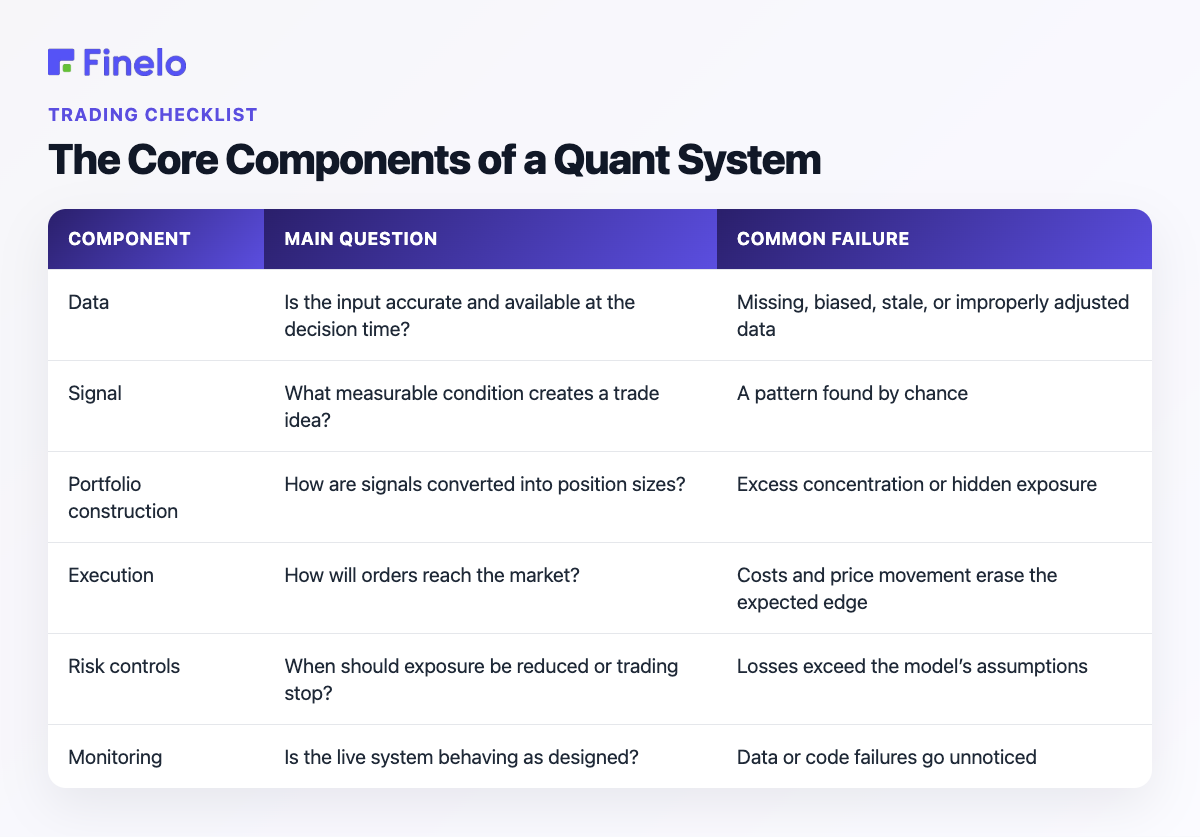
Quantitative trading combines several layers. A strong signal cannot compensate indefinitely for poor data, unrealistic testing, or uncontrolled execution.
| Component | Main question | Common failure |
|---|---|---|
| Data | Is the input accurate and available at the decision time? | Missing, biased, stale, or improperly adjusted data |
| Signal | What measurable condition creates a trade idea? | A pattern found by chance |
| Portfolio construction | How are signals converted into position sizes? | Excess concentration or hidden exposure |
| Execution | How will orders reach the market? | Costs and price movement erase the expected edge |
| Risk controls | When should exposure be reduced or trading stop? | Losses exceed the model’s assumptions |
| Monitoring | Is the live system behaving as designed? | Data or code failures go unnoticed |
Data and signals
Price, volume, volatility, company information, economic observations, and other structured inputs can all be used in a quantitative process. More data is not automatically better. The relevant questions are whether the data is reliable, whether it was genuinely available at the modeled time, and whether it adds information after costs and complexity.
A signal is a rule that maps those inputs to an expected action. It may rank assets, estimate relative value, identify a trend, or flag an unusual relationship. Signals are estimates, not certainties, so they are normally combined with position-sizing and risk rules.
Backtesting and validation
A backtest is a simulation, not a live result. It is useful for understanding how rules would have behaved under specified assumptions, but it can be distorted by several problems:
- Overfitting: tuning a model until it explains random features of one dataset.
- Look-ahead bias: allowing the test to use information that was unavailable when the trade would have occurred.
- Selection bias: studying only assets or periods that survived or looked promising later.
- Unrealistic execution: assuming every order fills immediately at the desired price.
- Ignored costs: omitting commissions, spreads, market impact, borrowing expenses, or taxes where relevant.
Separating development data from validation data helps, but it does not eliminate uncertainty. Repeatedly checking the validation period can effectively turn it into another training set.
Common Quantitative Trading Strategies
Strategy labels describe a broad idea, not a ready-made formula. Two models in the same category may use different data, holding periods, instruments, and risk limits.
Mean reversion
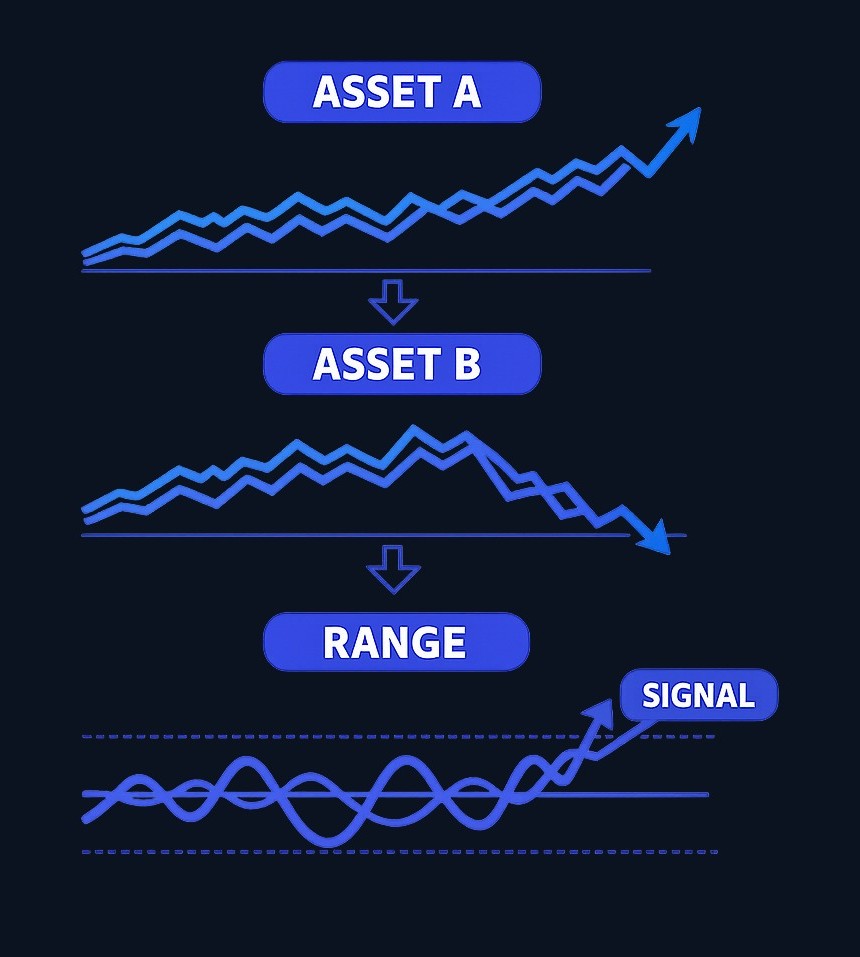
Mean-reversion strategies assume that some unusually wide price or valuation deviations may narrow. A pairs model, for instance, could monitor two historically related instruments and trade when their relationship moves beyond a defined range. The central danger is mistaking a permanent change for a temporary deviation.
Trend following
Trend models seek to participate in sustained upward or downward movement. Signals may be based on returns over a chosen window, moving averages, or breakouts. These systems can struggle when markets repeatedly reverse direction without establishing a durable trend.
Statistical arbitrage
Statistical arbitrage uses models to identify relative mispricing across a group of instruments. Positions may be constructed so that broad market exposure is reduced while the model targets differences between assets. The word “arbitrage” should not be read as “guaranteed profit”: estimated relationships can break, execution can be uneven, and losses remain possible.
Market making
A market-making approach posts prices at which it is willing to buy and sell, seeking compensation for supplying liquidity while managing inventory. Its risks include adverse selection, rapid price changes, and accumulating an unwanted position.
High-frequency trading
High-frequency trading is a specialized form of automated trading operating over very short time horizons. It depends heavily on infrastructure, execution design, monitoring, and controls. It is not simply a faster version of a beginner’s trading script. FINRA notes that as algorithmic and high-frequency strategies became more widespread, their potential to affect market and firm stability also grew, underscoring the importance of supervision and controls (FINRA).
Quantitative vs. Algorithmic Trading
The terms overlap but emphasize different things.
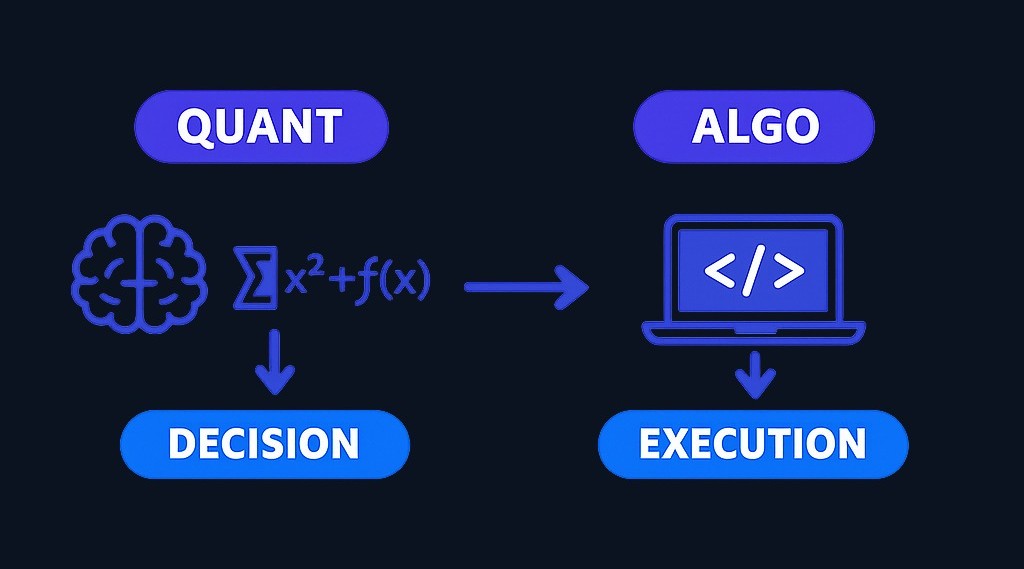
Quantitative trading focuses on using numerical analysis and models to generate decisions. Algorithmic trading focuses on using programmed instructions to execute or manage orders. A quantitative model may generate a signal that a person reviews before trading. Conversely, an execution algorithm may split a human-decided order into smaller pieces without deciding whether the investment itself is attractive.
In practice, many systems do both: a model selects the trade and software executes it. Keeping the distinction clear helps a beginner avoid assuming that any automated order is a sophisticated quantitative strategy—or that every quantitative analysis must trade automatically.
Practice trading with Finelo
Practice in a simulator, learn with bite-sized lessons, and build confidence before risking real money.
Technology and Skills Used in Quant Trading
The technical stack should match the task. Research needs flexible tools for cleaning data, running statistical tests, and visualizing results. Production systems additionally need reliable data pipelines, order handling, logging, security, and monitoring. At shorter time horizons, delays and infrastructure design can matter more; at longer horizons, research quality and portfolio construction may dominate.
Commonly useful skill areas include:
- Probability and statistics: distributions, estimation, hypothesis testing, regression, and time-series reasoning.
- Programming: writing clear, testable code and working with data efficiently.
- Market knowledge: understanding instruments, order types, liquidity, costs, and trading constraints.
- Research design: separating a plausible hypothesis from a coincidental historical pattern.
- Risk management: sizing positions, measuring exposures, and planning for model failure.
- Communication: explaining assumptions and limitations to traders, engineers, risk teams, or clients.
Languages such as Python, R, SQL, C++, and Java may appear in quantitative work, but memorizing a long tool list is less important than learning one research workflow well. Python or R can support analysis and prototyping; SQL is useful for retrieving structured data; compiled languages may be chosen when production performance is especially important. Spreadsheets can help inspect small datasets, but they become difficult to audit as models grow.
Career paths include quantitative researcher, quantitative trader, data scientist, developer, execution specialist, and model-risk professional. The balance of mathematics, software engineering, and market judgment varies by role. Someone targeting research may prioritize statistics and experimental design, while someone targeting infrastructure may need deeper systems and software skills.
Risk Management and Ethical Pitfalls
Quantitative trading replaces some discretionary decisions with explicit rules, but it does not remove risk. It can also create a false sense of precision: a model may display exact numbers even when its assumptions are fragile.
Important risks include:
- Model risk: the underlying relationship is wrong, incomplete, or no longer relevant.
- Data risk: inputs are delayed, corrupted, biased, or interpreted incorrectly.
- Execution risk: orders fill at worse prices than expected or fail to fill.
- Liquidity risk: a position cannot be reduced without moving the market materially.
- Leverage risk: borrowed exposure magnifies both gains and losses.
- Concentration risk: several apparently different trades depend on the same hidden factor.
- Operational risk: software, connectivity, permissions, or monitoring fail.
- Behavioral risk: a trader abandons the system after normal losses or overrides controls at the worst time.
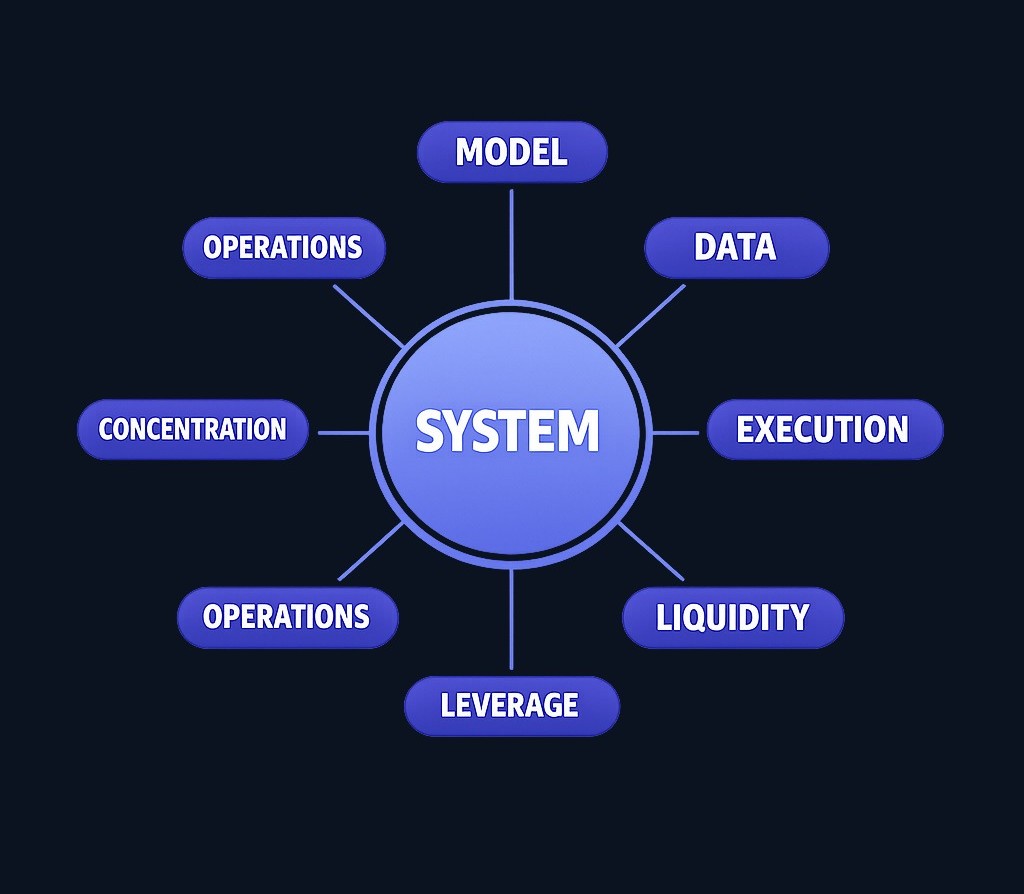
Risk limits should exist at more than one level. A strategy may cap the size of each position, total exposure, daily loss, and order rate. It may also define conditions that trigger review or stop trading, such as stale data, abnormal fills, unexpected inventory, or a material difference between live and simulated behavior.
Ethical and regulatory concerns matter as well. Automation does not make manipulative conduct acceptable, and a model should not be treated as a way to avoid responsibility for orders it generates. Anyone moving from research to live trading must understand the rules, broker requirements, data rights, and market-access controls that apply to their situation. Those requirements can differ by jurisdiction, instrument, and whether a person trades only their own account or manages money for others.
How Beginners Can Start
A sensible transition from manual to quantitative trading begins with a small research problem, not a fully automated live system.
- Choose one liquid market and one clearly defined hypothesis.
- Write the rule in plain language before looking for the most favorable parameters.
- Obtain data and document how it was cleaned.
- Build a simple baseline model before adding complexity.
- Include conservative estimates for costs and imperfect execution.
- Test on unseen data and across different market conditions.
- Use simulated trading to check order logic, logging, and monitoring.
- If moving to real money, begin with exposure small enough that errors remain manageable.
- Keep a research log showing assumptions, changes, and reasons for stopping the strategy.
The aim of the first project should be learning whether the entire process is sound. A modest model that is understandable and testable is generally more educational than a complicated one whose behavior cannot be explained.
Conclusion
The best concise answer to “what is quantitative trading?” is: it is a rules-based approach that uses data and mathematical models to identify, size, and sometimes execute trades. Its advantage is a repeatable research process; its limitation is that every result depends on data, assumptions, implementation, and changing market conditions.
For beginners, the practical next step is to study one simple hypothesis from data collection through validation and simulated execution. Treat the exercise as financial education, document the limitations, and evaluate risk, costs, and suitability before committing capital. Finelo provides an investment-learning starting point for readers building that foundation (Finelo).
Frequently asked questions
Can an individual trader use quantitative methods?
Yes. An individual can define rules, analyze historical data, and test a model without operating at high frequency. The practical constraints are data quality, costs, technical reliability, time, and available capital. A retail system should be designed around those constraints rather than imitating infrastructure-intensive firms.
Does quantitative trading guarantee more objective decisions?
It can make decisions more consistent because rules are specified in advance. However, people still choose the data, model, parameters, and risk limits. Bias can enter during research, and a disciplined-looking model can still be based on weak assumptions.
Is machine learning required?
No. Many useful research questions can be explored with straightforward statistics and rule-based models. Machine learning can help with some pattern-recognition or forecasting tasks, but it also adds complexity and can make overfitting or interpretation harder.
What should I learn first?
Start with basic statistics, data handling, programming, market mechanics, and backtesting errors. Then complete a small end-to-end project. Being able to explain why a model should work, how it was tested, and when it should stop trading is more valuable than collecting disconnected techniques.
TradingBeginnerStrategiesMarkets
Practice trading with Finelo
Practice in a simulator, learn with bite-sized lessons, and build confidence before risking real money.
About the author
Finelo Team
The Finelo Team creates practical investing and trading education designed to help beginners learn faster with structured challenges, simulator practice, and bite-sized lessons.
Keep reading — Related articles

Trading
What Is SPAN Margin: Learn the Concept & Risk Controls
SPAN margin is an exchange-level, risk-based margin framework that calculates required collateral for futures and options by assessing portfolio risk across prescribed market scenarios rather than using a flat per‑contract rate.
Finelo Team
Trading
What Is Portfolio Margin: Learn the Concept & Risk Controls
Portfolio margin is a risk-based method that applies scenario analysis to eligible positions in an approved margin account.
Finelo Team
Trading
What Is NQ in Trading: Learn the Concept & Risk Controls
In trading, NQ is the ticker symbol for the E-mini Nasdaq-100 futures contract, listed on CME Group's exchange.
Finelo Team