An engulfing candle is a two-candle pattern in which the second candle's real body completely covers the body of the first. When a large up candle swallows the previous down candle after a decline, it is a bullish engulfing, read as a possible upside reversal. When a large down candle swallows the previous up candle after a rally, it is a bearish engulfing, and a possible downside reversal. The pattern is a clue that control may be changing hands, not a promise that price will follow.
What Is an Engulfing Candle? How to Read the Two-Candle Reversal
An engulfing candle is a two-candle pattern in which the second candle's real body completely covers the body of the first. Learn bullish vs bearish engulfing, confirmation, and how it differs from the harami and doji.
10 min read
Practice trading with Finelo
Practice in a simulator, learn with bite-sized lessons, and build confidence before risking real money.
Want to learn more?
Practice in a simulator, learn with bite-sized lessons, and build confidence before risking real money.
Explore FineloExplore Finelo's 28-day challenges
Turn learning into a daily habit with guided challenge paths.
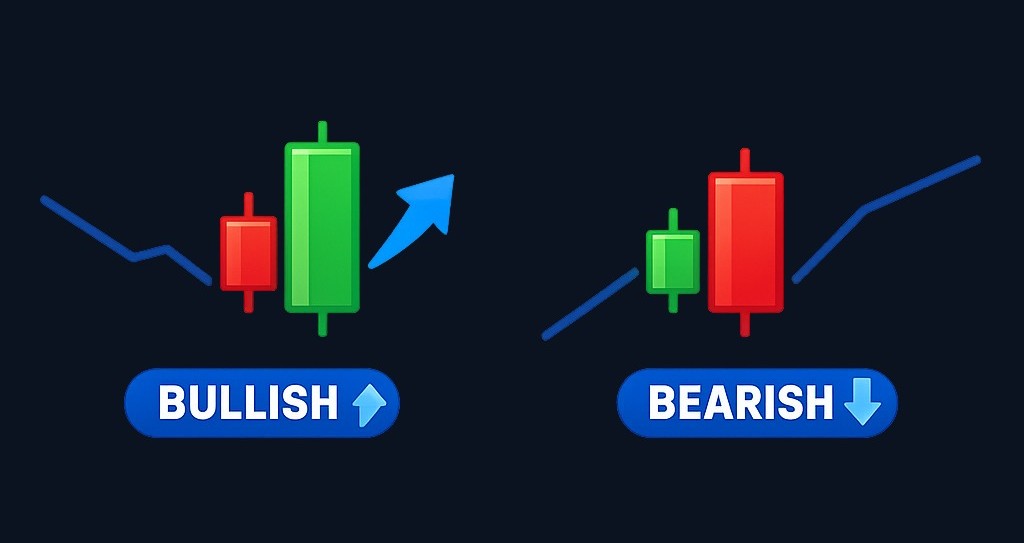
This guide is for beginners who want the version with the caveats attached. The short version of the engulfing candle meaning is a handover of control between buyers and sellers, but the useful part is the context around it. You will learn the anatomy, the psychology, how bullish and bearish versions differ, how to confirm one, why any engulfing candle strategy lives or dies on that confirmation, and how the pattern differs from the harami and doji.
A candle that engulfs the last one is a headline. Confirmation is the story.
What an engulfing candle is
The engulfing candle, also searched as the engulfing candlestick or the engulfing candlestick pattern, is a two-candle formation. The first candle continues the existing trend. The second reverses hard and closes with a real body that fully covers the first's body. That covering is the whole idea, and why the pattern reads as a shift of control rather than an ordinary swing.
One point decides everything and trips up most beginners: it is the bodies that must engulf, not the wicks. A candle whose long wick pokes past the first but whose body falls short of covering it is not an engulfing candle, however dramatic it looks. The next section gives the exact mechanic; this is the rule to hold onto first.
The anatomy: how the second body swallows the first
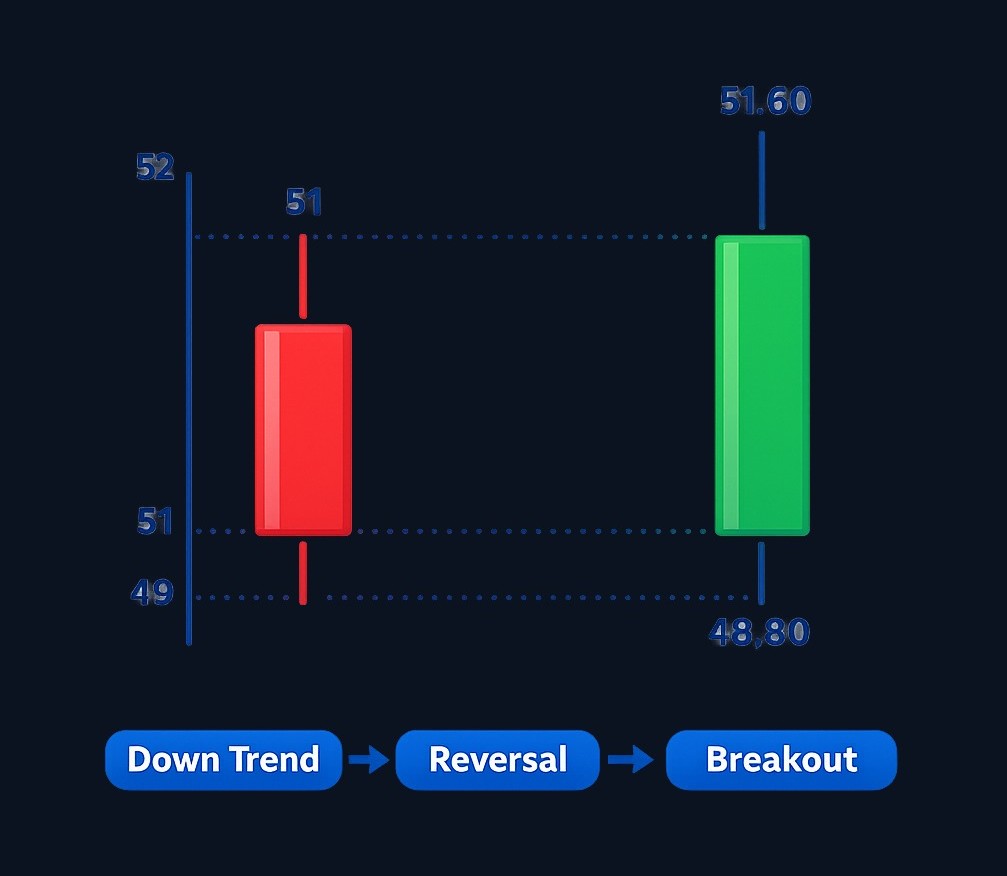
The precise mechanic: for a bullish engulfing, the second up body opens at or below the first down body's low and closes at or above its high. For a bearish engulfing, the second down body opens at or above the first up body's high and closes at or below its low. The direction flips, the mechanic is identical.
An illustrative example, not a real trade. In a downtrend, one session prints a small down candle: open 51, close 49. The next opens at 48.80 and closes at 51.60, a green body that fully covers the 49-to-51 body beneath it, so this is a valid bullish engulfing. The wicks do not matter to the classification. The second body is also decisively larger than the first, which matters: a body that only barely covers the first is a weaker version.
The psychology behind the pattern
The two candles describe a handover. The first continues the prevailing trend; the second rejects it wholesale, closing past the entire body of the prior session, which puts everyone who acted during that last candle on the wrong side.
A bullish engulfing after a downtrend suggests sellers overwhelmed by fresh buying decisive enough to erase a full session; a bearish engulfing suggests the opposite. The bigger the engulfing body relative to the one it covers, the more forceful the handover looks.
The honest qualifier is that one forceful candle is not a trend. The handover can stall, and the next session can hand control straight back, which is why most sources treat the following candle as the thing that confirms anything.
Bullish vs bearish engulfing
The two versions are the same mechanic pointed in opposite directions, and the preceding trend tells them apart. The label follows the context, not just the shape.
| Feature | Bullish engulfing | Bearish engulfing |
|---|---|---|
| Prior trend | A downtrend | An uptrend |
| First candle | A small down body | A small up body |
| Second candle | A larger up body that engulfs it | A larger down body that engulfs it |
| Read | Possible upside reversal | Possible downside reversal |
| Best location | At or near support | At or near resistance |
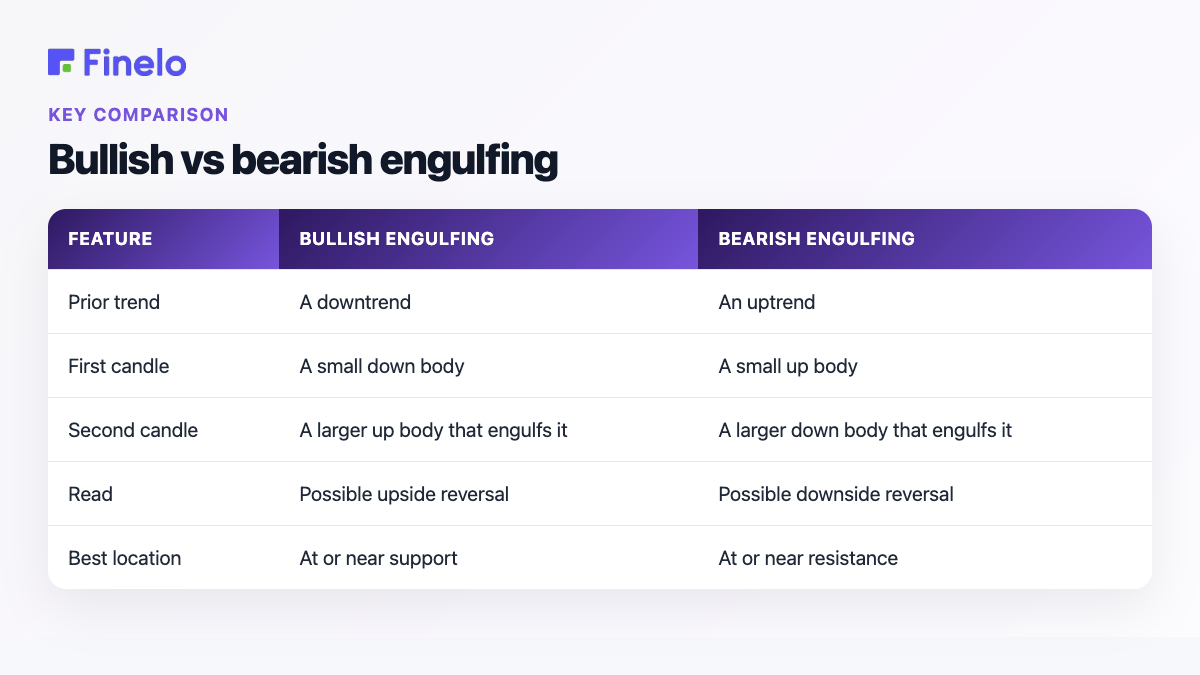
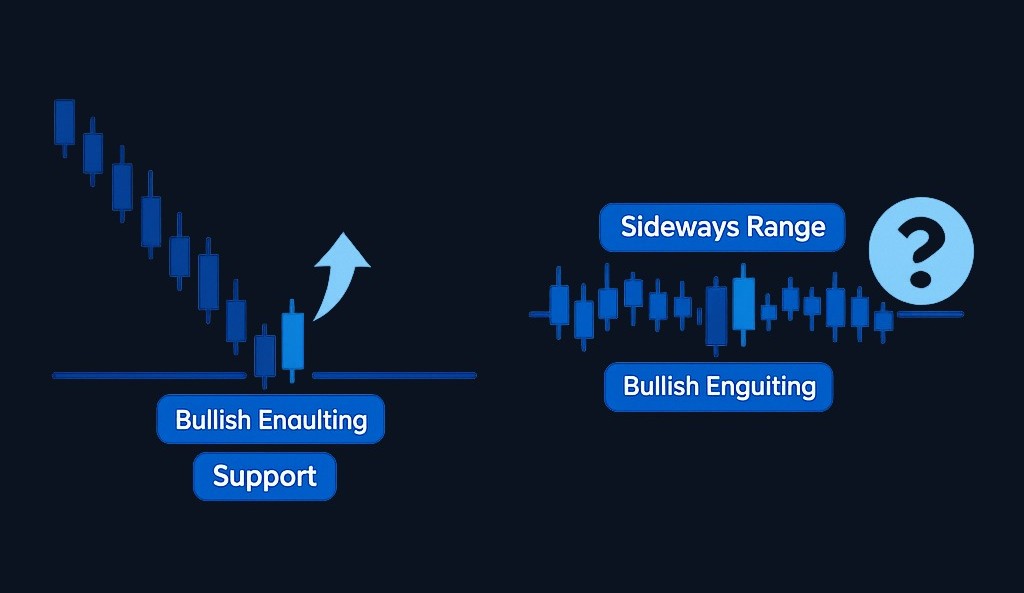
A bullish engulfing candle carries more weight at a support level the market has respected before, because the level gives the reversal a reason and the candle gives it timing. A bearish engulfing reads more convincingly at resistance, for the same logic reversed. That is the plain answer to the bullish or bearish question: it is whichever the prior trend and the engulfing body's direction make it, and neither means much mid-range.
Practice trading with Finelo
Practice in a simulator, learn with bite-sized lessons, and build confidence before risking real money.
Context and reliability: trend, level, volume, confirmation
The same two candles can be meaningful or meaningless depending on what surrounds them, and reliability is entirely conditional on that context. Three filters decide it.
Trend comes first: a bullish engulfing needs a real downtrend in front of it to reverse anything, a bearish engulfing a real uptrend. In a choppy market, large candles that swallow their neighbours appear constantly and resolve at random.
Location is second: a pattern at a prior support or resistance level is far more reliable than one mid-range, because the level supplies the reason to expect a reaction and the candle the timing.
Volume is third, since a decisive-looking reversal on thin participation is a weaker claim than the same shape backed by real activity.
Confirmation is the fourth filter and the most practical one. Most traders wait for the candle after the engulfing candle to close in the same direction before treating the reversal as real.
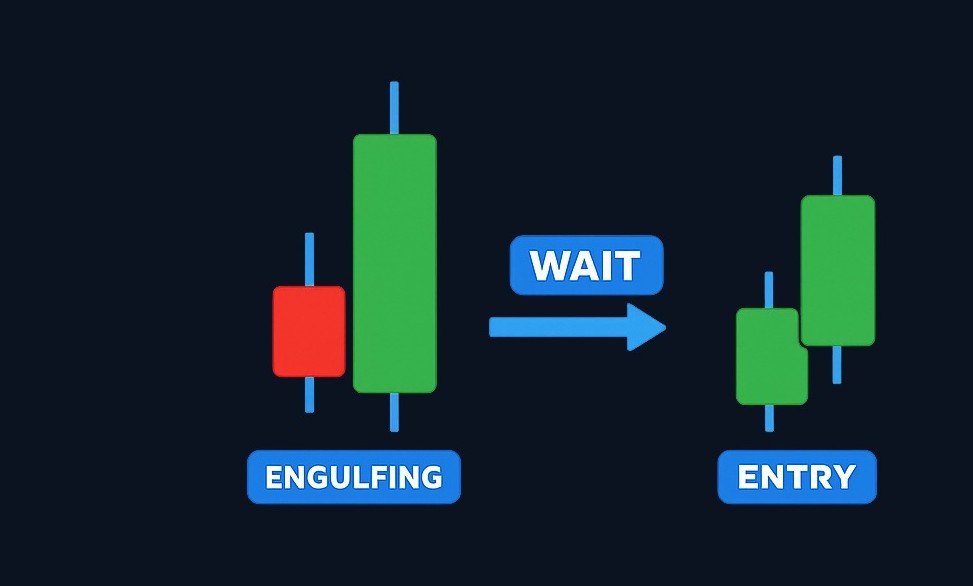
That costs a little of the move, but filters out a large share of shapes that looked decisive and then reversed on the next session. Timeframe matters alongside it. A forex engulfing candle shows the same two bodies as a stock's, but a break on a quiet one-minute chart is a different animal from one on a daily. And because currency markets trade continuously, engulfing candles there often form without the between-session gap seen on stocks.
A shape that reverses one session is a fact. A shape that reverses the trend is a claim the next candle has to back.
That context is also why quoted success rates should be treated with suspicion. Distrust any number that arrives without its market, timeframe, sample size, and exact rules.
One limitation deserves stating plainly rather than glossing over: the engulfing candle gives no price target. Unlike a triangle or a double bottom, it projects no measured move, so anyone using it has to find exits from other tools, nearby support and resistance, or trend structure. That is a real constraint, not a footnote.
Studying the engulfing candle that failed teaches more than admiring the one that worked.
A failed engulfing candle has a recognizable signature. Price prints a textbook engulfing body, then the next candle carries on in the original direction as though nothing happened. Or the reversal holds a session or two and fails at the next level. The failures are common enough that treating the pattern as a trigger rather than a clue is the fastest way to get hurt by it.
Engulfing vs harami vs doji
These three get mixed up constantly, and the differences are structural once laid out. The engulfing and the harami are near-opposites. The doji is a different creature entirely.
| Pattern | Structure | What it suggests |
|---|---|---|
| Engulfing | Second body fully covers the first body, and is larger | A decisive shift of control |
| Harami | Second body is small and sits inside the first body | Hesitation, a pause, the trend losing steam |
| Doji | A single candle (not a pair) with almost no real body | Indecision, buyers and sellers balanced |
| Outside bar | Second candle's entire range, wicks included, covers the first | Similar psychology to engulfing, stricter definition |
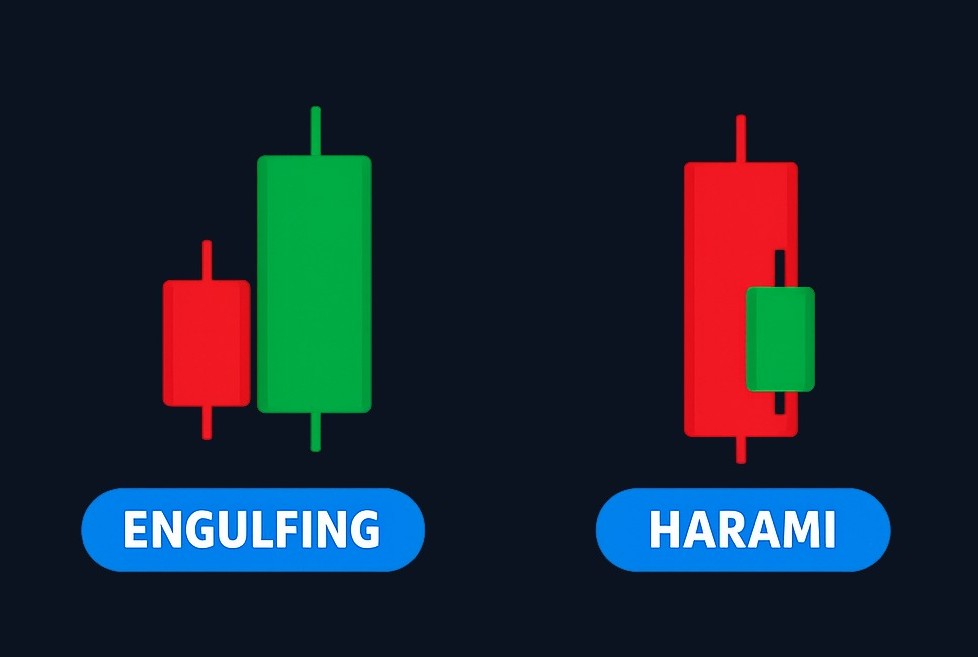
The harami is the one people reverse in their heads. It is the opposite of an engulfing: instead of a large second candle swallowing the first, a small second candle sits inside the body of a larger first. Where the engulfing shows one side seizing control, the harami shows the move running out of breath, a gentler warning that needs more confirmation. The outside bar is the stricter relative, engulfing the first candle's entire range including the wicks, not just the body.
For the single-candle version of indecision, see what a doji candle is.
Common mistakes to avoid
Acting before confirmation is the big one. An engulfing candle describes a session that has already closed, and says nothing about what the next must do. Entering the moment it prints often means trading into a market that was only pausing.
Confusing wick engulfing with body engulfing is close behind, the single most common misread. The classic pattern requires the second body to cover the first body. A candle whose shadow pokes past the first but whose body falls short is not an engulfing candle, and treating it as one manufactures signals that were never there.
Ignoring the trend is a third. A bullish engulfing inside a strong downtrend, or a bearish one inside a strong uptrend, is a low-probability counter-trend read. The pattern works best aligned with a clear prior move and a level.
The last is forgetting the pattern has no target. Entering without deciding in advance where the idea is wrong leaves you with a story but no plan. The invalidation, commonly a close back beyond the far end of the engulfing candle, matters more than the entry.
Practice before you risk anything
If you are learning this pattern, do not start by hunting a live trade. Collect examples first: engulfing candles that marked real turning points, ones that failed and let the trend carry on, and wick-only candles that only looked like engulfing patterns until you checked the bodies. Hide the future price action, judge each on what was visible, then look at what happened.
Inside the Finelo app, you can study candle structure and practice buy, sell, and hold decisions on real market data with virtual funds. There are no deposits, no withdrawals, and no broker connection, it is a closed practice loop, so the only cost of a wrong read is the lesson. The Finelo trading simulator pairs that practice with short lessons and a review habit. For the candlestick literacy underneath every one of these patterns, start with what a doji candle is.
Final decisions are always yours. A candle is a way of reading a chart, not a substitute for judgment.
Practice reading candlestick patterns in the Finelo app →
Where to learn more
For related candle patterns, see what a doji candle is, the hammer candlestick, and how to read candlesticks. Finelo also publishes educational material for beginners; you can check Finelo reviews, the About Finelo page, or the Finelo support center.
Finelo is an educational product, not a brokerage. The simulator uses virtual funds and real market data, and final trading and investing decisions are yours, made through your own brokerage account when you choose to act. This article is for education and is not financial advice.
Frequently asked questions
What is an engulfing candle?
It is a two-candle pattern where the second candle's real body completely covers the first candle's body, suggesting a possible shift in momentum. A bullish engulfing appears after a downtrend; a bearish engulfing appears after an uptrend. On its own it is a clue, not a guarantee.
Is an engulfing candle bullish or bearish?
It can be either, and the prior trend decides. A bullish engulfing forms after a downtrend, where a larger up candle engulfs a small down candle, and reads as a possible upside reversal. A bearish engulfing forms after an uptrend and reads as a possible downside reversal.
How do you confirm an engulfing candle?
Many traders wait for the next candle to close in the same direction before treating the reversal as confirmed. A clear prior trend, a key level, and above-average volume all strengthen the read. Waiting reduces false signals at the cost of a later entry.
How is an engulfing pattern different from a harami?
They are near-opposites. In an engulfing pattern the second candle is larger and swallows the first body. In a harami the second candle is small and sits inside the first body. An engulfing suggests a decisive shift of control; a harami suggests hesitation and needs more confirmation.
How reliable is the engulfing candlestick pattern?
Conditional, and often overstated online. It is more meaningful after a clear trend, near a key level, on higher timeframes, and with volume support, and weaker in choppy, low-volume markets. Be skeptical of quoted success rates, which depend on the market, timeframe, and rules used.
engulfing candlebullish engulfingbearish engulfingcandlestick patternschart analysis
Practice trading with Finelo
Practice in a simulator, learn with bite-sized lessons, and build confidence before risking real money.
About the author
Finelo Team
The Finelo Team creates practical investing and trading education designed to help beginners learn faster with structured challenges, simulator practice, and bite-sized lessons.
Keep reading — Related articles

Chart Analysis
SMT Divergence Trading: Learn the Concept & Risk Controls
In trading, SMT stands for Smart Money Technique, and it is almost always discussed as SMT divergence. It is a concept from the ICT (Inner Circle Trader) framework that describes one specific moment: two markets that normally move together stop confirming each other.
Finelo Team
Chart Analysis
Price Action Cheat Sheet: Structure, Patterns, and Limitations
Price action is the study of changes in price, often using swing highs and lows, support and resistance, ranges, and candlestick formations.
Finelo Team
Chart Analysis
Order Block Trading: Learn the Concept & Risk Controls
An order block is a price zone that traders mark from the last candle pointing against a strong, impulsive move.
Finelo Team