An ascending triangle pattern is a consolidation shape with two defining features: a flat horizontal resistance level that price keeps failing to clear, and a series of higher lows climbing toward it. Together they form a triangle with a level top and a rising floor.
What Is an Ascending Triangle Pattern? How to Read It on a Chart

An ascending triangle has flat resistance and rising lows. Learn how to spot it, confirm a breakout, measure a target, grade the setup, and avoid common mistakes.
10 min read
Practice trading with Finelo
Practice in a simulator, learn with bite-sized lessons, and build confidence before risking real money.
Want to learn more?
Practice in a simulator, learn with bite-sized lessons, and build confidence before risking real money.
Explore FineloExplore Finelo's 28-day challenges
Turn learning into a daily habit with guided challenge paths.
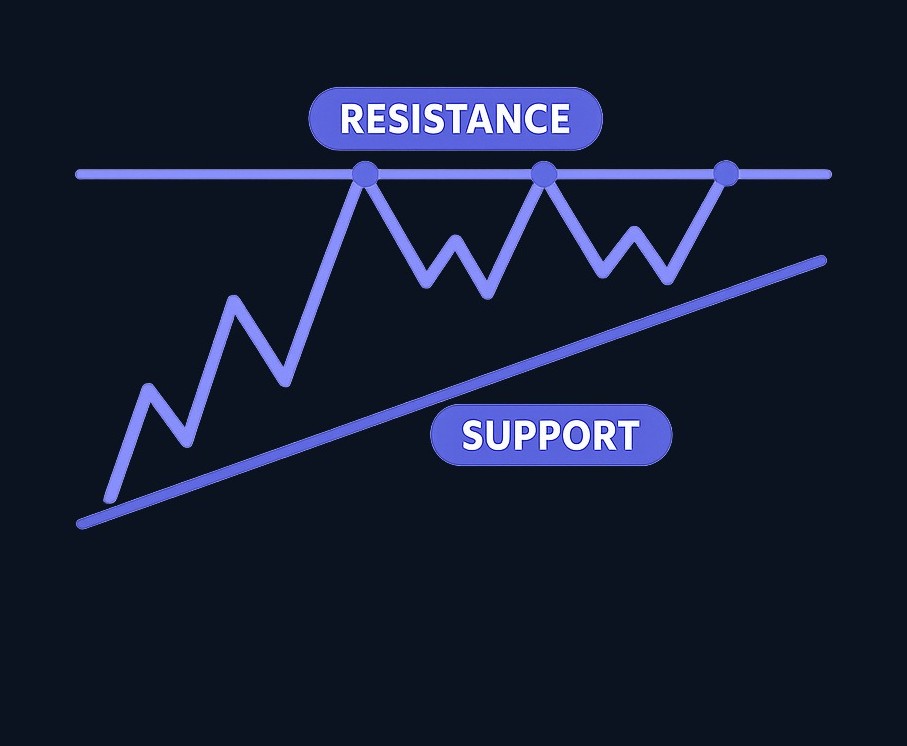
It is usually read as a bullish continuation pattern, meaning traders expect the break to come upward, most often when the triangle forms inside an uptrend. That expectation is not a rule. Price can and does break the other way, and until it closes above the flat top, nothing is confirmed.
This guide is for beginners who want the version with the caveats attached. You will learn the structure, the psychology, how to confirm an ascending triangle breakout, how to measure a target, why the pattern is less of a sure thing than some pages claim, and how it differs from its two siblings.
A coil is not a promise. The breakout is the event, and even that has to be checked.
What an ascending triangle pattern is
The ascending triangle, sometimes searched as the ascending triangle chart pattern or the bullish ascending triangle, is a consolidation. Price is not trending while it forms; it is compressing. Sellers hold a fixed ceiling, buyers step in earlier on each dip, and the range tightens until something gives.
Its default reading is bullish continuation, which is why it is usually discussed as an uptrend pattern. It can also appear after a downtrend as an attempted reversal, and the rising lows still tell the same story of accumulating demand, but most sources treat that context as less reliable. The pattern’s reputation is built on the uptrend case. Borrowing that reputation for a downtrend chart is where beginners get hurt.
The structure: flat resistance, rising lows
Two lines define the shape, and both have to be real.
The flat resistance is a horizontal ceiling price has tested and failed to clear at least twice, ideally three times or more. Each additional touch makes the level more meaningful, because it represents supply reappearing at the same price. The rising trendline connects the higher lows underneath. Each dip bottoms out above the last, the visual evidence that buyers are getting more aggressive.
One precision point is worth internalizing, because it is where most misidentification happens. If the upper line slopes upward rather than sitting flat, this is not an ascending triangle at all. Rising lows under a rising ceiling describe a wedge if the lines converge, or a channel if they run parallel, and both read differently. The flatness of the top is not a stylistic detail; it is the definition.
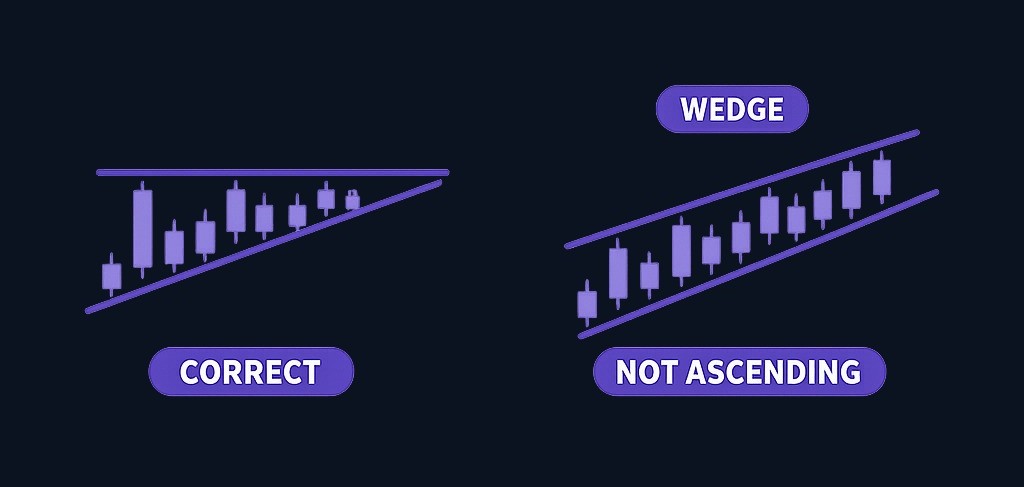
Volume typically contracts as the triangle builds, which fits the idea of a market coiling rather than breaking apart.
The structure reads the same across markets, so an ascending triangle in forex has the same two lines. What changes is the participation behind them: on a 24-hour chart, a breakout in a quiet session may lack the volume that would make the same break convincing on a stock. Higher timeframes produce cleaner triangles than short intraday charts.
The psychology: fixed supply meeting rising demand
The two lines describe a negotiation. At the flat top sits a block of supply, someone willing to sell at that price. Every time price arrives, that supply absorbs the buying and caps the move, behaving like a large sell order taking weeks to work through.
Underneath, buyers are no longer waiting for a discount. Each pullback is bought sooner, at a higher price than the last, and that impatience draws the rising trendline.
The pattern resolves when one side runs out. If supply at resistance is exhausted, buyers clear the ceiling. If buyers lose their nerve first, the rising trendline breaks and the structure fails downward. Both endings stay live the whole time the triangle forms.
The ascending triangle breakout, volume, and the measured move
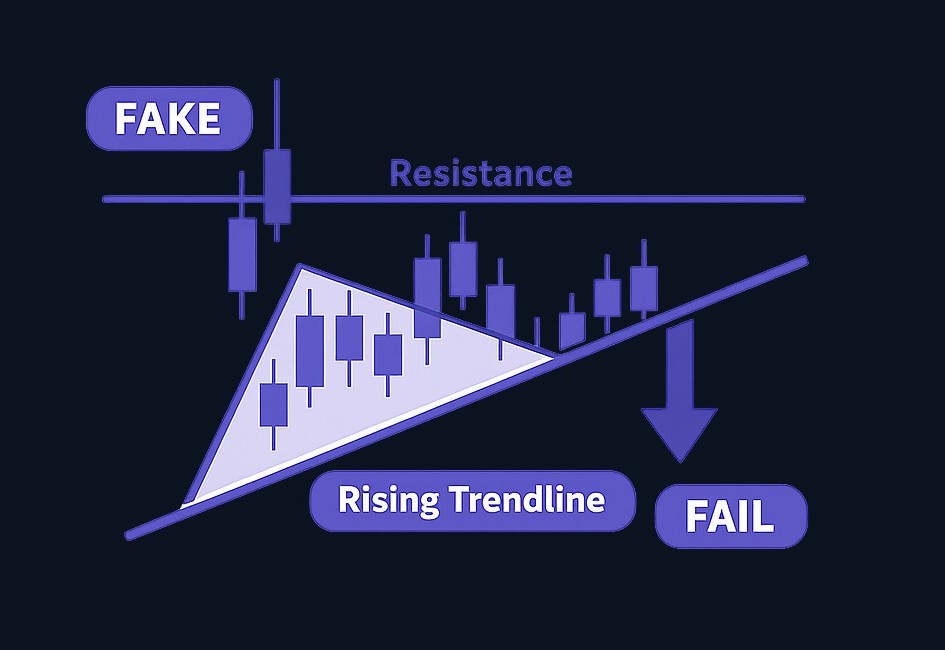
Confirmation is a close above the flat resistance, not a wick that pokes through and falls back. Most sources also want volume to expand on that candle, since a break on thin participation is the classic false breakout. Broken resistance frequently becomes new support, so a successful retest from above is a strong secondary confirmation.
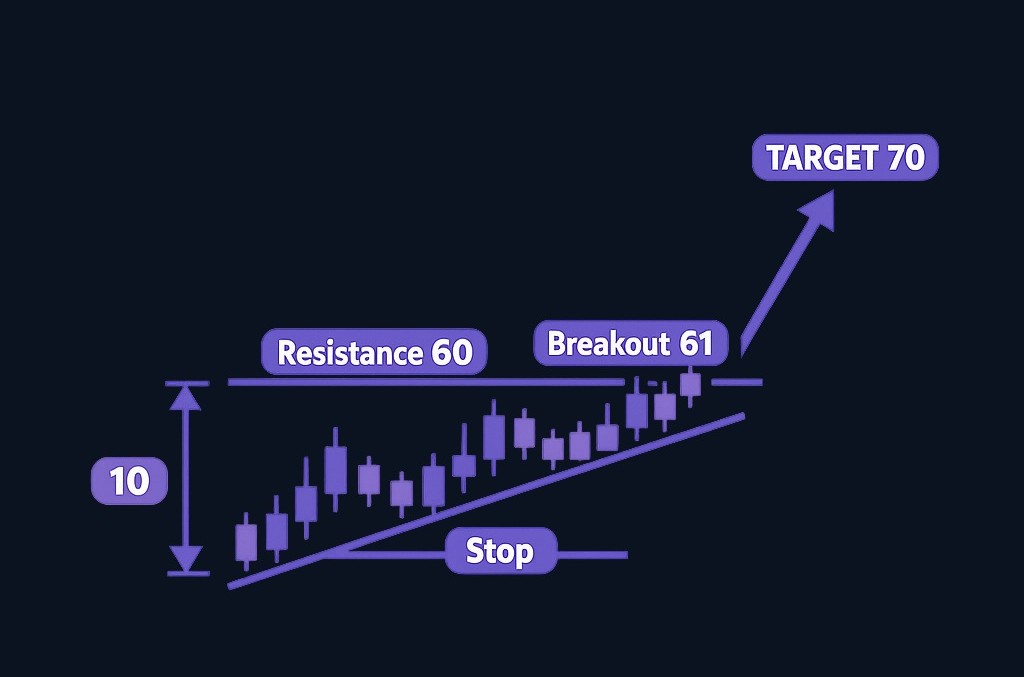
The target is projected with the measured move. Take the height of the widest part of the triangle and add it to the resistance level that was broken, not to the price your breakout candle happened to close at.
Here is an illustrative example. Say a stock in an uptrend keeps stalling at 60, touching that level three times, while its pullback lows come in at 50, then 54, then 57. The widest part of the triangle is the distance from the lowest of those lows up to resistance: 60 minus 50, which is 10. Price then closes at 61, confirming the break above the flat top. The projection is anchored to the broken resistance at 60, not to the 61 close, so 60 plus 10 gives a hypothetical target of 70. A common invalidation places the stop below the last higher low at 57.
Practice trading with Finelo
Practice in a simulator, learn with bite-sized lessons, and build confidence before risking real money.
Grade the setup before you act
The pattern is a starting point for a judgment, not a trigger. Before treating a triangle as a signal, score it.
| What to check | Stronger setup | Weaker setup | Why it matters |
|---|---|---|---|
| Trend context | Forming inside an uptrend | Forming inside a downtrend | The bullish reputation is built on the continuation case |
| Resistance touches | Three or more | Barely two | The more touches, the more meaningful the level |
| Rising lows | Clean higher lows on a tidy trendline | Lows that wander or run flat | A flat floor is not an ascending triangle |
| Upper line | Genuinely horizontal | Sloping upward | A rising top makes it a wedge or channel, not a triangle |
| Volume | Contracts into the build, expands on the break | Flat, or a breakout on thin participation | Thin breakouts are how false breakouts start |
| Position in the triangle | Breaks well before the apex | Coils all the way into the tip | Late apex breaks are considered less reliable |
| Confirmation | A close above resistance | An intrabar poke through the line | The close is the evidence, the wick is not |
| Invalidation | Defined, commonly below the last higher low | Not thought about | Know your exit before your entry |
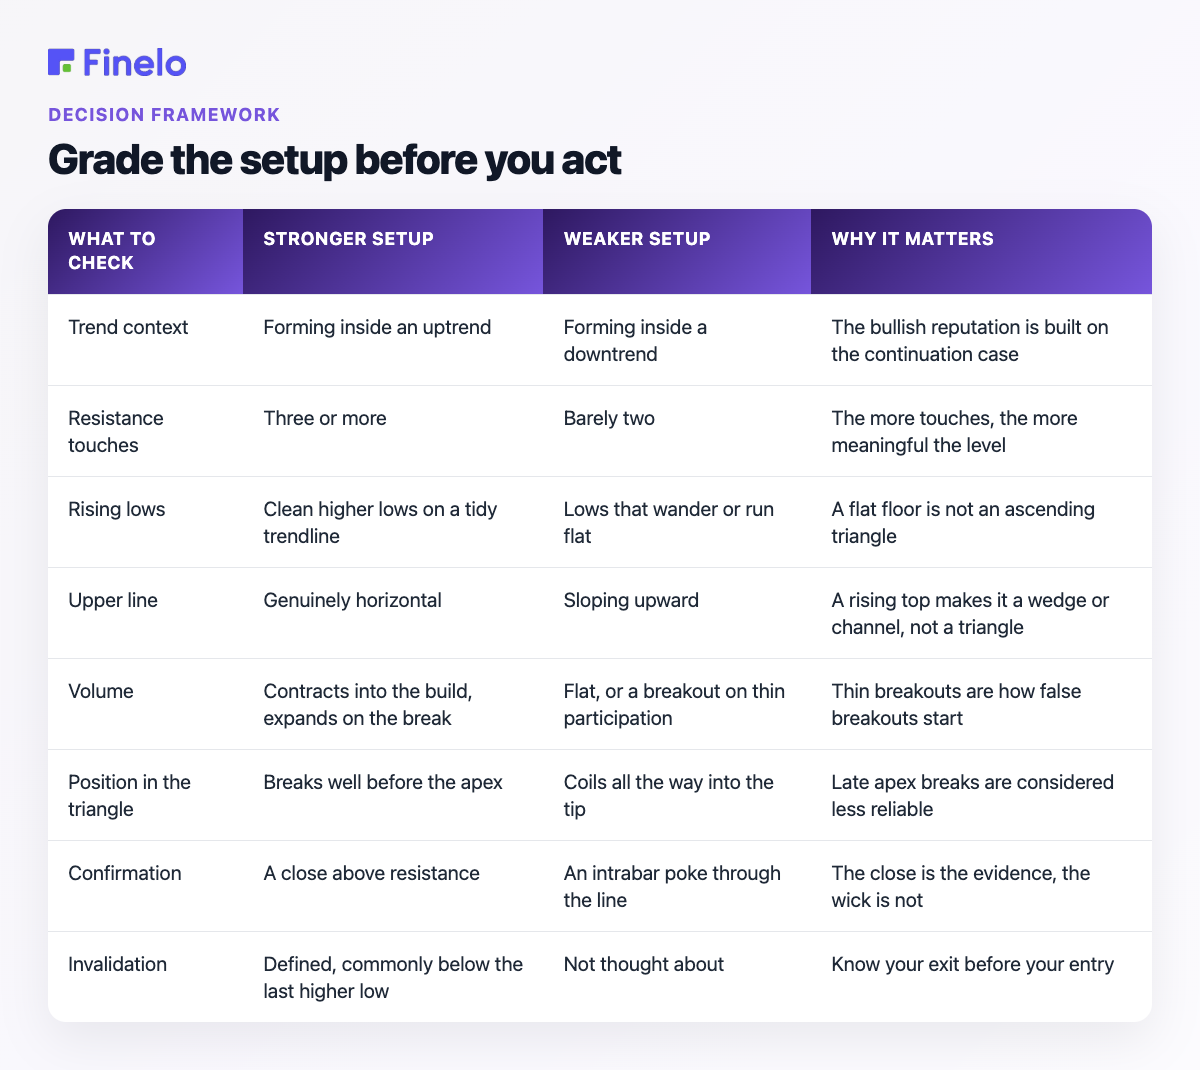
If several rows land on the weaker side, observing beats trading.
Ascending Triangle Evaluation Checklist
[ ] Flat horizontal resistance (not a rising top) [ ] Clean higher lows on a rising trendline [ ] Prefer three or more resistance touches [ ] Volume contracts into the coil [ ] Pattern forms inside a supportive uptrend (if claiming continuation) [ ] Breakout candle closes above resistance [ ] Volume expands on the break (ideal) [ ] Invalidation defined (often below the last higher low) [ ] Measured-move target calculated and checked against nearby resistance
Ascending vs descending vs symmetrical triangle
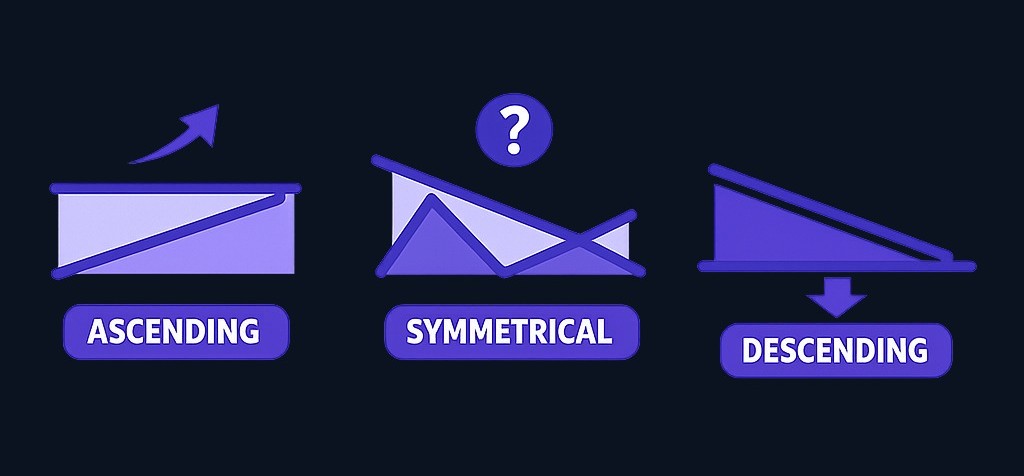
Three triangles, constantly mixed up, and the difference is entirely in the two lines.
| Triangle | Upper line | Lower line | Built-in bias |
|---|---|---|---|
| Ascending | Flat horizontal resistance | Rising higher lows | Bullish |
| Descending | Falling highs | Flat horizontal support | Bearish |
| Symmetrical | Falling highs | Rising lows | None, neutral until it breaks |
The symmetrical triangle is the instructive one. Both its lines converge, so there is nothing to lean on and you wait for the market to pick a direction. That contrast shows what the ascending triangle’s flat top is doing: it is what creates a bullish tilt before any breakout happens.
For the bearish sibling, see the descending triangle pattern guide.
How reliable is the ascending triangle pattern?
Somewhere between “useful” and “oversold,” and the gap is where most content on this topic lives. You will find pages calling it the highest win-rate pattern in chart analysis. Treat that as marketing, because published rankings of chart-pattern performance do not support a sure-thing reading. Treat secondhand “win rate” claims with caution unless you can verify the original study methodology.
What can be said with more confidence is where the pattern earns its keep. It is more compelling as a continuation inside a healthy uptrend, on liquid instruments, with several clean touches, and with volume contracting into the coil then expanding on the break. It is weaker in a downtrend, on thin-volume breakouts, and when resistance has been hammered so often the buying behind it may be spent.
A failed ascending triangle has a recognizable signature. Price pokes above the flat top intrabar, fails to close there, and slides back inside. Or it closes above on unconvincing volume and loses the level within a session or two. Or the rising trendline gives way first and the structure breaks downward, the outcome nobody puts in the tutorials.
Studying a failed pattern teaches more than studying the one that worked.
Common mistakes to avoid
Buying inside the triangle is the big one. While the pattern is still forming, both outcomes remain live, and an early entry bets on the resolution rather than responding to it.
Ignoring the trend is next. An ascending triangle inside a downtrend is not the same animal as one inside an uptrend, however identical the two lines look, and treating them alike borrows a reputation the chart has not earned.
Treating volume as optional is a third. A breakout with no participation behind it is a warning, not a green light, and the most common way a false breakout traps buyers.
The subtlest is target fixation. The measured move is easy to calculate and pleasant to look at, which makes it seductive. It says where price could go if the breakout holds, not where price is obliged to go.
Practice before you risk anything
If you are learning this pattern, do not start by hunting a live setup. Collect examples first: triangles that broke and ran, triangles that faked out above resistance, triangles that broke downward through the rising trendline, and wedges you mistook for triangles until you checked the top. Cover the future price action, judge each on what was visible at the time, then look at what happened.
Inside the Finelo app, you can study chart structure and practice buy, sell, and hold decisions on real market data with virtual funds. There are no deposits, no withdrawals, and no broker connection, it is a closed practice loop, so the only cost of a wrong read is the lesson. The Finelo trading simulator pairs that practice with short lessons and a review habit. For the candlestick literacy that sits underneath every one of these structures, start with what a doji candle is.
Final decisions are always yours. A pattern is a way of reading a chart, not a substitute for judgment.
Practice reading chart patterns in the Finelo app →
Finelo is an educational product, not a brokerage. The simulator uses virtual funds and real market data, and final trading and investing decisions are yours, made through your own brokerage account when you choose to act. This article is for education and is not financial advice.
Frequently asked questions
Is an ascending triangle bullish or bearish?
It is generally read as bullish, especially as a continuation inside an uptrend, because flat resistance and rising lows suggest buyers are gaining ground on fixed supply. It can appear after a downtrend as an attempted reversal, but that context is less reliable. The read is only valid after a confirmed breakout.
How do I confirm an ascending triangle breakout?
Wait for a candle to close above the flat resistance rather than wick through it, ideally with volume expanding. A retest of the broken resistance holding as new support is a strong secondary confirmation. A thin-volume break that slips back inside the triangle is a classic false breakout.
What is the measured-move target for an ascending triangle?
Measure the widest part of the triangle, from the lowest low up to the flat resistance, then add that distance to the broken resistance level itself, not to wherever the breakout candle closed. It is an educational guideline, not a prediction, and worth checking against any resistance in between.
How is an ascending triangle different from a descending or symmetrical triangle?
An ascending triangle has a flat top with rising lows and leans bullish. A descending triangle has a flat bottom with falling highs and leans bearish. A symmetrical triangle has a falling top and a rising bottom, so it carries no bias and you wait for the breakout.
How reliable is the ascending triangle pattern?
Conditional, and less reliable than the marketing suggests. It is stronger as a continuation inside an uptrend, on liquid instruments, with volume contracting into the coil and expanding on the break. It is weaker in downtrends and on thin-volume breakouts. Be skeptical of any quoted win rate without a sourced test.
ascending triangle patternchart patternstechnical analysistrading education
Practice trading with Finelo
Practice in a simulator, learn with bite-sized lessons, and build confidence before risking real money.
About the author
Finelo Team
The Finelo Team creates practical investing and trading education designed to help beginners learn faster with structured challenges, simulator practice, and bite-sized lessons.
Keep reading — Related articles

Chart Analysis
SMT Divergence Trading: Learn the Concept & Risk Controls
In trading, SMT stands for Smart Money Technique, and it is almost always discussed as SMT divergence. It is a concept from the ICT (Inner Circle Trader) framework that describes one specific moment: two markets that normally move together stop confirming each other.
Finelo Team
Chart Analysis
Price Action Cheat Sheet: Structure, Patterns, and Limitations
Price action is the study of changes in price, often using swing highs and lows, support and resistance, ranges, and candlestick formations.
Finelo Team
Chart Analysis
Order Block Trading: Learn the Concept & Risk Controls
An order block is a price zone that traders mark from the last candle pointing against a strong, impulsive move.
Finelo Team