A hammer candlestick is a single candle with a small real body near the top of its range, a long lower shadow, and little or no upper shadow. It forms when sellers push price well below the open during a session and buyers recover almost all of it before the close. When that candle appears after a downtrend, traders read it as a possible sign that selling pressure is fading. That is the whole claim. A hammer is a clue about what happened in one session, not a forecast of the next one, and on its own it is one of the weaker signals on a chart.
What Is a Hammer Candlestick? How to Read the Pattern on a Chart

A hammer candlestick is a single candle with a small real body near the top of its range, a long lower shadow, and little or no upper shadow. Learn how to read it after a downtrend, and why confirmation matters more than the shape.
10 min read
Practice trading with Finelo
Practice in a simulator, learn with bite-sized lessons, and build confidence before risking real money.
Want to learn more?
Practice in a simulator, learn with bite-sized lessons, and build confidence before risking real money.
Explore FineloExplore Finelo's 28-day challenges
Turn learning into a daily habit with guided challenge paths.
This guide is for beginners who keep meeting the hammer in trading videos and want the version with the caveats included. You will learn the anatomy, the psychology behind the long wick, whether color actually matters, how a hammer differs from its look-alikes, and why the reliability question has a more honest answer than most pages give.
The candle tells you what happened. It does not tell you what happens next.
What a hammer candlestick is
The hammer is a single-candle pattern, which is why it gets searched under so many names: hammer candle, hammer candlestick pattern, bullish hammer candlestick, hammer candlestick meaning. All point to one shape.
That shape only carries its usual meaning in one place. A hammer is defined partly by where it appears, so the same candle after a downtrend and after an uptrend get different names and opposite readings. After a decline, it is a hammer and the read is potentially bullish. After a rally, the identical shape is a hanging man and the read flips to potentially bearish. If you take one idea from this article, take that one: location is part of the definition, not context you add afterward.
The anatomy of a hammer candle
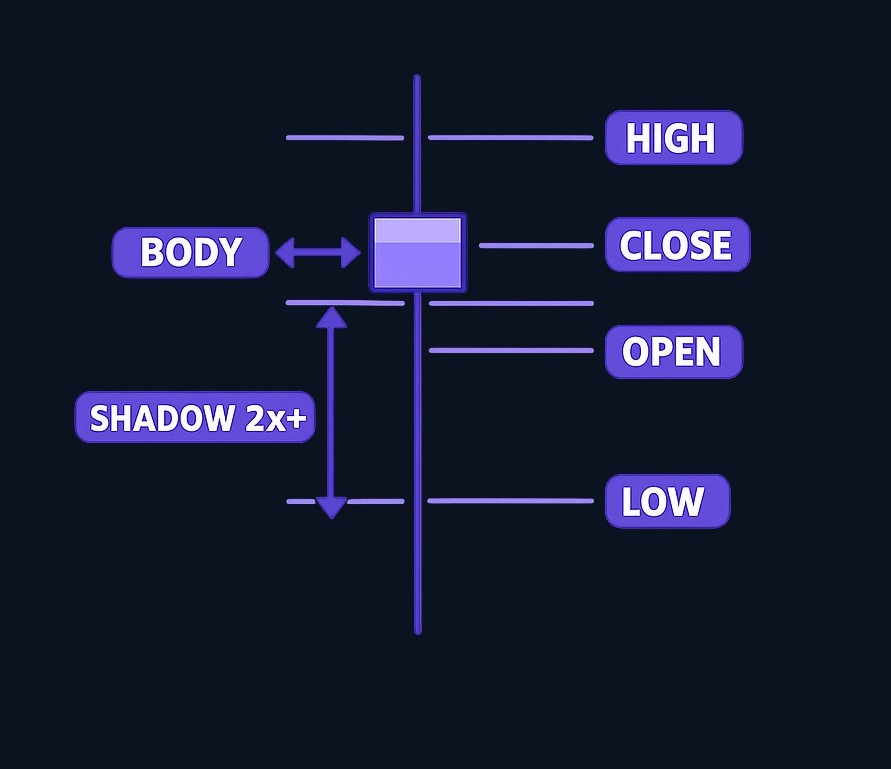
Every candle encodes four numbers: the open, the high, the low, and the close, usually shortened to OHLC. The hammer is a particular arrangement of those four.
The real body, the distance between the open and the close, is small and sits near the top of the candle's range. The lower shadow, the wick beneath the body, is long. Most references ask for it to run at least twice the length of the body, though this is a guideline rather than a rule, and sources vary on how strict to be. The upper shadow is small or absent, meaning price did not travel far above the open and close.
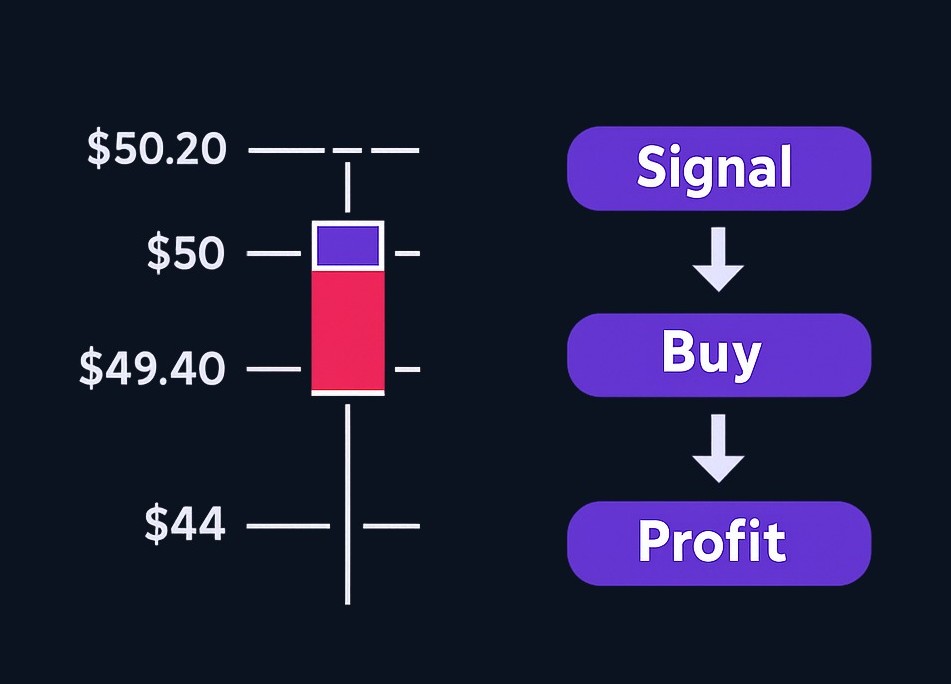
Here is an illustrative example, not a real trade. Say a stock opens at 50, ticks up to a high of 50.20, sells off to a low of 44, then recovers to close at 49.40. The body is 0.60, the lower shadow is 5.40, and the upper shadow is just 0.20. The lower wick runs roughly nine times the body, and the close sits near the top of the range. That is a textbook hammer. Note that it closed below its open, which makes it a red hammer, and it qualifies anyway.
The psychology behind the long lower shadow
The wick is the story. During the session, sellers were in control and drove price down hard. Then something changed. Buyers stepped in with enough conviction to lift price back near where it started, and the session closed with almost none of the decline intact.
That is what people mean by a rejection of lower prices. The market went down there, looked around, and came back. After a sustained downtrend, a session like that can suggest sellers are running out of fuel.
The honest qualifier is that one session of buying does not make a trend. Sellers can regroup. What you have is a single candle's worth of evidence that the balance may be shifting, which is why most sources treat the next candle, not the hammer, as the thing that matters.
Does the color of a hammer candlestick matter?
Less than most beginners expect. A green hammer candlestick closed above its open, so buyers recovered the session and then some. A red hammer candlestick closed slightly below its open, so buyers recovered most of the drop but not all. Both are valid hammers after a downtrend. The green one is sometimes read as marginally stronger, and that is about the size of the difference.
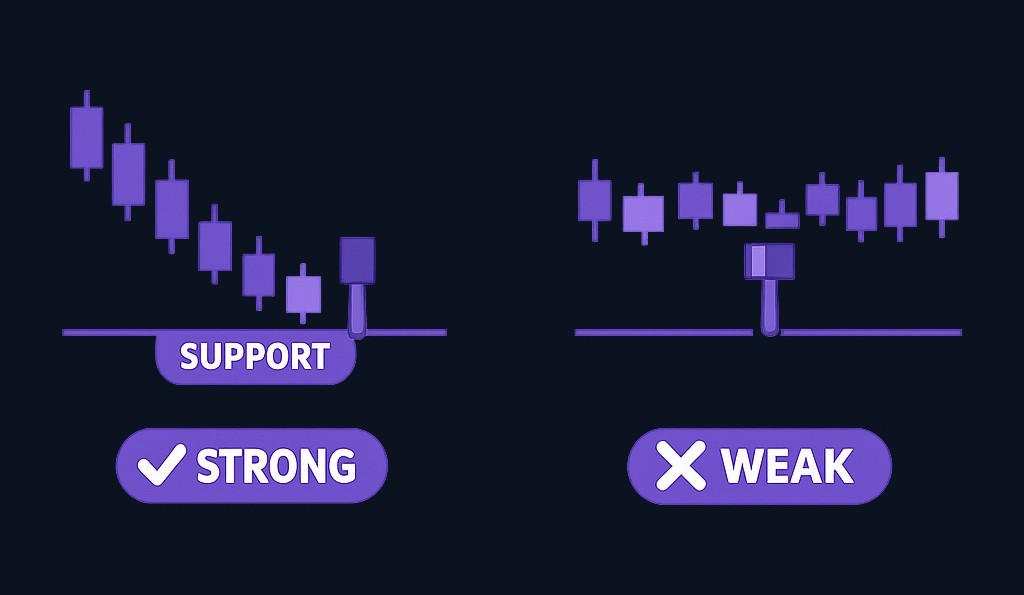
Shape and location do the real work. A red hammer at a well-tested support level after a long decline says more than a green hammer floating mid-range.
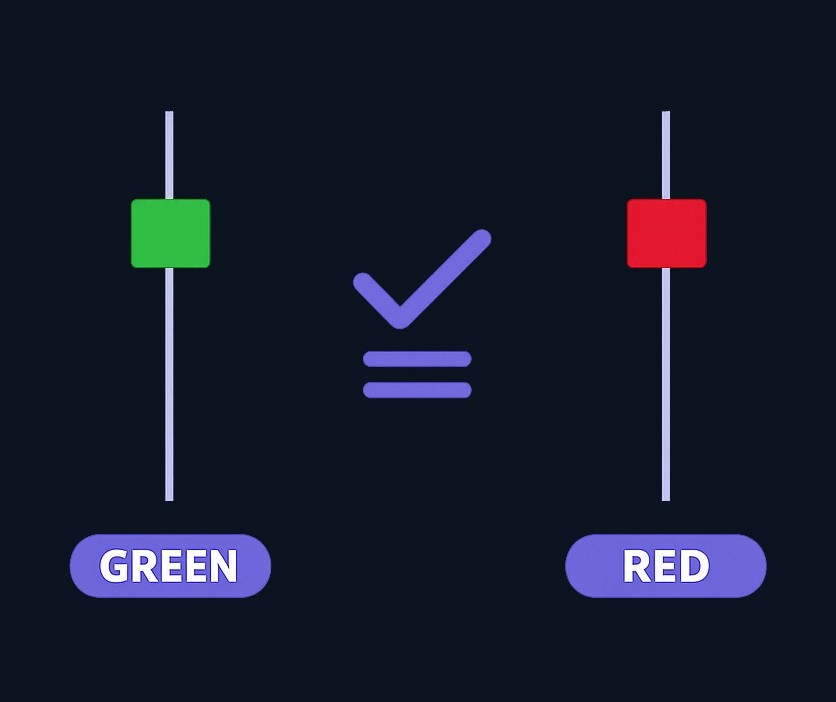
One term causes genuine confusion and is worth naming. Bearish hammer candlestick is not a standard pattern. People use it to mean one of two different things: sometimes a red hammer, which is still a bullish-leaning candle, and sometimes a hanging man, which is the hammer shape after an uptrend and carries the opposite meaning. If you see the phrase, find out which one is meant before you act on anything.
Context decides what a hammer means
The same candle is meaningful or meaningless depending on what surrounds it. Before treating a hammer as a signal, grade it.
| What to check | Stronger context | Weaker context | What to do |
|---|---|---|---|
| Prior trend | A clear, sustained downtrend | A choppy range, or an uptrend (that is a hanging man) | Without a decline to reverse, the candle means little |
| Location | At support, or a level price reacted to before | Floating in the middle of nowhere | Mark your levels before the candle appears |
| Shape | Long lower wick, small body, minimal upper wick | A short wick you have to squint at | If you are debating whether it qualifies, it does not |
| Volume | Above average participation | A quiet, thin session | Treat low participation as a caution |
| Confirmation | Next candle closes above the hammer's high | You are acting on the hammer alone | Wait, or study it as an example instead |
| Timeframe | Daily or higher | A one-minute chart | Short timeframes manufacture hammer shapes constantly |
| Invalidation | You know what would prove the read wrong | You have not thought about it | Commonly a close below the hammer's low |
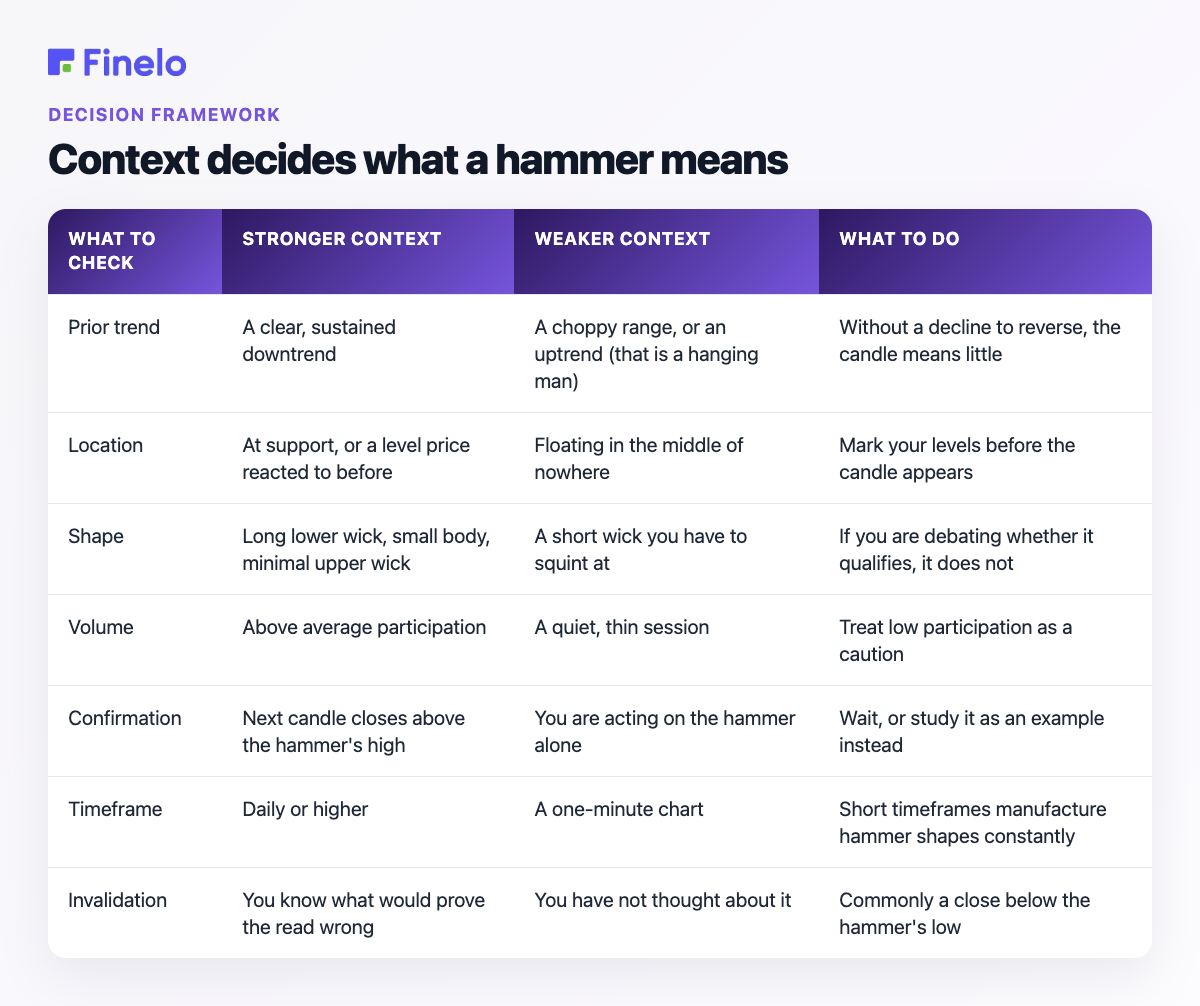
If several rows land on the weaker side, the useful move is to observe, not to act.
Practice trading with Finelo
Practice in a simulator, learn with bite-sized lessons, and build confidence before risking real money.
Hammer vs inverted hammer vs hanging man vs doji
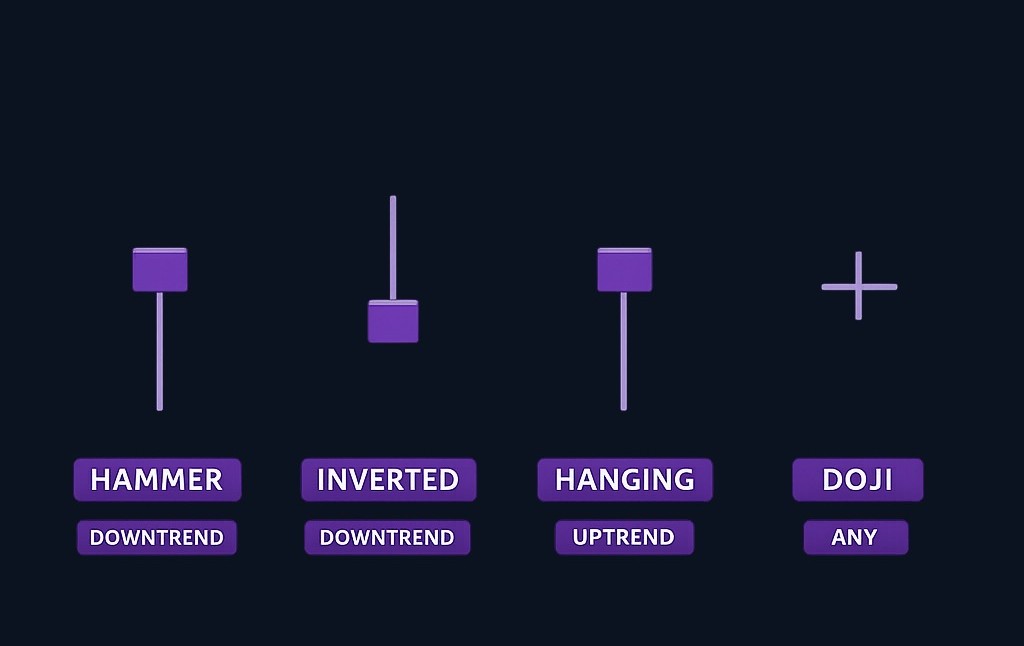
These four get mixed up constantly, though the differences are not subtle once laid out. Two share a shape and differ only in location.
| Candle | Shape | Where it appears | Common reading |
|---|---|---|---|
| Hammer | Small body at the top, long lower shadow | After a downtrend | Potentially bullish |
| Hanging man | Identical to the hammer | After an uptrend | Potentially bearish |
| Inverted hammer | Small body at the bottom, long upper shadow | After a downtrend | Potentially bullish, usually treated as weaker |
| Doji | Almost no real body, open and close nearly equal | Anywhere | Indecision, meaning depends entirely on context |
The hammer and hanging man are the same candle wearing different hats, which is the clearest possible proof that shape alone is not a signal. The inverted hammer flips the wick to the top. If you want the fuller treatment of the fourth row, see what a doji candle is.
How reliable is a hammer candlestick?
Modest at best on its own, and this is where most pages go quiet. The label says bullish reversal. Statistical testing of candlestick patterns has repeatedly found that such labels predict behavior far less well than the names imply, and the inverted hammer is the documented cautionary case: tested data has it resolving as a bearish continuation more often than as the bullish reversal it is sold as.
The standard hammer has no verified figure here either way, which is itself the point. Anyone quoting a success rate owes you the market, the timeframe, the sample size, the confirmation rule, and the costs assumed. Without those, a percentage is decoration.
A hammer tends to carry more weight after a sustained decline, at a level price has respected before, on a higher timeframe, and with meaningful volume behind it. It carries very little in the middle of a range, on very short timeframes, or in thin sessions. Around major news, wicks stretch for reasons that have nothing to do with the pattern.
A pattern named for a reversal is not the same as a pattern that reverses.
Common mistakes to avoid
The most common one is acting on the candle instead of the confirmation. A hammer describes a session that has already closed. It says nothing about what the next session must do, and entering immediately often means buying a pause, not a turn.
Ignoring the preceding trend is next. Without a decline in front of it, the shape is not doing the job the name implies, and in a choppy range these candles appear constantly and contradict each other.
Fixating on color is a beginner tax. Whether the body is red or green is a footnote next to the wick, the location, and the follow-through. A related error is chasing the phrase "double hammer candlestick," meaning two hammers in a row: the second changes nothing about the need for confirmation.
The subtlest mistake is cherry-picking. Most hammers you meet online were chosen because they worked. Scroll historical charts with the future price action hidden, judge each candle on what was visible at the time, and record the misses as carefully as the hits. Decision quality comes from studying the failures, not from collecting the wins.
Practice before you risk anything
If you are learning this pattern, do not start by hunting a live trade. Collect examples first: hammers that marked real turning points, hammers that failed and let price keep falling, and hanging men that only looked like hammers until you checked the trend. Judge each one before you look at what happened next. That habit builds chart literacy faster than any checklist.
Inside the Finelo app, you can study candle structure and practice buy, sell, and hold decisions on real market data with virtual funds. There are no deposits, no withdrawals, and no broker connection, it is a closed practice loop, so the only cost of a wrong read is the lesson. The Finelo trading simulator pairs that practice with short lessons and a review habit.
Final decisions are always yours. A candle is a prompt to think, not a substitute for thinking.
Practice reading candlestick patterns in the Finelo app →
Where to learn more
For related candle patterns, see what a doji candle is and the shooting star candlestick. Finelo also publishes educational material for beginners; you can check Finelo reviews, the About Finelo page, or the Finelo support center.
Finelo is an educational product, not a brokerage. The simulator uses virtual funds and real market data, and final trading and investing decisions are yours, made through your own brokerage account when you choose to act. This article is for education and is not financial advice.
Frequently asked questions
What does a hammer candlestick mean?
It means price fell well below the open during a session, then recovered to close near it, leaving a long lower wick. After a downtrend, that is read as a possible sign that selling pressure is fading. On its own it is a weak clue, judged alongside trend, support, volume, and the next candle.
Is a hammer candlestick bullish or bearish?
A hammer after a downtrend is read as potentially bullish. The identical shape after an uptrend is called a hanging man and is read as potentially bearish. The prior trend, not the shape, decides the interpretation, which is why "bearish hammer" is such a confusing term.
What is the difference between a hammer and an inverted hammer?
A hammer has a small body near the top with a long lower shadow. An inverted hammer flips it: a small body near the bottom with a long upper shadow. Both appear after downtrends and read as potentially bullish, but the inverted hammer is usually treated as weaker.
Does the color of a hammer candlestick matter?
Not much. A green hammer closed above its open and is sometimes read as slightly stronger. A red hammer closed marginally below its open and can still be perfectly valid if the long lower shadow and the downtrend context are there. Shape and location outrank color.
How reliable is the hammer candlestick pattern?
Modest on its own, and prone to false signals. It depends on the prior trend, the location, the timeframe, the volume, and whether the next candle confirms it. Be skeptical of any exact success rate quoted without a defined market, timeframe, sample size, and confirmation rule.
hammer candlestickcandlestick patternschart analysistrading education
Practice trading with Finelo
Practice in a simulator, learn with bite-sized lessons, and build confidence before risking real money.
About the author
Finelo Team
The Finelo Team creates practical investing and trading education designed to help beginners learn faster with structured challenges, simulator practice, and bite-sized lessons.
Keep reading — Related articles

Chart Analysis
What Is VWAP? Volume-Weighted Average Price Explained
VWAP stands for volume-weighted average price: the average price a security has traded at over a period, usually one trading session, with each price weighted by the volume that traded there.
Finelo Team
Chart Analysis
What Is MACD? How to Read Momentum With Moving Averages
MACD, short for Moving Average Convergence Divergence, is a momentum indicator built from two moving averages of price.
Finelo Team
Chart Analysis
What Is the Three White Soldiers Pattern? How to Read It on a Chart
Three white soldiers is a bullish candlestick pattern made of three consecutive long-bodied up candles that step higher like a staircase.
Finelo Team