
Implied volatility (IV) is the market's estimate of how much a security's price might move in the future, worked backward out of the prices people are paying for its options. When traders expect bigger moves, they pay more for options, and that higher price implies higher volatility. When they expect calm, options get cheaper and implied volatility falls. The one point beginners miss most often: IV describes the expected size of a move, not its direction. High IV does not tell you whether price will rise or fall, only that a larger swing is being priced in.
What Is Implied Volatility? A Beginner's Guide to IV in Options
Implied volatility (IV) is the market's estimate of how much a security's price might move, derived from option prices. Learn how IV affects premiums, how it differs from historical volatility, what IV crush means, and common beginner mistakes.
11 min read
Practice trading with Finelo
Practice in a simulator, learn with bite-sized lessons, and build confidence before risking real money.
Want to learn more?
Practice in a simulator, learn with bite-sized lessons, and build confidence before risking real money.
Explore FineloExplore Finelo's 28-day challenges
Turn learning into a daily habit with guided challenge paths.
This guide is for beginners who keep seeing "IV" in options discussions and want a plain explanation of what it is, how it affects option prices, and how it differs from historical volatility. You will also learn what "IV crush" means, why high IV is not automatically good or bad, and where the number comes from. The goal is understanding, not a trading signal: options are higher-risk instruments, and IV is groundwork, not a shortcut to profit.
If you are still learning the basics of calls, puts, premiums, and expiration, start with options trading for beginners and return here for the volatility layer.
Implied volatility tells you how big a move is priced in, never which way it will go.
What Implied Volatility Actually Measures
Volatility just means how much a price moves around: a calm stock has low volatility; one that swings sharply day to day has high volatility. Implied volatility points that idea forward: it is the volatility the market is currently pricing in for the future, expressed as an annualized percentage. The best-known example is the VIX, an index that tracks the implied volatility of the broad U.S. market and is often called the market's "fear gauge."
To see where it lives, split an option's price in two. Whether it is a call or a put, intrinsic value is how much the option is already in the money against its strike price. Everything above that is extrinsic value, sometimes called time value: what buyers pay for the possibility that price moves in their favor before expiration. Implied volatility sits inside that extrinsic value, so the more movement the market expects, the higher the premium climbs. That is why two stocks at the same price can have very differently priced options.
How Implied Volatility Affects Option Prices
The core relationship is simple: higher implied volatility means more expensive options, and lower implied volatility means cheaper options, all else being equal. More expected movement raises the chance an option finishes in the money, so buyers pay more and sellers demand more to take the other side.
The sensitivity of an option's price to a change in IV has its own name among the option "Greeks": vega, which measures how much a premium moves for a one-point change in IV. A high-vega option gains value when IV rises and loses value when IV falls, independent of the underlying price. This is the surprising part for beginners: an option can lose value even when the stock moves the way you hoped, if a drop in IV pulled enough extrinsic value out of the price.
Consider a hypothetical example, with round numbers for illustration only. A calm stock has an at-the-money call trading at $2.00. A major announcement is scheduled, the market starts expecting a big move, and implied volatility rises. That same call might now trade at $3.50 even though the stock has not moved at all. Nothing about the company changed in that moment; only the market's expectation of movement did.
Implied Volatility vs Historical Volatility
These two get confused constantly, but the difference is one word: forward or backward. Implied volatility is what the market expects next. Historical volatility, also called realized volatility, measures what already happened.
| Feature | Implied volatility (IV) | Historical volatility (HV) |
|---|---|---|
| Direction in time | Forward-looking expectation | Backward-looking measurement |
| Source | Derived from current option prices | Calculated from past price moves |
| What it tells you | How much movement the market expects | How much the security actually moved |
| Changes when | Expectations and sentiment shift | New price history accumulates |
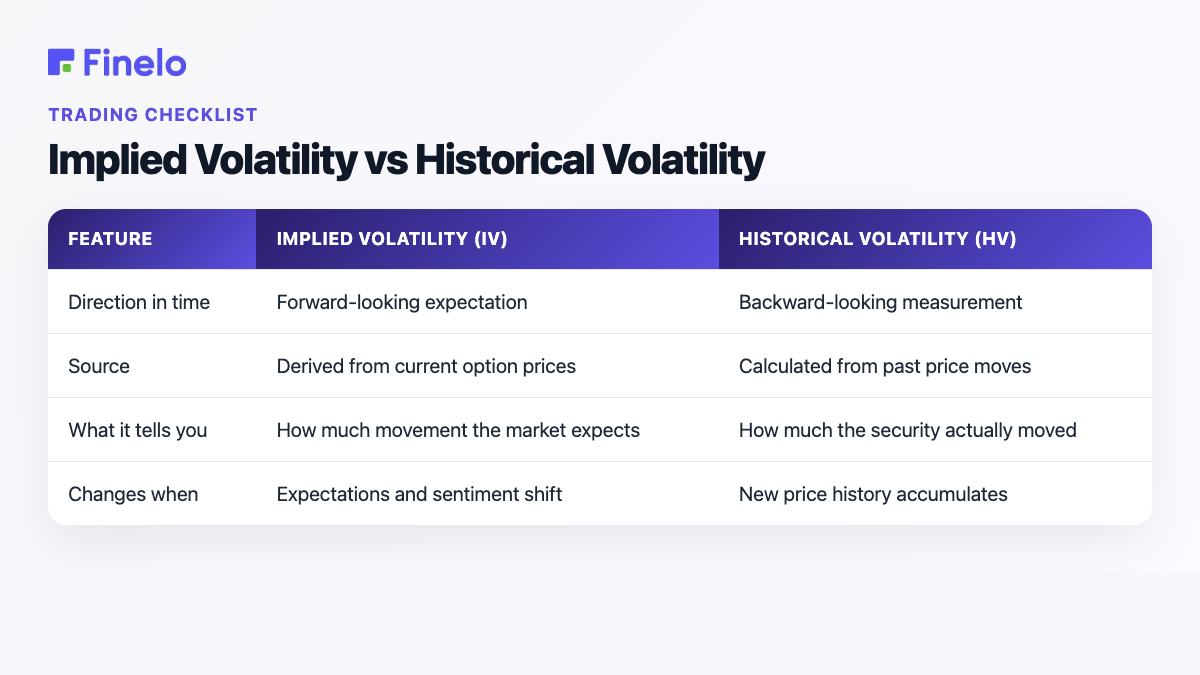
Traders often compare the two for context. When implied volatility sits high relative to what a stock has actually been doing, options look relatively expensive; when it sits low relative to history, they look cheap. Treat that as background, not a green light: framing a high-versus-low reading as a guaranteed edge is exactly the thinking that gets beginners into trouble, since expectations are often wrong in both directions.
High IV vs Low IV, and IV Rank
"High" and "low" only mean something in context. An IV of 40% might be routine for a fast-moving stock and extremely high for a broad market index. That is why traders lean on IV rank (implied volatility rank) and IV percentile, which place today's reading against that security's own recent history.
IV rank measures where current IV sits within its high-low range over roughly the past year; IV percentile measures the share of trading days in that window when IV was lower than now. A single past spike can distort IV rank for months — one reason percentile is often treated as the steadier gauge. An implied volatility chart plots that figure over time, and because IV tends to drift back toward its typical range (mean reversion), an unusually high or low reading is often temporary rather than a new normal.
The table below maps what high and low IV mean, described neutrally rather than as advice.
| Feature | High IV | Low IV |
|---|---|---|
| Market expectation | Larger moves anticipated | Calmer conditions anticipated |
| Option premiums | More expensive | Cheaper |
| Relevant to buyers | Expensive premium: a larger move is needed just to break even | Cheaper premium and a nearer breakeven, but smaller moves are expected |
| Relevant to sellers | Collecting richer premium, with more risk if the move arrives | Collecting thinner premium |
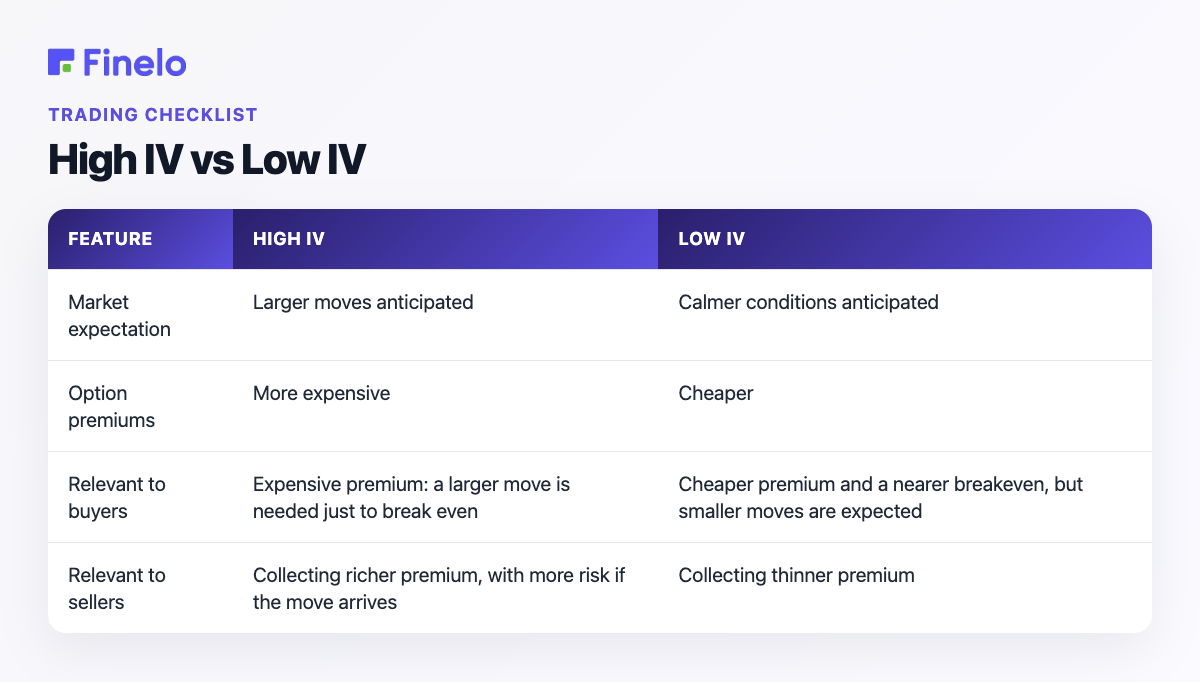
Whether high or low IV is "good" depends on what someone is doing and their risk tolerance, which is why a general guide should not answer it for you. Some traders discuss selling options when IV looks rich, or buying when it looks cheap, but those are risky ideas rather than reliable setups, and none of it changes the fact that IV never tells you direction.
Context turns an IV number into information.
Practice trading with Finelo
Practice in a simulator, learn with bite-sized lessons, and build confidence before risking real money.
IV Crush: Why Options Can Lose Value After Earnings
One of the most common and expensive surprises for new options traders is "IV crush." Before a scheduled event like an earnings report, uncertainty runs high, so implied volatility rises and options get expensive. There is even a mechanical reason it climbs: as the date nears, the same expected move is packed into fewer days, pushing the annualized figure up. Once the report is out and uncertainty resolves, IV drops sharply and the extrinsic value in those options can collapse almost immediately.
The painful part is that this can happen even when you guessed direction correctly. If you bought an expensive pre-earnings option and the stock moved your way but by less than the market had priced in, the crush can erase more value than the favorable move added. The key lesson is that IV, not just direction, drives option prices — and it is a big reason many experienced traders avoid simply buying options right before a known event.
The Limits of Implied Volatility
It helps to be clear about what IV is not. It is not a prediction of direction: a stock with sky-high IV is not "going up" or "going down"; it is simply expected to move a lot either way. It is not a guarantee of magnitude either. IV is the market's current expectation, and expectations are often wrong, so realized movement can land far above or far below what IV implied.
IV is also model-derived, which shapes how much weight it deserves. The standard approach takes the market price of an option and solves a pricing model, such as Black-Scholes, backward to find the volatility figure that fits. That makes IV a reflection of current supply and demand as much as a pure forecast: when people rush to buy protection, IV can spike even with no change in the underlying business.
One common way to read it is as a range. An annualized IV can be scaled down to a rough one-standard-deviation "expected move" for a shorter period: the band that price is expected to stay within about two-thirds of the time. Useful as a gauge, not a crystal ball.
Where Implied Volatility Comes From and Where to Find It
Because IV is derived from live option prices, it is quoted per security and changes constantly through the trading day. Brokerage platforms and options-analysis tools display it on the option chain, often alongside IV rank or percentile and an expected-move figure. This page intentionally shows no live numbers: a current IV reading for any specific stock, index, or crypto is real-time data that belongs on a live platform, not in an evergreen explainer.
So if you are looking up the current IV for a particular ticker, that is a data question for your broker or a dedicated options tool. What this page gives you is the understanding to interpret that number once you find it — which is what "implied volatility meaning" and "options implied volatility" both come down to: the expected-movement figure baked into option prices.
Common Mistakes Beginners Make With IV
A few mistakes recur:
- Treating high IV as a directional signal. It only says a bigger move is expected either way, so buying options just because IV is high, or assuming a high-IV stock will rise, misreads the number.
- Ignoring IV crush around earnings. Being surprised when an expensive option loses value even on a correct directional call is one of the most common beginner losses.
- Missing context. Confusing implied with historical volatility, or reading "high IV" in absolute terms when a level that is high for one security is ordinary for another.
- Treating IV as a strategy. Because options are leveraged and time-sensitive, treating any IV reading as a reliable profit setup is risky. IV is a lens for understanding option prices, not a strategy on its own.
Practice Before You Trade Options
If you are still learning how options are priced, do not start on a live chart with real money. Get comfortable reading IV, IV rank, and the expected move on real option chains first, and watch how they behave in the days around scheduled events, long before risking anything.
Continue with options trading for beginners for contract mechanics, and OTM meaning if you need a clearer read on moneyness. Finelo focuses on investment learning and financial education (Finelo). Final decisions are always yours. Implied volatility is a tool for thinking more clearly about option prices, not a substitute for judgment.
This material is educational and is not personalized financial, legal, or tax advice. Options involve significant risk and are not suitable for everyone.
Frequently asked questions
What is implied volatility?
Implied volatility is the market's estimate of how much a security might move in the future, derived from the prices of its options. When options are expensive, IV is high, meaning larger moves are expected; when options are cheap, IV is low. It reflects the expected size of a move, not its direction.
How does implied volatility affect option prices?
Higher implied volatility raises option premiums and lower IV lowers them, all else being equal, because more expected movement makes an option more likely to pay off. An option's sensitivity to IV is called vega. This is why an option can gain or lose value from an IV change even when the underlying barely moves.
What is the difference between implied and historical volatility?
Implied volatility is forward-looking: it is the movement the market expects, derived from current option prices. Historical, or realized, volatility is backward-looking, measuring how much the security actually moved in the past. Traders compare the two to judge whether options look relatively expensive or cheap.
Is high implied volatility good or bad?
Neither on its own, which is why it is not something to answer with a rule of thumb. High IV means expensive options and larger expected moves; low IV means the opposite. It depends entirely on what you are trying to do and your risk tolerance. Understanding the number matters more than labeling it.
What is IV crush?
IV crush is the sharp drop in implied volatility right after a scheduled event, such as an earnings report. Uncertainty pushes IV up beforehand, making options expensive; once the news is out, IV falls quickly and the extrinsic value in those options collapses. This can cause losses even when the direction was right.
Can I see the current implied volatility for a specific stock here?
No. A live IV reading for a particular stock, index, or crypto is real-time data that changes constantly and belongs on a brokerage platform or options tool, not in an educational article. This page explains what IV means so you can interpret that number once you look it up.
TradingOptionsBeginnerVolatility
Practice trading with Finelo
Practice in a simulator, learn with bite-sized lessons, and build confidence before risking real money.
About the author
Finelo Team
The Finelo Team creates practical investing and trading education designed to help beginners learn faster with structured challenges, simulator practice, and bite-sized lessons.
Keep reading — Related articles
Trading
Options Trading for Beginners: A Plain-English Guide to How Options Work
A beginner's guide to options trading: what options are, how calls and puts work, key terms like strike, premium, and expiration, the risks, and how to start learning safely.
Finelo Team
Trading
What is Swing Trading? A Complete Guide
Swing trading is a short-term approach in which a trader holds a position for several days or weeks while trying to capture part of a price move. The goal is not to predict every fluctuation. It is to identify a…
Finelo Team
Trading
What is Slippage in Trading?
Slippage in trading is the gap between the price you expected when placing a trade and the price at which it is ultimately executed. The U.S. Securities and Exchange Commission describes price slippage as the…
Finelo Team