The national gasoline average moved sharply higher in September, but the most useful number depends on exactly what is being measured.
U.S. Gas Prices Reach $4.46: What the Increase Means for Inflation and Household Costs
The EIA's U.S. all-grades gasoline average reached $4.455 per gallon. See what changed, why regions differ and how fuel prices affect inflation.
6 min read
Practice trading with Finelo
Practice in a simulator, learn with bite-sized lessons, and build confidence before risking real money.
Want to learn more?
Practice in a simulator, learn with bite-sized lessons, and build confidence before risking real money.
Explore FineloExplore Finelo's 28-day challenges
Turn learning into a daily habit with guided challenge paths.
The U.S. Energy Information Administration, or EIA, reported a weekly all-grades average of $4.455 per gallon for September 14, 2026. That was up from $4.295 one week earlier and $4.207 on August 31.
Rounded to the nearest cent, the EIA figure was $4.46 per gallon. It covers all gasoline grades and includes taxes. Daily reports for regular gasoline may show a different number, so the grade, date, and methodology should always appear beside a headline price.
Data check: Prices and petroleum data were reviewed on September 18, 2026. Fuel prices vary by day, grade, station, and location. This article provides education, not individualized financial advice.
How large was the increase?
The EIA's national all-grades series rose by 16 cents per gallon in one week, an increase of about 3.7%. Compared with August 31, the increase was 24.8 cents, or about 5.9%.
For a simple illustration, a 15-gallon fill-up at $4.455 costs about $66.83. At the September 7 average, the same volume would have cost about $64.43. The difference is approximately $2.40 per fill-up.
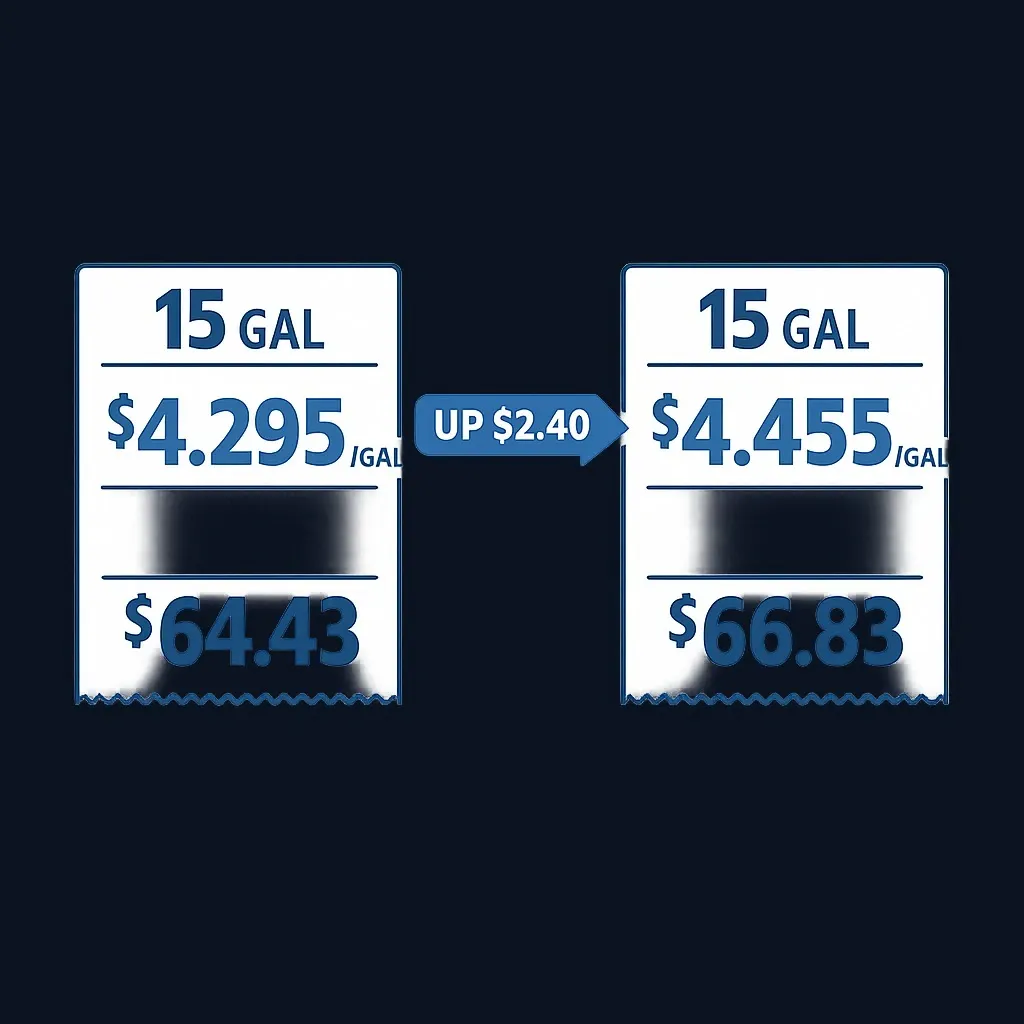
That example is arithmetic, not a forecast of any household's spending. Actual costs depend on fuel grade, vehicle efficiency, mileage, and local prices.
The national average hides a wide regional range
EIA data for September 14 show why a single national figure may not resemble the price on a particular street:
| Area | All-grades average per gallon |
|---|---|
| United States | $4.455 |
| Gulf Coast | $3.953 |
| Midwest | $4.183 |
| East Coast | $4.307 |
| Rocky Mountain | $4.575 |
| West Coast | $5.597 |
| California | $5.936 |
Regional differences can reflect state taxes, fuel specifications, refinery and pipeline access, distribution costs, and local supply conditions. The West Coast is relatively isolated from major refining centers elsewhere in the country, while the Gulf Coast sits near a large share of U.S. refining capacity.
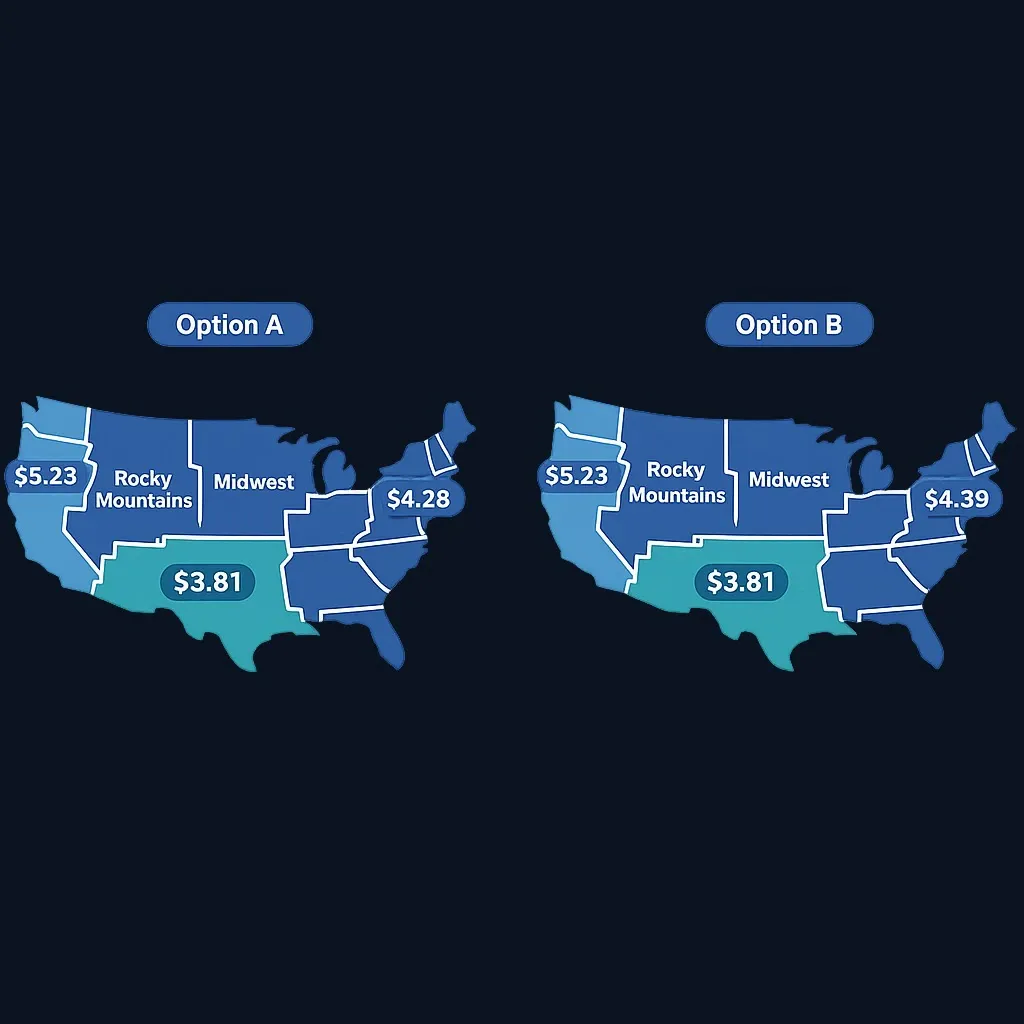
The table uses the same EIA product definition throughout. Mixing it with a regular-only daily series would create an inaccurate comparison.
What does the latest supply report show?
No single weekly statistic fully explains a retail-price move. The EIA's petroleum report for the week ending September 11 provides useful context:
- U.S. refineries processed 17.3 million barrels per day, down 256,000 barrels per day from the previous week.
- Gasoline production averaged 9.6 million barrels per day.
- Total motor-gasoline inventories rose by 0.8 million barrels but remained 5% below the five-year average.
- Four-week average gasoline product supplied was 8.8 million barrels per day, 1.0% below the comparable year-earlier period.
The combination is more nuanced than “demand went up” or “supply went down.” Inventories increased during the week, yet remained low relative to their five-year range. Refinery throughput also declined from the prior week. Retail prices can additionally reflect earlier changes in wholesale gasoline, crude oil, transportation, and local market conditions.
For the distinction between crude benchmarks and finished fuel, see WTI vs. Brent. Finelo's diesel and crack-spread explainer covers how refining economics can cause fuel prices to move differently from crude.
Practice trading with Finelo
Practice in a simulator, learn with bite-sized lessons, and build confidence before risking real money.
Why gasoline matters for inflation
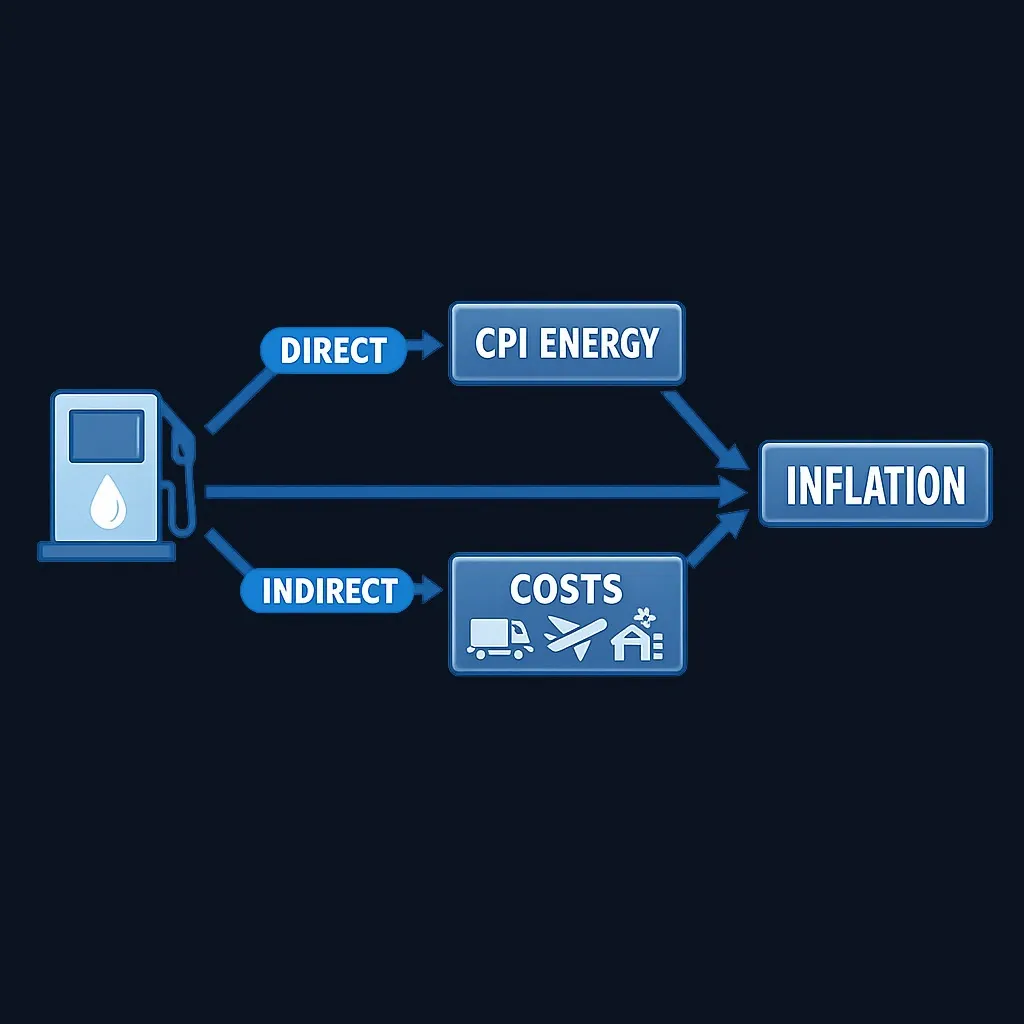
Gasoline affects inflation in two ways.
The direct effect appears in the energy component of the Consumer Price Index. The Bureau of Labor Statistics reported that its gasoline index rose 3.9% in August, accounting for more than one-third of that month's increase in the all-items CPI.
The indirect effect can appear through delivery, commuting, airline, agricultural, and business operating costs. Those costs do not automatically pass through to consumers, and any pass-through can arrive with a delay.
Energy prices are also volatile. A gasoline-driven increase in one monthly inflation report does not, by itself, establish a lasting inflation trend. Policymakers and investors typically compare headline inflation with measures that remove food and energy to see whether price pressure is broadening. Our primer on what inflation is and how it is measured explains that distinction.
What households can learn from the headline
The increase is real, but the national average is not a personal budget.
A more useful household calculation starts with gallons purchased rather than the headline alone:
Monthly fuel cost = gallons used × local price per gallon
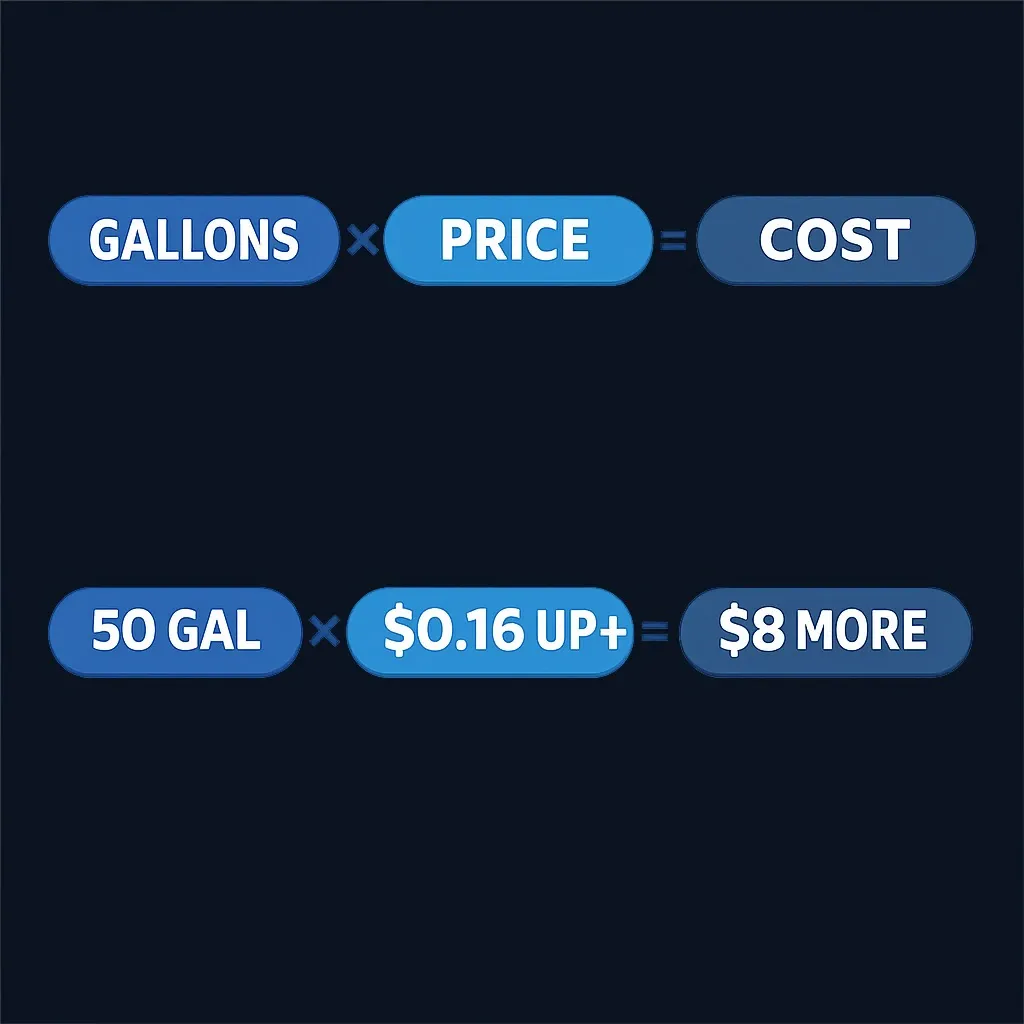
If a household uses 50 gallons per month, a 16-cent increase adds approximately $8 to monthly fuel spending. The calculation helps separate the emotional impact of a large national headline from the actual cash-flow effect for a particular driving pattern.
The practical takeaway
The EIA's verified all-grades average reached $4.455 per gallon for the week of September 14, up 16 cents in one week. Regional prices ranged widely, and inventories remained below their five-year average even after increasing during the latest reporting week.
The number matters for household cash flow and inflation, but it should be labeled precisely. “Regular,” “all grades,” “daily,” and “weekly” describe different measurements—and using the wrong label can change the story.
Finelo does not provide financial advice. This article is for informational and educational purposes only. Prices and economic data may be revised or change after publication.
Primary sources: EIA — weekly retail gasoline prices, EIA — Weekly Petroleum Status Report, BLS — Consumer Price Index, August 2026
Secondary story reference: Yahoo Finance/USA Today — U.S. gasoline-price update
Frequently asked questions
What was the U.S. average gasoline price in mid-September 2026?
The U.S. Energy Information Administration reported an all-grades average of $4.455 per gallon for the week of September 14, 2026.
How quickly did gas prices increase?
The EIA all-grades average rose from $4.295 on September 7 to $4.455 on September 14, an increase of 16 cents per gallon in one week.
Why do EIA and AAA gasoline prices sometimes differ?
The organizations use different methodologies, publication schedules, and product definitions. A figure for regular gasoline should not be compared directly with an all-grades average without labeling both.
gas pricesgasolineinflationEIAhousehold budgetenergy
Practice trading with Finelo
Practice in a simulator, learn with bite-sized lessons, and build confidence before risking real money.
About the author
Finelo Team
The Finelo Team creates practical investing and trading education designed to help beginners learn faster with structured challenges, simulator practice, and bite-sized lessons.
Keep reading — Related articles

News
China Sets a Stronger Yuan Fix at 6.7521: What It Means for USD/CNY
China set its September 18 yuan reference rate at 6.7521 per dollar. Learn how the official fixing differs from market rates and why the move matters.
Finelo Team
News
BOJ Raises Its Policy Rate to 1.25%: What the Decision Means for the Yen
The BOJ raised its overnight policy-rate target to around 1.25%. Learn why the yen can still weaken after a rate increase and what the decision says.
Finelo Team

News
The September Effect Explained: What the Stock Market Data Really Says
September has delivered the S&P 500's weakest average monthly return since 1928, but the result is not a reliable trading signal. Here is how to read the seasonality data.
Finelo Team


