For U.S. readers: This article discusses U.S. rules and financial products. State rules and individual eligibility may differ.
401(k) Balance by Age Percentile: What You Need to Know
A "401(k) balance by age percentile" places an account within a ranked sample of plan participants in the same age band.
7 min read
Practice investing with Finelo
Build practical investing skills with guided lessons, simulator practice, and structured challenges.
Want to learn more?
Build practical investing skills with guided lessons, simulator practice, and structured challenges.
Explore FineloExplore Finelo's 28-day challenges
Turn learning into a daily habit with guided challenge paths.
Quick answer
A "401(k) balance by age percentile" places an account within a ranked sample of plan participants in the same age band. It does not measure whether the balance is sufficient for a person's retirement. There is no single official U.S. percentile table. A provider report such as Vanguard's How America Saves 2025 describes only the plans and participants in its dataset, so it should be labeled as a commercial-provider sample rather than a population benchmark How America Saves 2025 (Vanguard). Finelo provides financial education, not financial or investment advice.
What to know before deciding
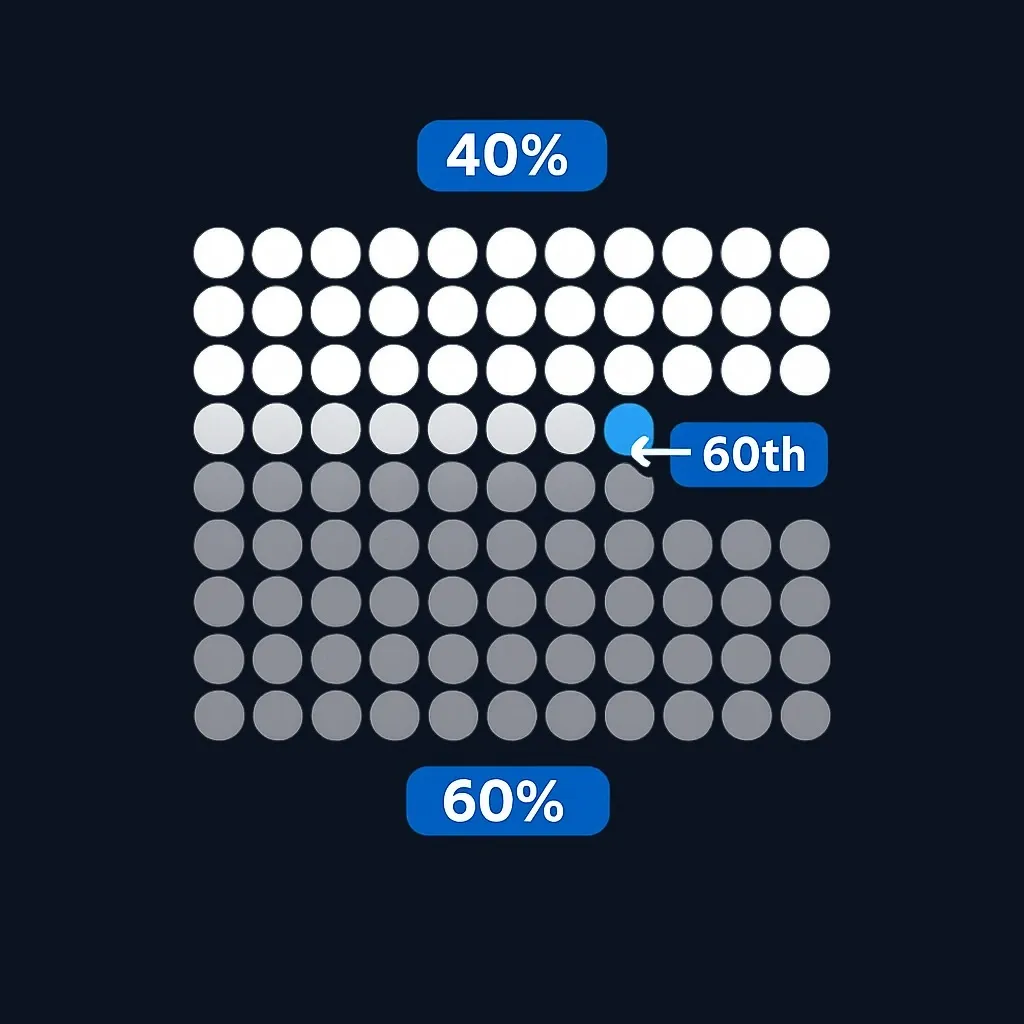
A 401(k) balance is the dollar value in a workplace retirement account: employee contributions, any employer contributions, investment gains or losses, fees, and past withdrawals. A percentile (for example, the 60th percentile) means your balance is higher than about 60% of peers in the same age band and lower than about 40%.
Why percentiles matter
- Averages (means) are pulled upward by a few very large balances. Percentiles and the median show where a "typical" participant sits.
- Most public plan reports list medians and means for age bands rather than every exact percentile; some providers publish percentile ladders or additional percentiles in supplemental tables. Vanguard’s report is an example of a recent plan-level report that includes those summary figures for account balances and contribution rates.
How to check your place
- Find your plan statement and note your 401(k) balance and your age.
- Locate a reputable, recent plan‑provider benchmark that breaks out balances by age band (look for the reporting year and the table header that says whether figures are per participant or per account).
- Match your age to the provider’s band, then place your balance relative to the median and other listed percentiles.
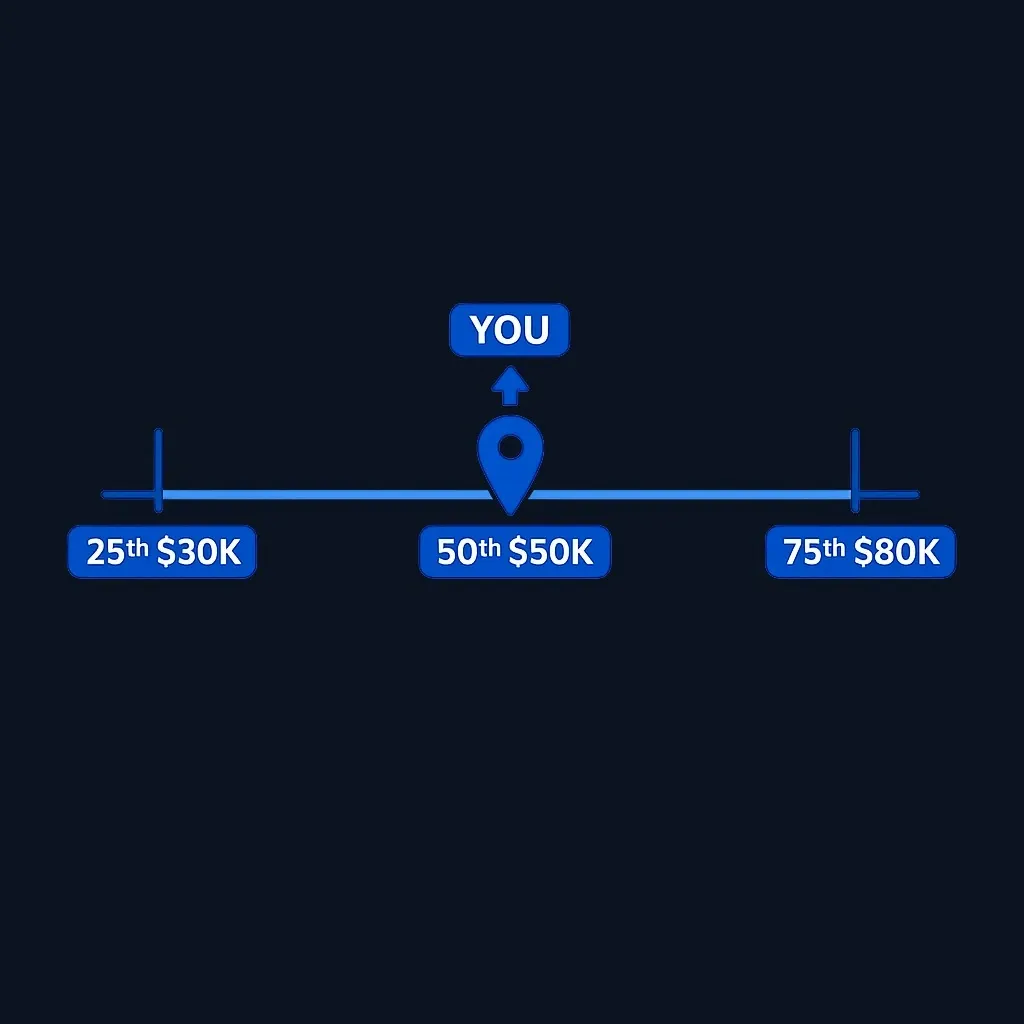
Example (conceptual): if a report shows a median for your age band and you are above that median, you are ahead of the typical plan participant in that band. If the report provides 25th and 75th percentiles, they show the middle spread and help set realistic intermediate goals.
Decision framework
Use this short, structured approach to turn a percentile result into a practical plan.
-
Confirm the comparison set
- Are the published figures for plan participants only or for a broader population?
- Are results shown per account or per participant (some households hold multiple accounts)?
-
Locate where you sit
- Compare your balance to the median and to the 25th/75th percentiles if available. Percentiles describe rank, not adequacy for your goals.
-
Separate rank from planning
- A result below or above the sample median does not determine an appropriate contribution rate or asset allocation.
- Review plan match and vesting rules, fees, taxes, liquidity, time horizon, and personal retirement assumptions before considering changes.

Educational note: this article is educational and not financial or investment advice. Investing involves risk, including the possible loss of principal.
Factors to weigh (how they change your target)
- Employer match: a match can be valuable compensation, but vesting rules, plan limits, investment performance, and withdrawal restrictions still matter.
- Time horizon: the closer you are to retirement, the more your plan should reflect capital preservation and income needs.
- Fees and fund choices: lower-cost funds and appropriate fund share classes can materially improve long-term outcomes.
- Consistency and tenure: long, uninterrupted contribution histories compound more than intermittent saving.
Common mistakes and how to avoid them
- Forgoing the employer match: contribute at least enough to get the full match when available.
- Comparing to the mean only: favor median or percentile ladders to judge typical progress.
- Stopping contributions in market dips: regular contributions use dollar-cost averaging and keep you invested.
- Ignoring plan fees: compare expense ratios in your plan and choose lower-cost options when they suit your allocation.
Practical, sequential steps (when you’re behind)
- Step 1: Review the match formula and vesting rules, then assess whether the contribution needed to receive it fits the household budget.
- Step 2: Automate small, regular increases (for example, raise contributions on each raise).
- Step 3: Review fund options and fees; rebalance to maintain your target allocation.
- Step 4: Use catch-up contributions if you qualify and if your personal plan and objectives support doing so.
Practice investing with Finelo
Build practical investing skills with guided lessons, simulator practice, and structured challenges.
Average 401(k) balances by age group (how to read published tables)
Many firms publish age-band summaries that include medians and means. Because methodologies and population definitions vary, read these table headers carefully before comparing.
What to check on every table
- Reporting year and whether figures are preliminary or estimated.
- Whether data are per-account, per-participant, or household-adjusted.
- Whether zero-balance participants are included or excluded.
- Whether employer contributions and rollovers are included in the balance totals.
How to use a provider table (step-by-step)
- Match your age to the provider’s band.
- Note the median and mean shown for that band.
- If percentiles (10th, 25th, 75th, 90th) are listed, find which bracket your balance falls into.
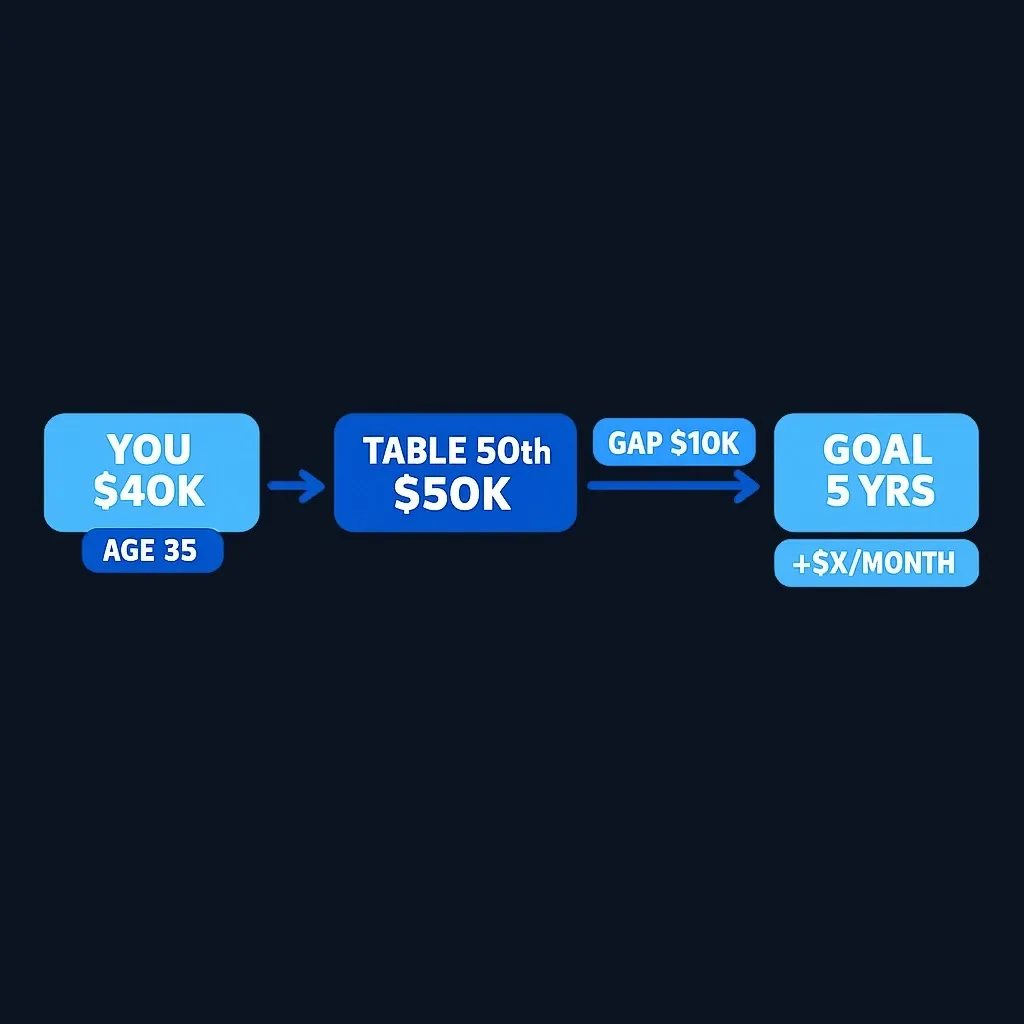
- Set incremental, specific goals tied to a percentile target (for example, moving from below the 25th to the 50th percentile over X years), then estimate the contribution rate needed to close that gap given your time horizon and assumed return.
Source to consult for plan-level summaries
- Vanguard's How America Saves 2025 report publishes account-balance statistics and contribution-rate summaries for the plan participants in its commercial dataset. Its figures are useful for studying that sample but are not an official estimate for every U.S. worker or household.
Example interpretation (illustrative, not a statistic)
- If a report shows the median and your balance is below it, a near-term objective can be to increase contributions to first secure the employer match and then add a fixed percentage of pay each year until you reach the median.
FAQs
What is a 401(k)?
A 401(k) is an employer-sponsored retirement savings account where employees contribute pre-tax or Roth (after-tax) dollars according to their plan’s options. Employers may offer matching contributions depending on their plan rules; check your plan documents or HR for specifics.
How do I start saving for retirement if my employer offers a plan?
Enroll in your employer’s plan and contribute at least enough to capture any employer match. Automate your contributions and plan periodic increases as your budget allows to take advantage of compounding.
How does employer matching work?
An employer match adds contributions to your account when you contribute. Matches are structured by the employer (for example, a percentage of pay up to a cap). To receive the match, you must contribute according to the plan’s rules.
Can I withdraw from my 401(k) early?
Early withdrawals are typically subject to income taxes and may incur penalties depending on your age and circumstances. Check your plan’s rules and consult a tax professional for your situation.
Conclusion and Next Steps
Key takeaways: percentiles place your 401(k) balance in context; medians and percentile ladders usually give a better sense of a typical saver than means; employer matching, consistent contributions, fees, and time horizon are the main levers you can control. Start by locating a recent, reputable plan-provider benchmark (for example, Vanguard’s How America Saves 2025) and compare your balance within the same age band. Then prioritize capturing your employer match and automating modest contribution increases.
If you want a simple next step, review your latest 401(k) statement, note your age band and balance, and compare those figures to a current provider report. For more beginner-friendly resources on retirement planning and savings strategies, visit the Finelo Blog: Finelo Blog.
InvestingFinancial Education
Practice investing with Finelo
Build practical investing skills with guided lessons, simulator practice, and structured challenges.
About the author
Finelo Team
The Finelo Team creates practical investing and trading education designed to help beginners learn faster with structured challenges, simulator practice, and bite-sized lessons.
Keep reading — Related articles

Investing
Yield to Call vs Yield to Maturity: Assumptions and Bond Risks
Yield to call (YTC) estimates a bond's yield if the issuer redeems it on an eligible call date; yield to maturity (YTM) estimates yield if it remains outstanding to final maturity.
Finelo Team
Investing
Will My Employer Know If I Take a 401(k) Loan?
Who this page is for: readers new to 401(k) loans who want a practical, privacy‑focused explanation — what your employer can see, how to limit visibility, and the financial tradeoffs to weigh.
Finelo Team
Investing
What Medical Expenses Qualify for a 401(k) Hardship Withdrawal?
Before you decide, confirm three things with your plan administrator:
Finelo Team


