Sector rotation is the movement of investment money from one part of the stock market to another as economic conditions change. The market is organized into 11 sectors, technology, financials, energy, health care, and the rest, and they do not rise and fall together: banks behave differently from utilities, oil producers from software makers.
Sector Rotation: The Cycle Model, the 11 Sectors, and Its Limits
Sector rotation describes changing stock-market leadership across industries. Learn the 11 sectors, the business-cycle model, and why anticipating each handoff is harder than recognizing it afterward.
8 min read
Practice investing with Finelo
Build practical investing skills with guided lessons, simulator practice, and structured challenges.
Want to learn more?
Build practical investing skills with guided lessons, simulator practice, and structured challenges.
Explore FineloExplore Finelo's 28-day challenges
Turn learning into a daily habit with guided challenge paths.
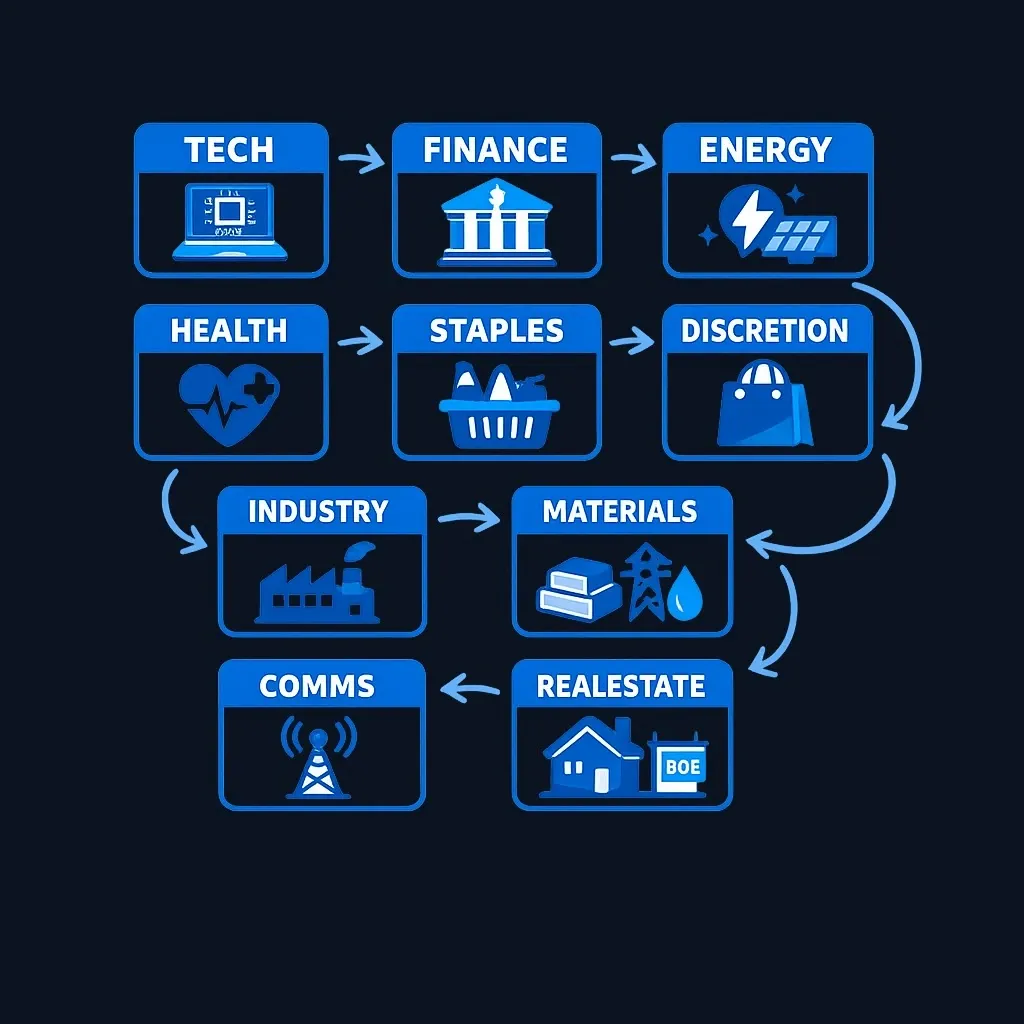
The classic idea holds that as the economy moves through its cycle, from recovery to expansion to slowdown to recession, leadership passes from one group of sectors to another in a roughly repeating pattern, and an investor who anticipates each handoff can position ahead of it. Whether that can be done profitably, especially by a beginner, is a separate and much harder question than whether the pattern exists.
If you have heard a market report say "money is rotating out of tech and into energy" and nodded without quite knowing what it meant, this page is the decoder.
It sits one level deeper than index investing: once you know what the S&P 500 is, the natural next question is what is inside it, and why different parts take turns leading. You do not need to trade sectors for the answer to be useful, because sector literacy explains a large share of daily market news and is the vocabulary behind diversification itself.
Sector rotation is a real phenomenon and a doubtful strategy. The sections below build the concept in full, then weigh it honestly.
The 11 sectors of the stock market
The standard classification system, GICS, maintained by S&P and MSCI, divides the market into 11 sectors. Each has a widely used SPDR ETF that tracks it, which is how most investors get sector-level exposure. Sectors are periodically redrawn: Real Estate became a standalone sector in 2016, and Communication Services was created in 2018.
| Sector | What's inside | Common ETF |
|---|---|---|
| Information Technology | Software, chips, hardware | XLK |
| Financials | Banks, insurers, asset managers | XLF |
| Health Care | Pharma, devices, insurers, biotech | XLV |
| Consumer Discretionary | Retail, autos, travel, restaurants | XLY |
| Consumer Staples | Food, beverages, household goods | XLP |
| Communication Services | Telecom, media, internet platforms | XLC |
| Industrials | Machinery, airlines, defense, transport | XLI |
| Energy | Oil, gas, energy equipment | XLE |
| Materials | Chemicals, metals, mining | XLB |
| Utilities | Electric, gas, and water providers | XLU |
| Real Estate | REITs and property companies | XLRE |
Cyclical vs defensive: the two families
Most rotation logic reduces to one split. Cyclical sectors, discretionary, financials, industrials, materials, energy, and technology, sell things people and businesses buy more of when times are good, so their fortunes swing with the economy.
Defensive sectors, staples, utilities, and health care, sell things people need regardless: groceries, electricity, medicine. Their earnings are steadier, which historically has made them hold up relatively better in downturns and lag in booms.
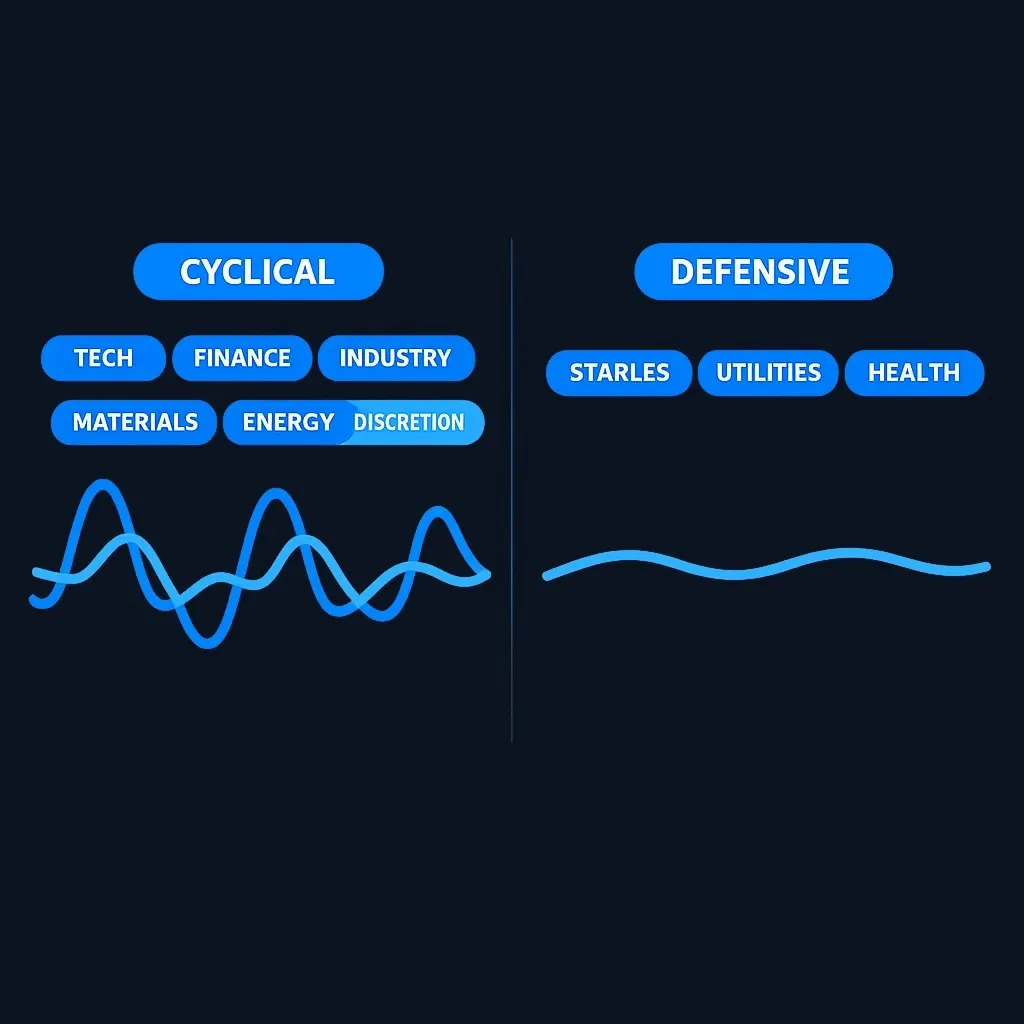
So when a report says "investors are getting defensive," it means money is flowing from the first family toward the second, often a sign of fading confidence in the economy.
The classic business-cycle rotation model
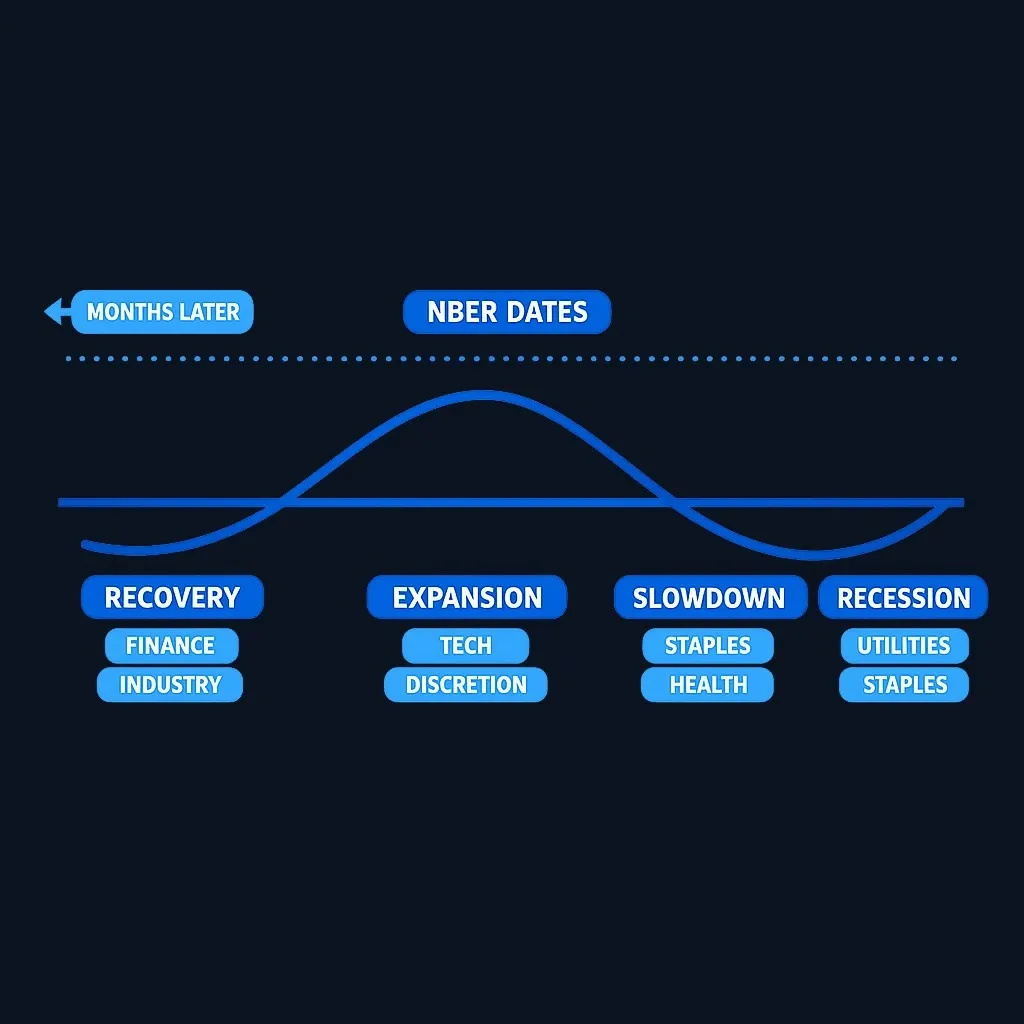
The traditional model divides the economy into four phases and maps historical sector leadership onto each. Expansions and recessions vary substantially in length. The National Bureau of Economic Research dates US business-cycle turning points retrospectively, so its chronology is not a live signal for investors.
| Phase | Economic backdrop | Sectors that have historically led | The logic |
|---|---|---|---|
| Early cycle | Sharp recovery, low rates, easy credit | Financials, consumer discretionary, industrials, real estate | Cheap money revives borrowing, spending, and building |
| Mid cycle | Steady growth, healthy profits (the longest phase) | Technology, communication services | Confident businesses invest in capability and growth |
| Late cycle | Overheating growth, rising inflation, tightening policy | Energy, materials, with defensives strengthening | Inflation lifts commodity producers as caution creeps in |
| Recession | Contraction, falling profits, scarce credit | Consumer staples, utilities, health care | Necessity spending survives and steady dividends attract shelter |
Read the table as a history summary, not a forecast. Every cycle has broken the pattern somewhere, and the phases carry no labels in real time.
NBER often dates a turning point a year or more after the fact, so the single most important input to the strategy, which phase you are actually in, is the one you cannot read live. That lag is the quiet flaw at the heart of the whole model.
How investors track rotation
Rotation-watchers lean on three tools, all observable even if you never act on them.
Relative strength. The core technique compares a sector against the broad market rather than in isolation. If energy's ETF gained 5% over six months while the S&P 500 gained 10%, energy lagged even though it rose. Leadership shifts show up as changes in that relationship: a sector that quietly stops underperforming and starts outperforming is where attention turns. This is illustrative, not a rule, and charting platforms formalize it with rotation graphs that plot each sector's strength and momentum against a benchmark.
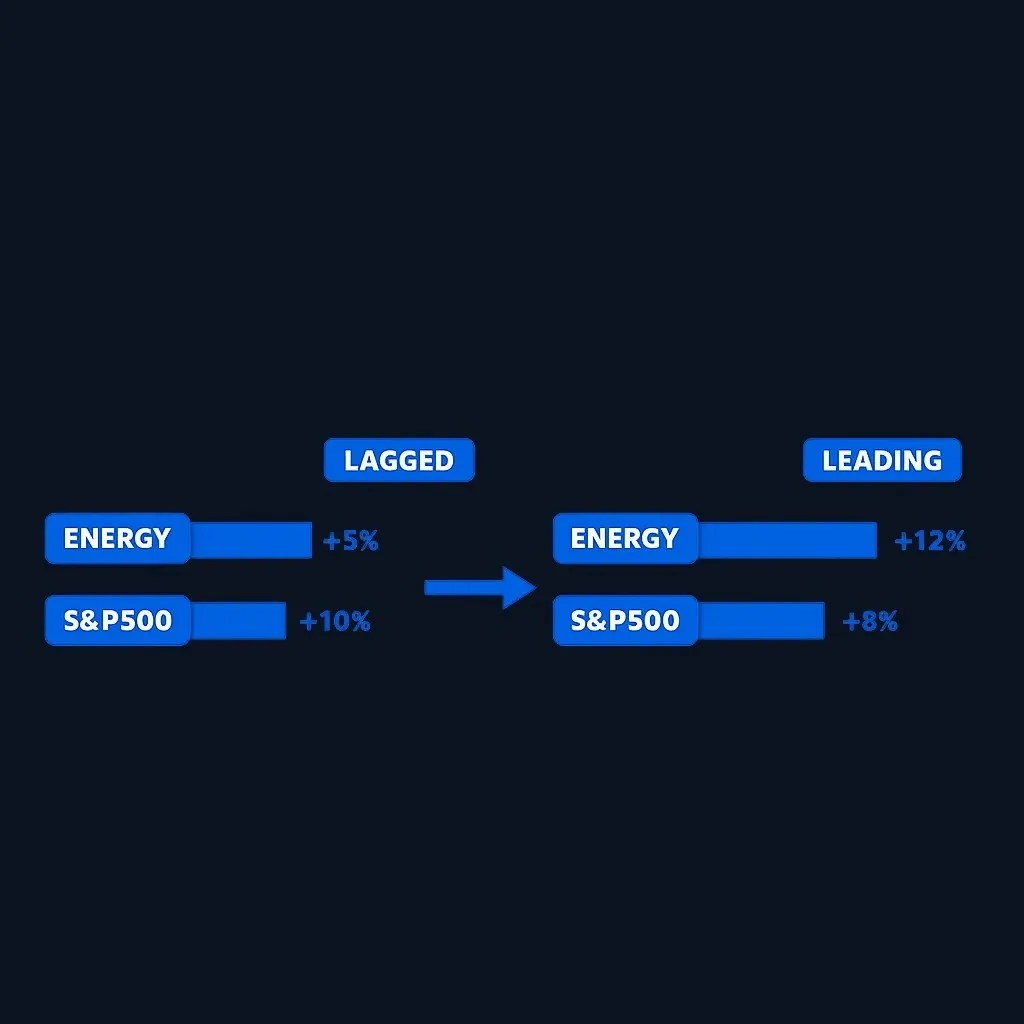
Sector ETFs. The 11 SPDR funds and their rivals make sector performance visible at a glance and are the vehicle through which rotation is actually executed, with no stock-picking required.
Top-down signals. Rotation logic starts with the macro picture: interest rates, central-bank policy, credit conditions, commodity prices. Rising rates have historically coincided with money favoring financials and energy, while slowing growth has favored utilities and health care. Tendencies, again, not rules.
Sector rotation vs diversification
These two approaches answer the same fact, that sectors take turns, in opposite ways.
Rotation says: work out whose turn is next and concentrate there. It is an active bet that depends on correctly reading the economy's phase, the market's reaction, and the timing of both, repeatedly.
Diversification says: you cannot reliably predict whose turn is next, so own all of them and let winners offset losers. A diversified portfolio across sectors simply owns all eleven, and periodic rebalancing trims whatever has led and tops up whatever has lagged, a mechanical cousin of the same idea. For the underlying principles, see portfolio diversification explained.
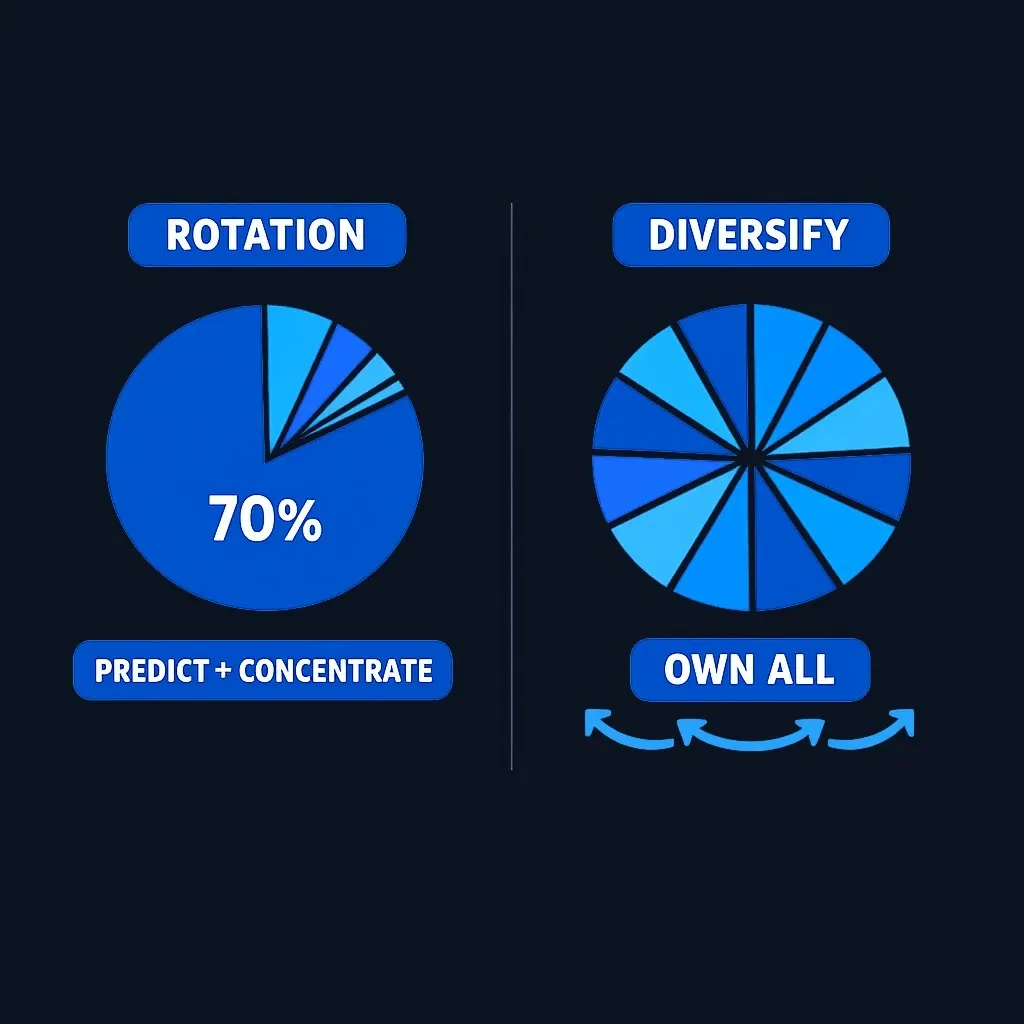
Diversification captures every rotation without predicting any of them. For most beginners, that one sentence is the practical takeaway of the entire topic.
Practice investing with Finelo
Build practical investing skills with guided lessons, simulator practice, and structured challenges.
Does sector rotation actually work?
The honest answer has three layers.
First, the phenomenon is genuine. Sector leadership demonstrably shifts across cycles, and the tendencies in the table above are documented history, not myths.
Second, profiting from it is hard. To come out ahead you must identify the current phase in real time, when official dating lags by months or years, correctly anticipate which sectors the market will reward next, since markets move ahead of the economy, and then repeat both calls cycle after cycle, after costs and taxes. The academic evidence is discouraging.
A study by Jacobsen, Stangl, and Visaltanachoti examined US sector returns and found that the conventional business-cycle rotation strategy offered only a modest historical edge even with perfect foresight and without trading costs. Those assumptions are unavailable in real trading. Results depend on the period, sector definitions, and timing method; an actively managed rotation fund does not remove these limitations.
Third, consider who is telling you. Much of the enthusiastic rotation content online comes from brokers and platforms that earn money when you trade sectors. Finelo teaches investing and sells learning, not sector funds, and the education-first reading of the evidence is that sector rotation is a valuable lens and a doubtful strategy for beginners.
Limitations of the cycle model
Even setting performance aside, the model has structural weaknesses. Cycles rhyme rather than repeat: no two share the same length, shape, or sector script, and structural changes like globalization, technology's dominance, and shifting policy regimes keep rewriting the pattern. Sector averages also hide large variation between companies inside a single sector. Frequent switching adds transaction costs and taxes that quietly consume the very edge being chased. And concentrating in a few sectors reintroduces exactly the risk that diversification exists to remove, which is why any active tilting demands real risk management.
Who might use it, and who shouldn't
Experienced investors sometimes apply rotation modestly: small overweights and underweights around a diversified core, informed by relative strength, with strict limits. That "core and tilt" approach at least bounds the damage when a call is wrong.
For a beginner, the highest-value use of sector rotation is understanding it, not doing it. Sector awareness costs nothing and pays off immediately: it decodes market news, explains why your portfolio moved, and reveals whether your holdings are secretly concentrated in one sector. Diagnose that, then diversify and rebalance, and you will capture every rotation without predicting a single one.
Next steps
You now have the full picture: the 11 sectors, the two families, the classic cycle map, the tools that track leadership, and the evidence that turning all of it into market-beating trades is far harder than the diagram implies. Let sector knowledge make you a sharper reader of markets first.
To put it to work the low-risk way, continue with Finelo's guides to building a diversified portfolio and rebalancing your portfolio, and explore Finelo for structured lessons.
Educational note: This article is for educational purposes only and does not constitute financial, investment, legal, or tax advice. Finelo is an educational product, not a brokerage or adviser. Simulator practice uses virtual funds. Investing and trading involve risk, including possible loss of principal; verify account-specific requirements with your broker.
Sources and Further Verification
Frequently asked questions
Is there a sector rotation ETF?
Yes. Funds such as XLSR and SECT rotate sector exposure. Compare each fund’s current strategy, fees, holdings, and results against an appropriate benchmark. These are examples for education, not recommendations; an active fund does not eliminate timing or concentration risk.
Are sector rotation funds good for beginners?
They add active timing decisions and may cost more than a broad index fund. Beginners should understand the fund’s holdings, fees, and concentration risk before considering it. A diversified index fund already provides exposure to multiple sectors without requiring an investor to predict each rotation.
How do you find out where sector rotation is happening?
Watch relative strength: compare each sector ETF's recent performance against a broad index like the S&P 500. Sectors persistently outperforming the index are leading, and those lagging are being rotated out of. Free sector dashboards and rotation graphs on major charting platforms show the same comparison visually.
Which sectors do well in a recession?
Historically the defensive family, consumer staples, utilities, and health care, has held up relatively better, because demand for food, power, and medicine persists when discretionary spending falls. "Relatively better" is the key phrase: defensives can still lose value in a downturn, and no historical pattern is guaranteed to repeat.
What are the 11 sectors of the stock market?
Under GICS they are Information Technology, Financials, Health Care, Consumer Discretionary, Consumer Staples, Communication Services, Industrials, Energy, Materials, Utilities, and Real Estate. Each maps to a widely traded SPDR sector ETF, and together they contain every company in the S&P 500.
Sector RotationInvestingBeginner
Practice investing with Finelo
Build practical investing skills with guided lessons, simulator practice, and structured challenges.
About the author
Finelo Team
The Finelo Team creates practical investing and trading education designed to help beginners learn faster with structured challenges, simulator practice, and bite-sized lessons.
Keep reading — Related articles

Investing
Yield to Call vs Yield to Maturity: Assumptions and Bond Risks
Yield to call (YTC) estimates a bond's yield if the issuer redeems it on an eligible call date; yield to maturity (YTM) estimates yield if it remains outstanding to final maturity.
Finelo Team

Investing
Will My Employer Know If I Take a 401(k) Loan?
Who this page is for: readers new to 401(k) loans who want a practical, privacy‑focused explanation — what your employer can see, how to limit visibility, and the financial tradeoffs to weigh.
Finelo Team

Investing
What Medical Expenses Qualify for a 401(k) Hardship Withdrawal?
Before you decide, confirm three things with your plan administrator:
Finelo Team


