The difference in one breath: a balance sheet shows what a business owns and owes at a single moment — assets, liabilities, and equity. An income statement shows what a business earned and spent over a period — revenue, expenses, and the profit or loss left over. As Coursera's finance guide puts it, the income statement measures profitability by tracking revenue and expenses, while the balance sheet lays out what a company owns in assets and equity plus what it owes in liabilities. One is a snapshot; the other is a video.
Balance Sheet vs Income Statement: Understanding Key Differences
The difference in one breath: a balance sheet shows what a business owns and owes at a single moment — assets, liabilities, and equity. An income statement shows what a business earned and spent over a period —…
8 min read
Practice investing with Finelo
Build practical investing skills with guided lessons, simulator practice, and structured challenges.
Want to learn more?
Build practical investing skills with guided lessons, simulator practice, and structured challenges.
Explore FineloExplore Finelo's 28-day challenges
Turn learning into a daily habit with guided challenge paths.
Both statements describe the same business, but they answer different questions. The balance sheet answers "how strong is this company right now?" The income statement answers "is this company making money?" Below: what each statement contains, a side-by-side comparison, a decision table for which to open first, the most common reading mistakes, and a worked example that runs one small business through both.
What is a Balance Sheet?
A balance sheet is a statement of financial position at a specific date — often the last day of a quarter or year. It lists three things:
- Assets — everything the business owns or is owed: cash, inventory, equipment, buildings, and money customers still owe (accounts receivable).
- Liabilities — everything the business owes to others: loans, unpaid bills to suppliers (accounts payable), wages not yet paid, taxes due.
- Equity — what's left for the owners after liabilities are subtracted from assets. It includes money owners put in and profits kept in the business (retained earnings).
The statement gets its name from the accounting equation, which must always hold:
Assets = Liabilities + Equity
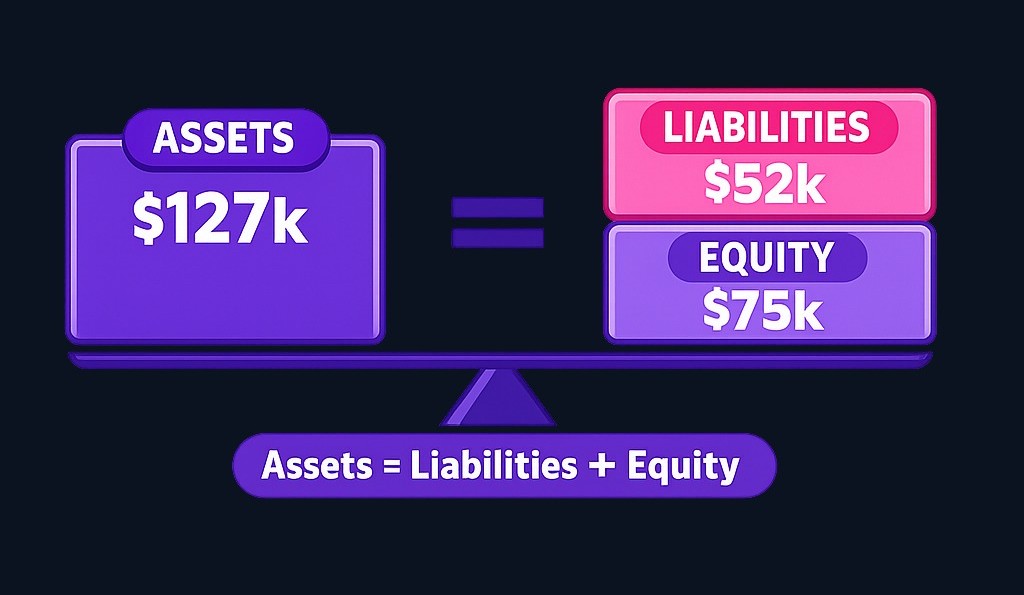
If a company holds $127,000 in assets and owes $52,000, equity is $75,000. The two sides always balance, because every dollar of assets was funded either by borrowing or by owners.
Why readers care: the balance sheet reveals solvency (can the company cover its debts?) and liquidity (does it have enough cash and near-cash to pay bills due soon?). A profitable company with too little cash can still fail — and only the balance sheet shows that risk.
What is an Income Statement?
An income statement — also called a profit and loss statement, or P&L — covers a period: a month, a quarter, a year. Its job is measuring profitability by tracking what came in and what went out. It follows a simple downhill flow:
- Revenue — money earned from selling products or services during the period.
- Cost of goods sold (COGS) — the direct cost of producing what was sold. Revenue minus COGS gives gross profit.
- Operating expenses — rent, salaries, marketing, software, and other running costs. Gross profit minus these gives operating income.
- Interest and taxes — financing and tax costs come out last.
- Net income — the bottom line. What's left after everything.
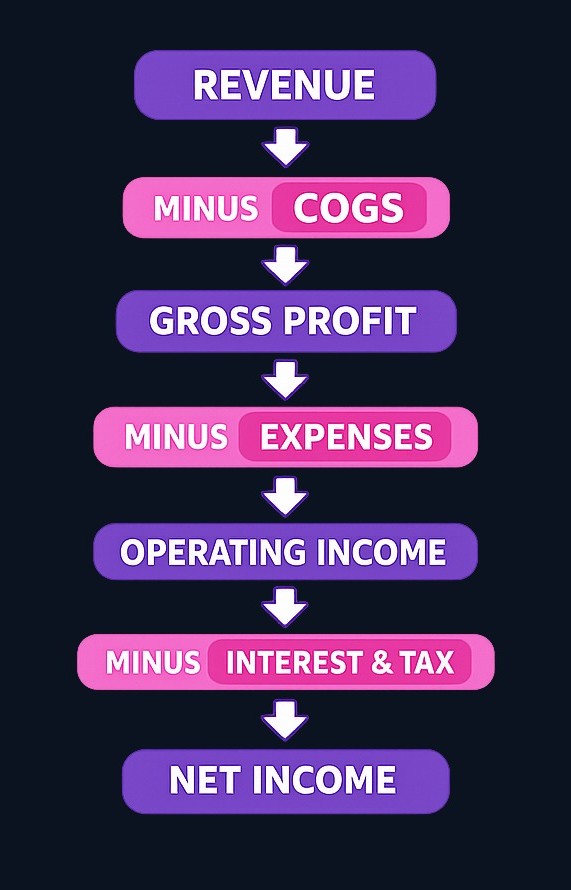
Each layer answers its own question. Gross profit tells you whether the core product makes money. Operating income tells you whether the business model works after overhead. Net income tells you what the owners actually keep.
Why readers care: the income statement reveals profitability and trend. Comparing periods shows whether revenue is growing, whether costs are creeping faster than sales, and whether margins are widening or shrinking. It's the statement lenders and investors check to see if the engine runs.
Key Differences Between Balance Sheet and Income Statement
| Factor | Balance sheet | Income statement |
|---|---|---|
| Time frame | One specific date — a snapshot | A period — month, quarter, or year |
| Core question | What do we own and owe? | Did we make money? |
| Main components | Assets, liabilities, equity | Revenue, expenses, net income |
| Governing logic | Assets = Liabilities + Equity | Revenue − Expenses = Net income |
| What it reveals | Solvency, liquidity, financial cushion | Profitability, margins, cost control |
| Resets? | Never — balances carry forward | Yes — each period starts from zero |
| Typical readers' focus | Creditors checking repayment ability | Investors checking earning power |
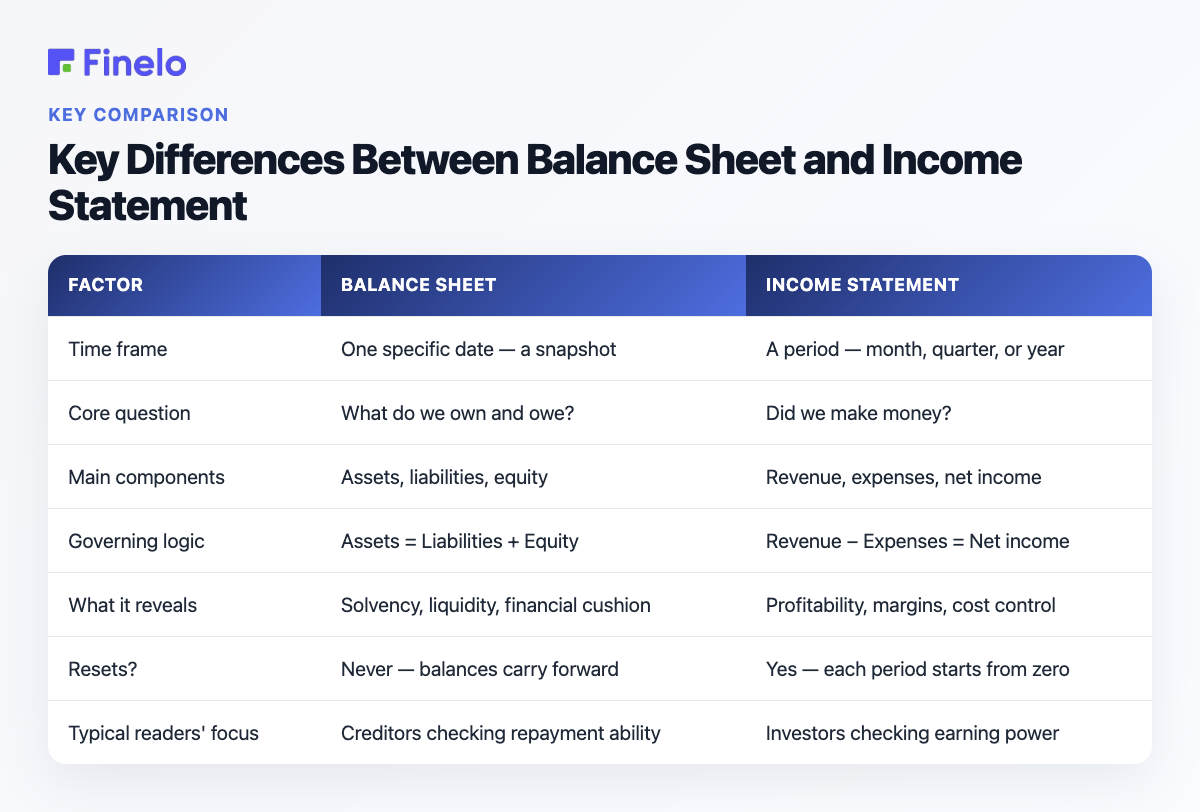
Three differences deserve emphasis beyond the table.
Timing changes everything. The same item can land on both statements differently. Rippling's payroll example shows it well: staff salaries hit the income statement as an operating expense, but wages still unpaid when the reporting period closes appear on the balance sheet as a "salaries and wages payable" liability. Neither statement is wrong — they're answering different questions about the same dollars.
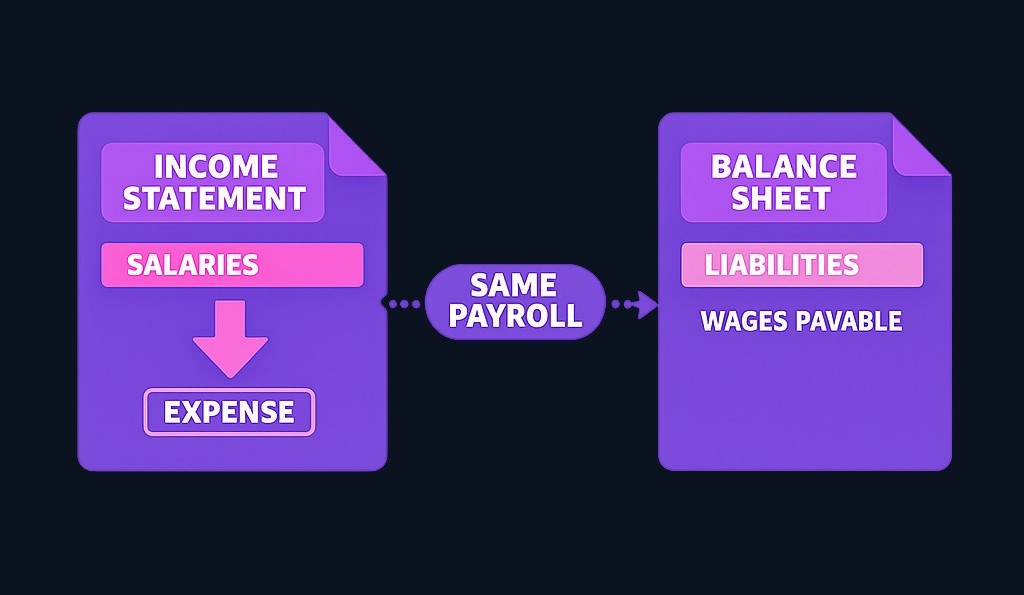
One resets, one accumulates. Every new period, the income statement starts counting from zero. The balance sheet never resets; it's the running total of everything the business has done since day one. That's why a single bad quarter shows up loudly on the P&L but may barely dent a strong balance sheet.
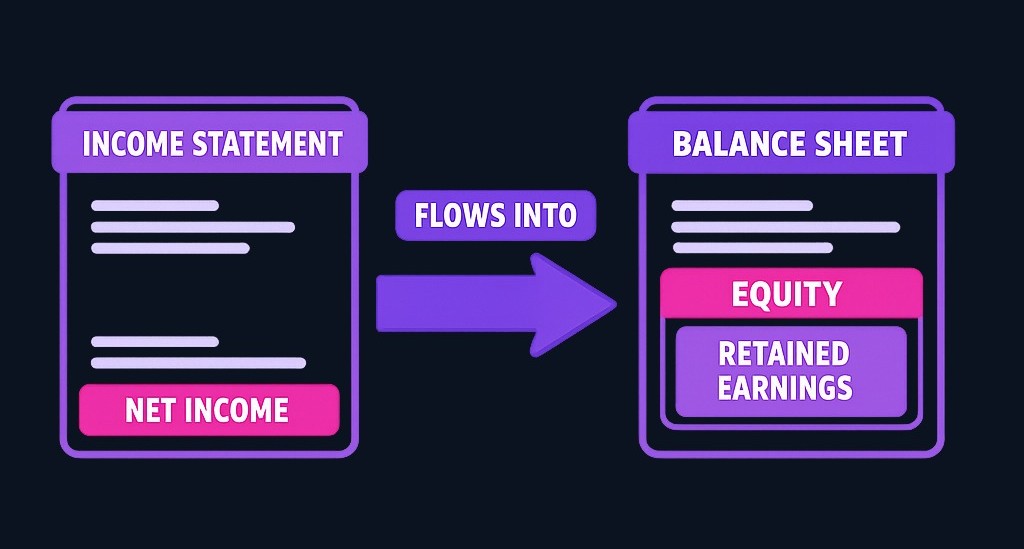
They connect through equity. Net income from the income statement flows into retained earnings on the balance sheet. Profit that isn't paid out to owners increases equity; a loss shrinks it. This link is why the two statements must be read together — the P&L explains why the balance sheet changed between two dates.
Worth knowing: these two aren't the whole picture. A cash flow statement is the third core financial statement, showing how a company earns and uses cash — and how liquid it truly is.
Practice investing with Finelo
Build practical investing skills with guided lessons, simulator practice, and structured challenges.
When to Use Each Statement
Decision table: which statement answers your question
| Your question | Open this first |
|---|---|
| Can this company pay its bills next quarter? | Balance sheet — check cash and current liabilities |
| Is the business actually profitable? | Income statement — check net income and margins |
| Is it safe to lend this company money? | Balance sheet — compare debt to assets and equity |
| Are costs growing faster than sales? | Income statement — compare expense and revenue trends across periods |
| How much of the company do owners really "own"? | Balance sheet — equity versus liabilities |
| Should I raise prices or cut costs? | Income statement — gross and operating margins show where profit leaks |
| Why did equity change this year? | Both — net income (P&L) flows into retained earnings (balance sheet) |
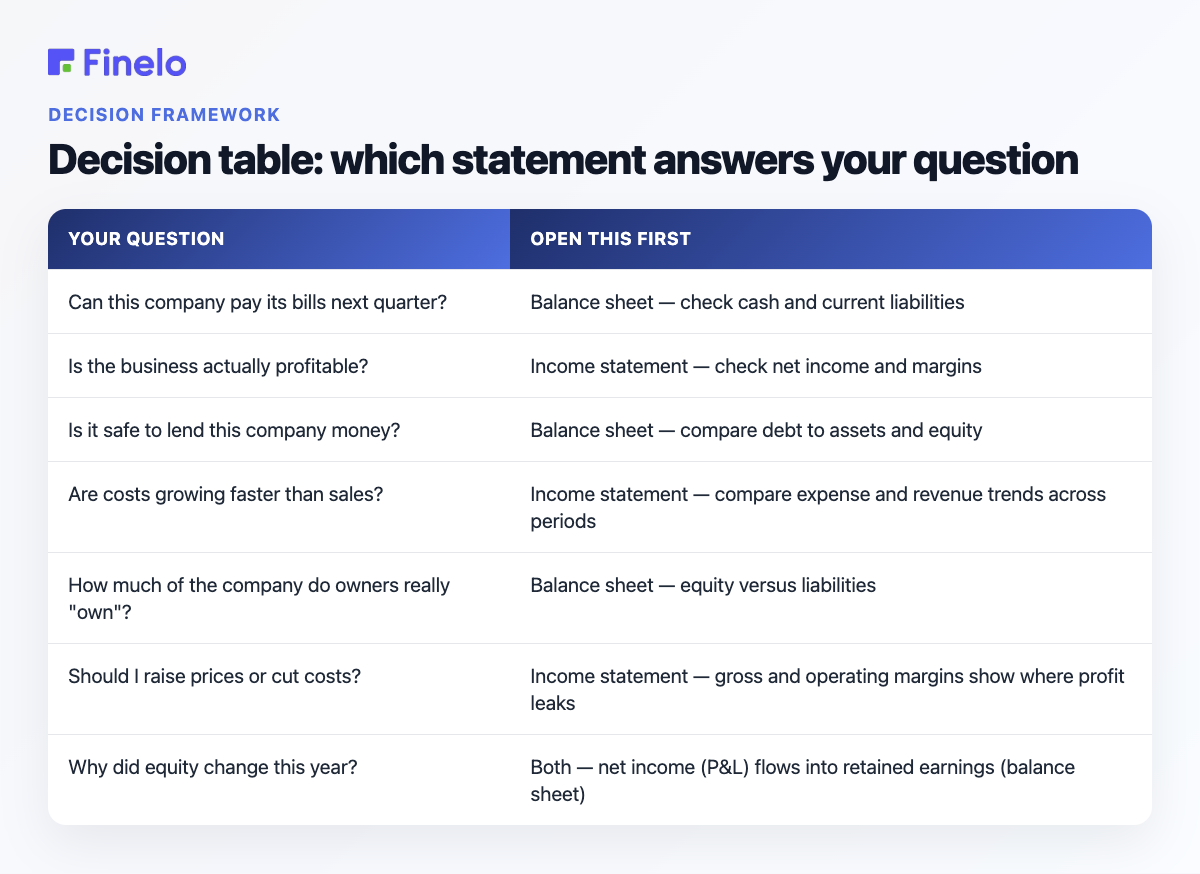
The pattern: creditors lean on the balance sheet, because they care about being repaid even if growth stalls. Investors lean on the income statement, because they care about earning power. Managers need both — pricing and cost decisions come from the P&L, while cash, inventory, and borrowing decisions come from the balance sheet.
Preparation order matters too. Businesses generally prepare the income statement first, since the period's profit or loss feeds retained earnings, which the balance sheet needs before it can balance.
Common Mistakes in Interpreting Financial Statements
Mistake 1: Treating profit as cash. Net income is an accounting result, not a bank balance. A company can post strong profits while customers haven't paid yet — revenue is booked, but cash hasn't arrived. Always cross-check the income statement against the cash position on the balance sheet.
Mistake 2: Reading one statement in isolation. A fat profit means little if the balance sheet shows debt due next month that cash can't cover. A fortress balance sheet means little if the P&L shows margins collapsing. Each statement hides what the other reveals.
Mistake 3: Comparing a snapshot to a video. Don't line up one date's balance sheet against a full year's income statement and draw ratios carelessly. Ratio analysis that mixes the two — like return on equity — typically uses average balance sheet figures across the period for exactly this reason.
Mistake 4: Ignoring the reset. Income statement numbers restart every period, so a great quarter can follow a terrible year. Look at several consecutive periods before calling something a trend. Two data points make a line; they don't make a story.
Mistake 5: Skipping the liability fine print. Two companies can hold identical total liabilities with very different risk. Debt due in 60 days is not the same as debt due in 10 years. Check how liabilities split between current (due within a year) and long-term.
Real-World Example: One Business, Both Statements
Meet a hypothetical coffee shop, Maple Street Coffee, closing its first full year.
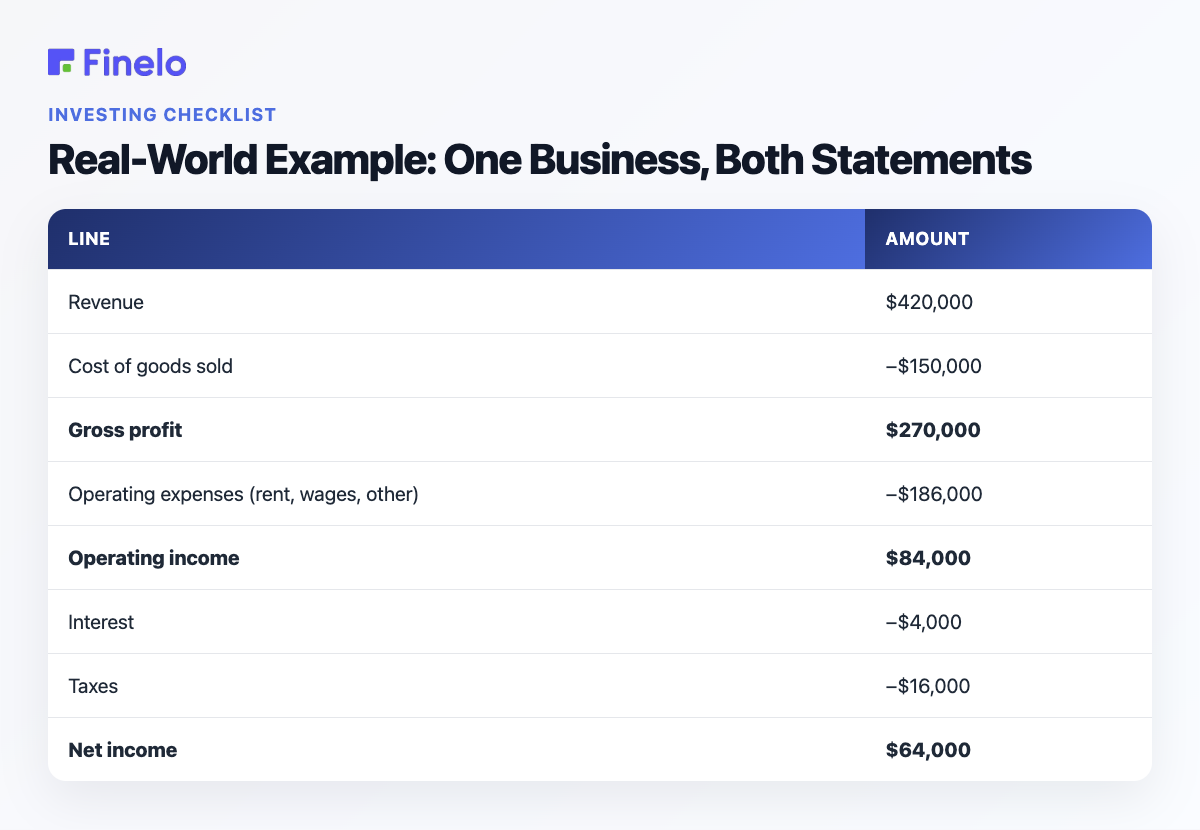
Income statement (for the year):
| Line | Amount |
|---|---|
| Revenue | $420,000 |
| Cost of goods sold | −$150,000 |
| Gross profit | $270,000 |
| Operating expenses (rent, wages, other) | −$186,000 |
| Operating income | $84,000 |
| Interest | −$4,000 |
| Taxes | −$16,000 |
| Net income | $64,000 |
Balance sheet (December 31):
| Assets | Liabilities & equity | ||
|---|---|---|---|
| Cash | $35,000 | Bank loan | $45,000 |
| Inventory | $12,000 | Accounts payable | $7,000 |
| Equipment | $80,000 | Total liabilities | $52,000 |
| Equity | $75,000 | ||
| Total | $127,000 | Total | $127,000 |
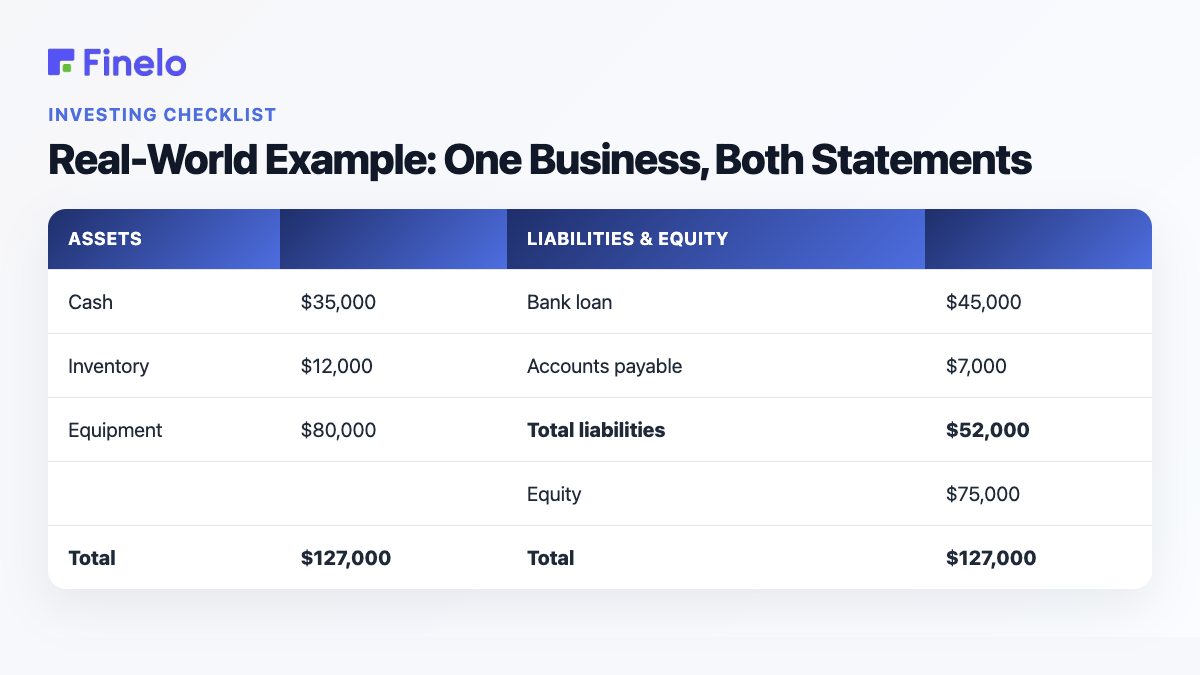
Now read them together. The P&L says the shop earns a healthy 20% operating margin — the business model works. The balance sheet says $35,000 in cash comfortably covers the $7,000 owed to suppliers — no liquidity scare. And the connection is visible: much of that $64,000 profit stayed in the business, building the $75,000 equity figure.
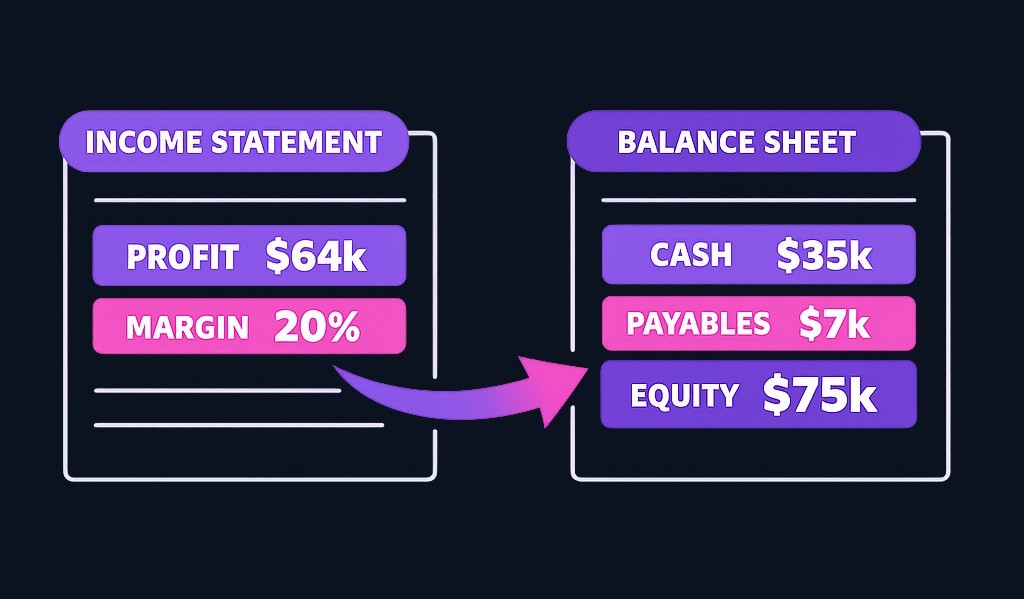
Change one number and the story flips. Same profit, but cash of $4,000 instead of $35,000? Suddenly the owner is profitable on paper and struggling to make payroll — a situation only visible because you read both statements. That's the whole argument for never analyzing one without the other.
Conclusion
The balance sheet tells you where a business stands; the income statement tells you where it's heading. One measures financial strength at a moment, the other measures earning power over time, and net income links the two through equity. Whichever you open first, never stop at one — the risks each statement hides are exactly what the other exposes.
This overview is educational, not accounting or investment advice. For decisions with real money at stake, work with a qualified accountant or analyst.
If you want to get comfortable reading financial statements as an investor, Finelo's Wealth Growth Quiz can point you to a learning path that matches your level.
Frequently asked questions
What is the relationship between the balance sheet and income statement?
Net income from the income statement flows into retained earnings inside equity on the balance sheet. Profits kept in the business raise equity; losses lower it. That's also why the income statement gets prepared [first](https://www.coursera.org/articles/income-statement-vs-balance-sheet).
How often should these statements be prepared?
Public companies report quarterly and annually. Small businesses commonly prepare monthly statements for management use — frequent enough to catch cost creep or cash trouble early, without drowning in paperwork.
What is the accounting equation?
Assets = Liabilities + Equity. It's the rule that forces a balance sheet to balance: every asset was funded either by borrowing (liabilities) or by owners' money and retained profits (equity).
What are the limitations of a balance sheet?
It's a single-date snapshot, so it can look different a week later. It also records many assets at historical cost, which may not reflect today's value. Pair it with the income statement — and the cash flow [statement](https://www.coursera.org/articles/income-statement-vs-balance-sheet) — for the fuller picture.
InvestingBeginnerFinancial StatementsMarkets
Practice investing with Finelo
Build practical investing skills with guided lessons, simulator practice, and structured challenges.
About the author
Finelo Team
The Finelo Team creates practical investing and trading education designed to help beginners learn faster with structured challenges, simulator practice, and bite-sized lessons.
Keep reading — Related articles

Investing
Yield to Call vs Yield to Maturity: Assumptions and Bond Risks
Yield to call (YTC) estimates a bond's yield if the issuer redeems it on an eligible call date; yield to maturity (YTM) estimates yield if it remains outstanding to final maturity.
Finelo Team

Investing
Will My Employer Know If I Take a 401(k) Loan?
Who this page is for: readers new to 401(k) loans who want a practical, privacy‑focused explanation — what your employer can see, how to limit visibility, and the financial tradeoffs to weigh.
Finelo Team

Investing
What Medical Expenses Qualify for a 401(k) Hardship Withdrawal?
Before you decide, confirm three things with your plan administrator:
Finelo Team


