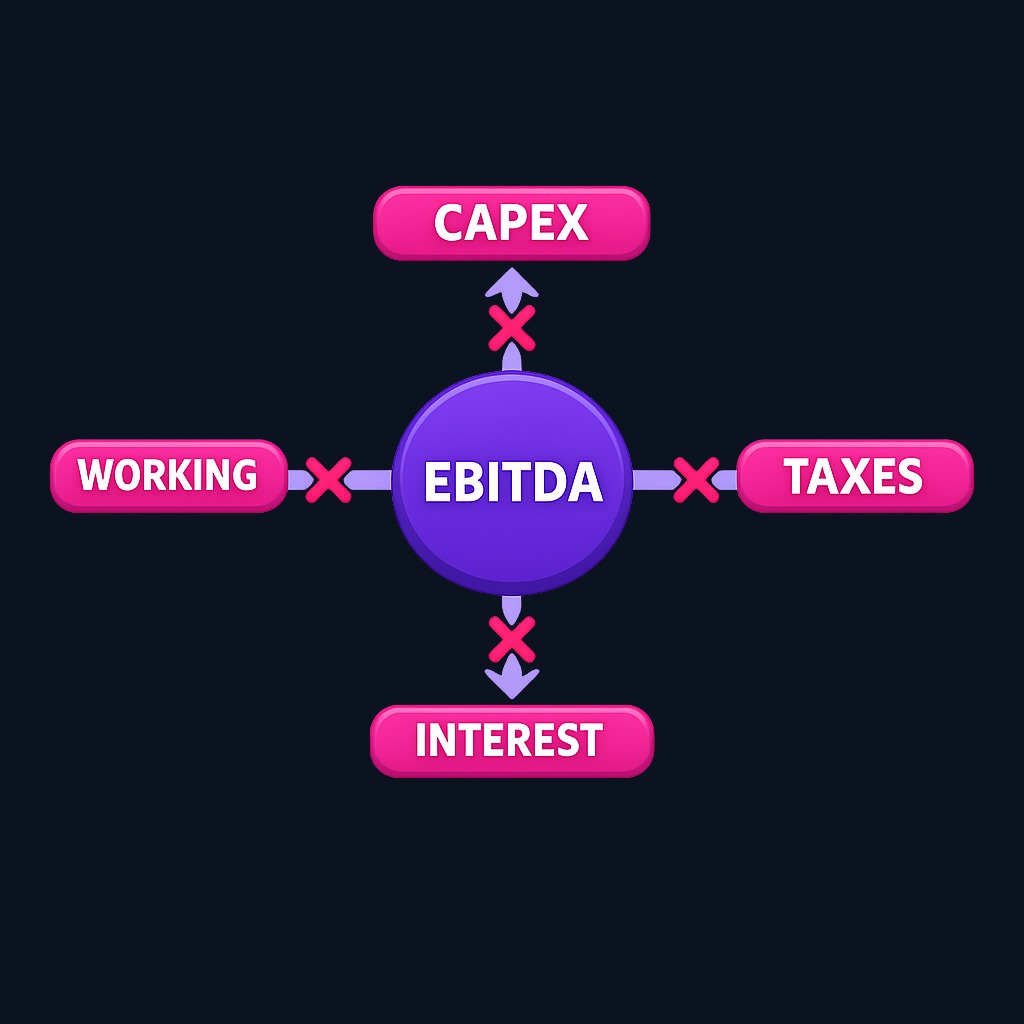
Definition note: Debt/EBITDA is a leverage comparison, not a repayment clock. EBITDA is not cash available for debt reduction because it excludes interest, taxes, capital spending, and working-capital needs. State whether the numerator is gross debt or net debt, whether lease liabilities are included, and whether EBITDA is reported or adjusted. Compare only consistently defined figures and source covenant thresholds from the actual credit agreement or rating methodology.
Debt to EBITDA Ratio: What It Means and How to Calculate It
The debt to ebitda ratio measures how many years of a company's core earnings it would take to repay all of its debt. You calculate it by dividing total debt by EBITDA (earnings before interest, taxes, depreciation, and…
8 min read
Practice investing with Finelo
Build practical investing skills with guided lessons, simulator practice, and structured challenges.
Want to learn more?
Build practical investing skills with guided lessons, simulator practice, and structured challenges.
Explore FineloExplore Finelo's 28-day challenges
Turn learning into a daily habit with guided challenge paths.
The debt to ebitda ratio measures how many years of a company's core earnings it would take to repay all of its debt. You calculate it by dividing total debt by EBITDA (earnings before interest, taxes, depreciation, and amortization). As a rough rule, a ratio below 3.0 is generally considered manageable for most businesses, while readings above 4.0 to 5.0 often signal a heavy debt load. This page is for investors learning fundamental analysis, students of corporate finance, and business owners watching their own leverage. Read the walkthrough below, then practice analyzing real company numbers with Finelo, an investing-education app with guided lessons.
What is the debt to EBITDA ratio?
The ratio compares what a company owes to what it earns from operations before non-cash charges and financing costs. Total debt usually includes short-term borrowings, long-term loans, and bonds. EBITDA approximates the operating cash a business generates that could, in principle, service that debt.
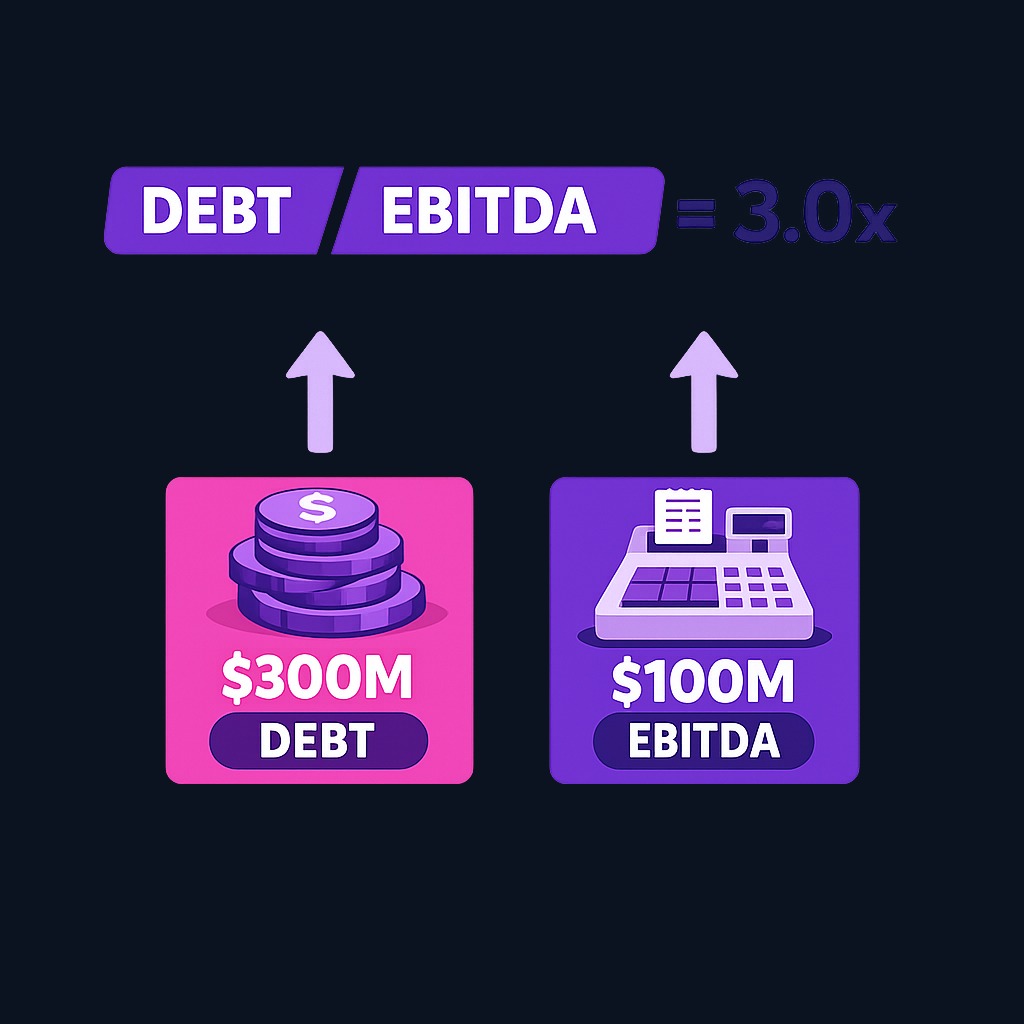
A company with $300 million of consistently defined debt and $100 million of EBITDA has a 3.0x ratio. That does not mean the debt can be repaid in three years: EBITDA is not a cash-flow measure, debt has contractual maturities, and the business must fund taxes, interest, working capital, and investment.
Lenders and rating agencies lean on this metric because it ties borrowing to earning power rather than to assets that may be hard to sell. Loan agreements frequently include a maximum debt to EBITDA level as a covenant; breaching it can trigger penalties, higher interest costs, or accelerated repayment.
How to calculate the debt to EBITDA ratio
The formula is straightforward:
Debt to EBITDA = Total Debt ÷ EBITDA
A worked example. Suppose a manufacturer reports:
- Short-term debt: $50 million
- Long-term debt: $250 million
- Operating income (EBIT): $80 million
- Depreciation and amortization: $20 million

Total debt is $300 million. EBITDA is $80 million + $20 million = $100 million. The ratio is 300 ÷ 100 = 3.0x.
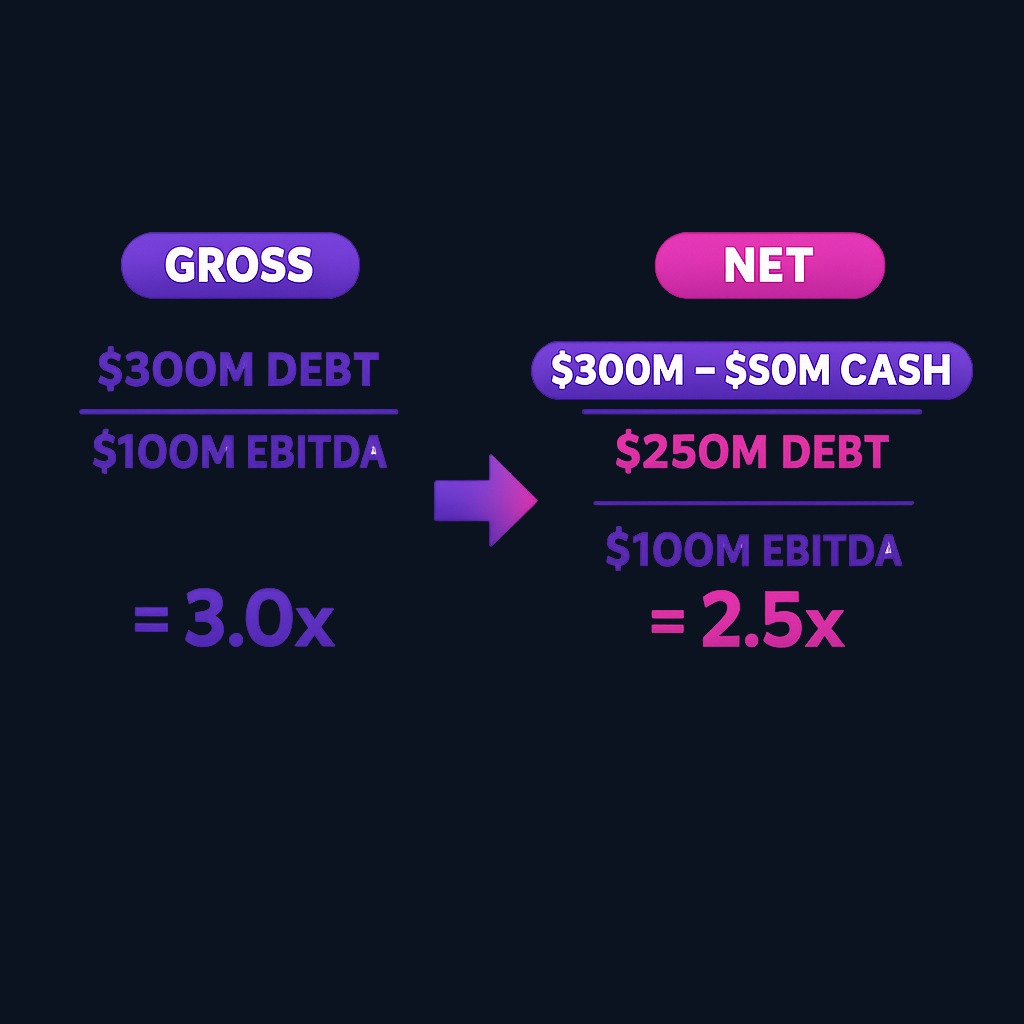
Every input comes from public filings: the balance sheet for debt, the income statement and cash flow statement for the earnings pieces. For US-listed companies you can pull annual and quarterly reports free of charge from SEC EDGAR, the regulator's filing database. Some analysts prefer net debt to EBITDA, which subtracts cash and equivalents from total debt on the theory that cash on hand could immediately repay part of the borrowing.
Why the ratio matters
Three groups watch this number closely.
Lenders and banks use it to size credit risk. A bank extending a loan wants confidence that operating earnings cover interest and principal with room to spare. Higher ratios usually translate into higher interest rates or refusal to lend.
Credit rating agencies factor leverage into ratings, and a downgrade raises a company's cost of borrowing across the board.
Equity investors use it to judge financial resilience. A company with a low ratio can survive a recession, fund growth, or buy back stock. A highly levered business may be forced to cut dividends, sell assets, or issue shares at the worst possible time. Interest-rate conditions amplify this: when benchmark rates rise, refinancing expensive debt gets harder, and you can track those benchmark movements in the Federal Reserve's H.15 selected interest rates release.
Compare leverage with sourced peers and debt terms
There is no reliable industry-wide table that applies across cycles and definitions. Compare gross or net debt consistently with close peers, then inspect EBITDA adjustments, leases, collateral, seniority, interest coverage, maturities, covenants, liquidity, cyclicality, and free cash flow. If a covenant or rating threshold matters, cite the exact agreement or rating methodology.
Limitations of the ratio
EBITDA is not cash flow. It ignores capital expenditures, working capital needs, and taxes, all of which consume real money before debt gets paid. A capital-hungry business can show a comfortable ratio while generating little free cash.
Other blind spots matter too. The metric says nothing about when debt matures; $300 million due next quarter is a different problem from $300 million due in 2035. It ignores lease obligations unless they are capitalized, and companies can flatter EBITDA with adjustments and add-backs that push the reported ratio down. Finally, a single-period snapshot can mislead when earnings are unusually strong or weak, so look at the trend across several years rather than one financial statement.
Practice investing with Finelo
Build practical investing skills with guided lessons, simulator practice, and structured challenges.
How companies improve the ratio
There are only two levers: reduce debt or grow EBITDA. In practice, management teams combine them:
- Direct debt paydown from operating cash, often prioritizing the most expensive borrowings first.
- Asset sales, using proceeds to retire obligations.
- Margin improvement, since cutting costs raises EBITDA without new revenue.
- Revenue growth that scales earnings faster than borrowing.
- Refinancing discipline, extending maturities so short-term pressure eases while the business earns its way down.
For a business owner, the same logic applies at small scale: a bank will read your leverage the way an analyst reads a public company's.
What to know before deciding
Before you rely on the debt to EBITDA ratio in an investment or lending decision, keep these caveats in mind:
- Check whether the company reports adjusted EBITDA and what the add-backs are.
- Pair the ratio with an interest coverage measure to see whether current earnings cover current interest expense.
- Confirm the debt figure includes all borrowings, and decide whether to net out cash.
- Read the maturity schedule in the filings, not just the total.
- Watch the multi-year trend; rising leverage plus falling earnings is the classic warning pattern.
Decision framework: using debt to EBITDA in your analysis
A simple sequence keeps the metric useful. First, screen: flag anything above 3.0x for a closer look, adjusting the threshold for the industry norms above. Second, contextualize: compare against direct competitors and the company's own five-year history. Third, stress-test: ask what the ratio becomes if EBITDA falls 20 to 30 percent in a downturn. Fourth, cross-check: confirm the story with free cash flow, interest coverage, and the debt maturity ladder. A company passes only when leverage looks manageable under the pessimistic case, not just the reported one.

FAQ
What is a good debt to EBITDA ratio?
Below 3.0x is generally viewed as comfortable for most industries, while above 4.0x to 5.0x suggests elevated risk. Stable, regulated businesses can safely run higher, and cyclical or asset-light firms should run lower.
What does a high debt to EBITDA ratio indicate?
It signals that a company would need many years of current core earnings to repay its debt. That raises refinancing risk, limits flexibility in downturns, and often leads to higher borrowing costs or credit downgrades.
How is net debt to EBITDA different?
Net debt subtracts cash and short-term investments from total debt before dividing by EBITDA. It rewards companies holding large cash buffers and is often the version quoted in loan covenants and earnings calls.
Can the ratio be negative?
Yes, in two very different ways. Negative EBITDA means the business loses money at the operating level, which makes the ratio meaningless and alarming. A negative net debt figure simply means cash exceeds debt, which is a position of strength.
The bottom line
The debt to EBITDA ratio is one of the fastest ways to judge whether a company's borrowing matches its earning power. Calculate it from the filings, compare it with the right industry range, test it against a weaker earnings scenario, and confirm the picture with cash flow and coverage metrics. Used that way, one small division problem tells you a great deal about financial risk before you commit money to a stock or a loan.
InvestingFundamental AnalysisFinancial StatementsBeginner
Practice investing with Finelo
Build practical investing skills with guided lessons, simulator practice, and structured challenges.
About the author
Finelo Team
The Finelo Team creates practical investing and trading education designed to help beginners learn faster with structured challenges, simulator practice, and bite-sized lessons.
Keep reading — Related articles

Investing
Tax-gain harvesting vs. tax-loss harvesting
Compare realizing investment gains with realizing losses, including holding periods, wash sales, offsets, and portfolio tradeoffs.
Finelo Team

Investing
Stable value fund vs. money market fund
Compare investment structure, contract protections, transfer restrictions, net yields, and access inside a retirement account.
Finelo Team

Investing
Single-life vs. joint-life annuity
Compare income for one lifetime with continued payments to a survivor, using equal premiums and matching guarantee terms.
Finelo Team


