The dividend growth rate is the annualized pace at which a company increases its dividend per share over time. You calculate it by comparing dividends across years, either as a simple year-over-year change or as a compound annual growth rate (CAGR). Income investors use it to separate stocks with rising payouts from stocks whose dividends have stalled.
Dividend Growth Rate: How to Calculate It and Why It Matters
Learn how to calculate the dividend growth rate, read it alongside yield and payout ratio, and use it to judge dividend stocks.
7 min read
Practice investing with Finelo
Build practical investing skills with guided lessons, simulator practice, and structured challenges.
Want to learn more?
Build practical investing skills with guided lessons, simulator practice, and structured challenges.
Explore FineloExplore Finelo's 28-day challenges
Turn learning into a daily habit with guided challenge paths.
This page is for investors who want dividend income that grows rather than just a high starting yield. You will learn both calculation methods, how to judge whether growth can continue, and a framework for weighing yield against growth. This material is educational, not financial advice. Read the formulas first, then run the numbers on one dividend payer you already know.
What the dividend growth rate measures
A dividend is the cash a company distributes to shareholders, usually quarterly. The dividend growth rate tracks how fast that payment grows per share, per year. A company paying $1.00 this year and $1.08 next year grew its dividend 8%.
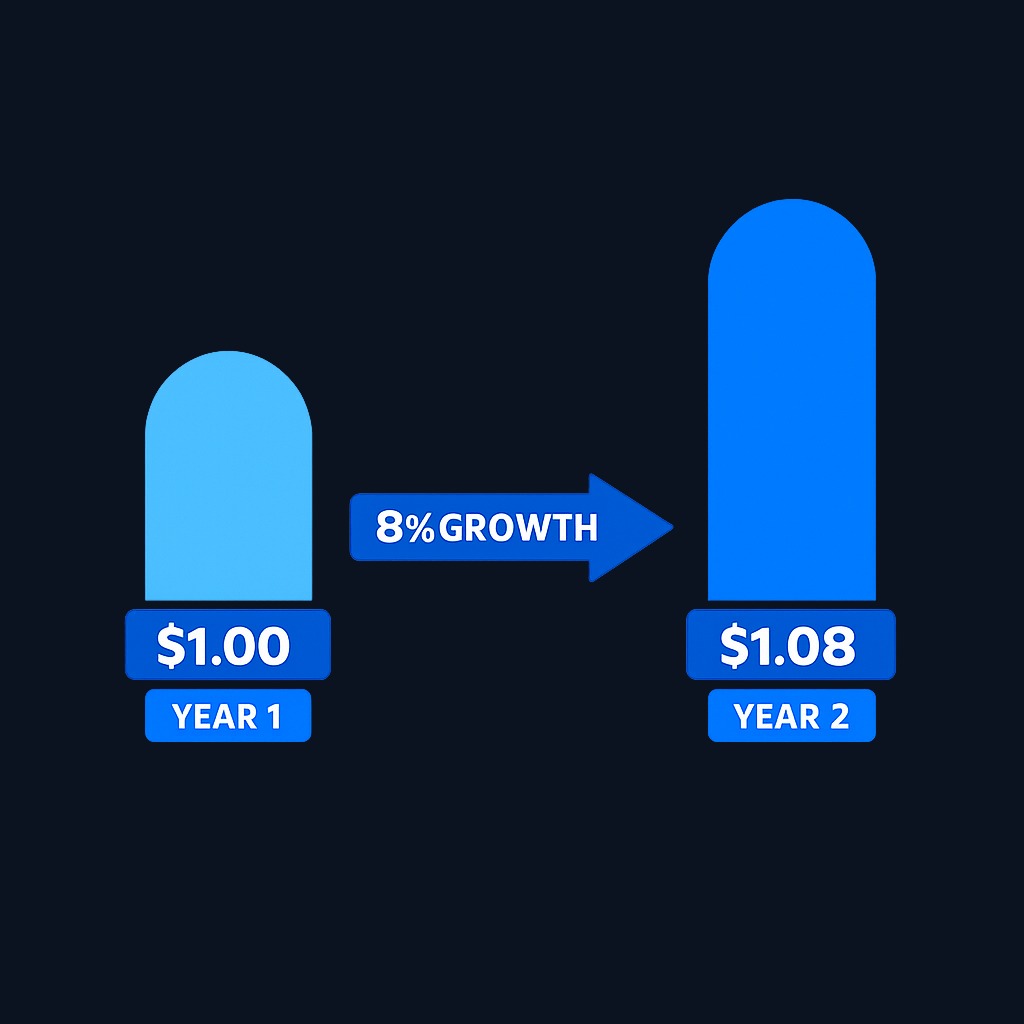
The metric matters because a growing dividend changes the math of long-term income. A stock yielding 2% today with 10% annual dividend growth doubles its payout roughly every seven years. A stock yielding 4% with no growth stays at 4% forever, and inflation erodes it. Growth also acts as a signal: boards generally raise dividends only when they expect profits to support the higher payment, so a long growth streak reflects management's confidence, though it never guarantees the future.
How to calculate it
Year-over-year growth = (this year's dividend ÷ last year's dividend) - 1
That version is simple but noisy. Most analysts prefer the compound annual growth rate across several years:
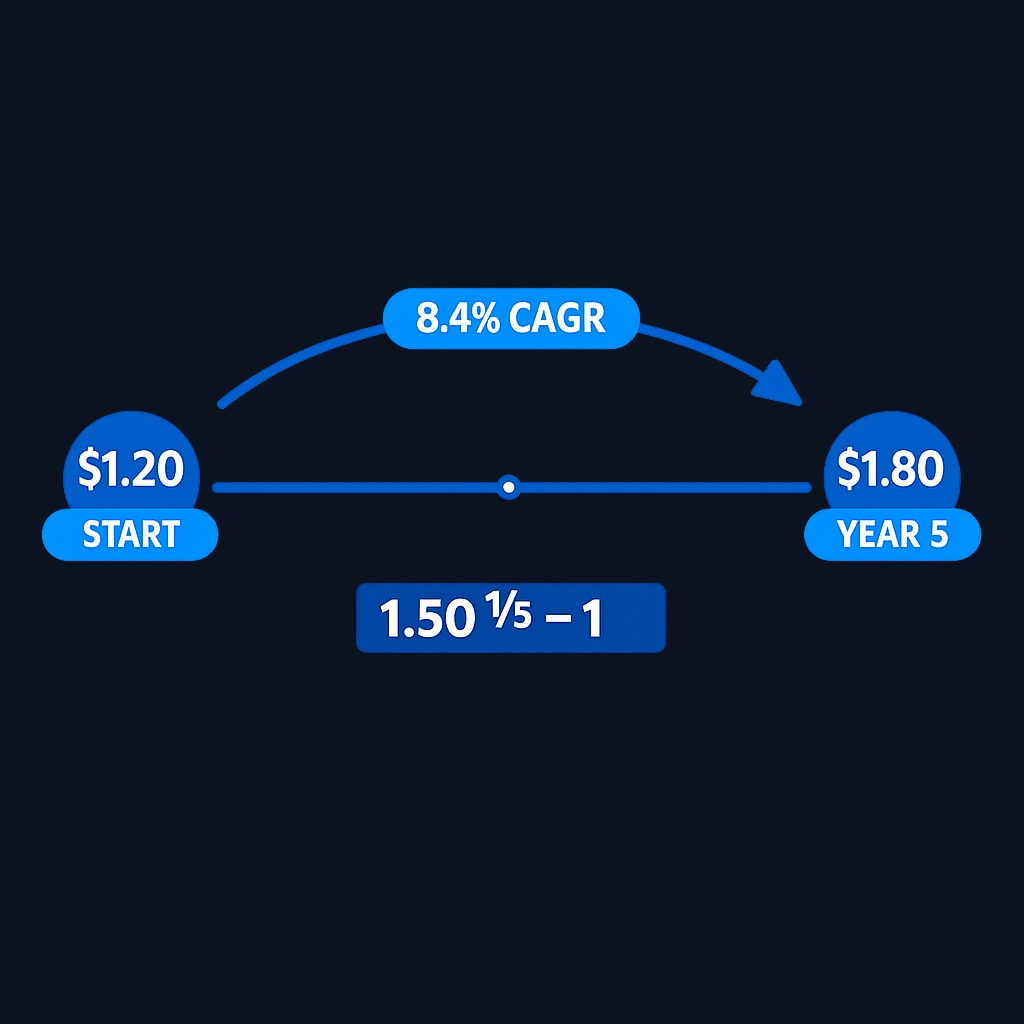
CAGR = (ending dividend ÷ beginning dividend)^(1 ÷ years) - 1
Here is a worked example. A company paid $1.20 per share five years ago and pays $1.80 today:
- Ratio: 1.80 ÷ 1.20 = 1.50
- Years: 5
- CAGR: 1.50^(1/5) - 1 = about 8.4% per year
Three practical tips. Use annual totals rather than a single quarter, because special dividends and mid-year raises distort quarterly snapshots. Compute both a 5-year and a 10-year CAGR when the history exists; a big gap between them shows growth accelerating or fading. And always check the most recent year separately, since a long-term average can hide a recent freeze.
Yield vs growth: a comparison
High current yield and high dividend growth rarely come in the same stock. The table shows the classic profiles:
| Profile | Typical yield | Typical growth | Common examples | Main risk |
|---|---|---|---|---|
| High yield, low growth | Higher | Low single digits | Utilities, telecom | Payout stagnates; cut risk in downturns |
| Moderate yield, steady growth | Middle | Mid single digits | Consumer staples | Slower compounding |
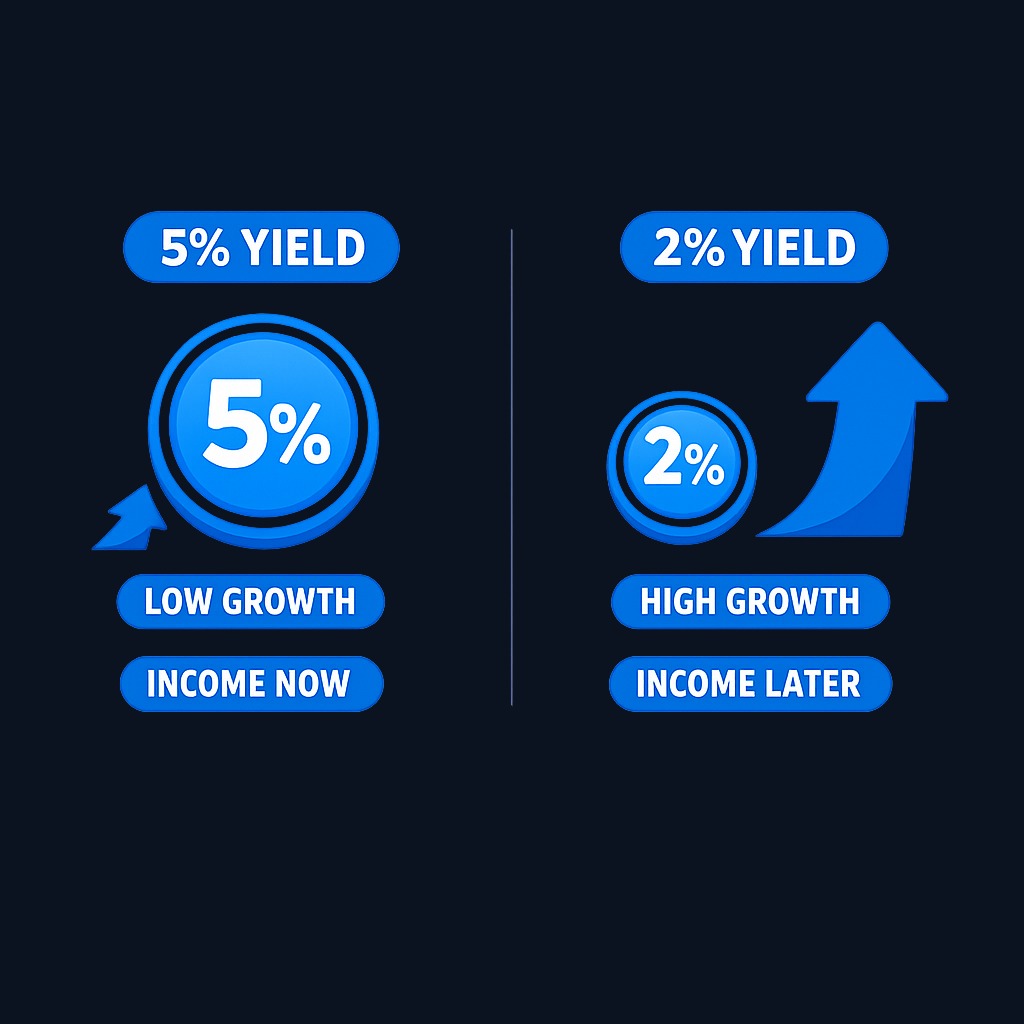
| Low yield, fast growth | Lower | High single digits and up | Technology, healthcare | Income takes years to build |
Neither end is automatically better. The right mix depends on when you need the income. A retiree drawing cash today values current yield more; an investor a decade from drawdown usually benefits more from growth and compounding.
Judging whether growth is sustainable
A dividend growth streak is only as strong as the earnings behind it. Three checks reveal most problems:
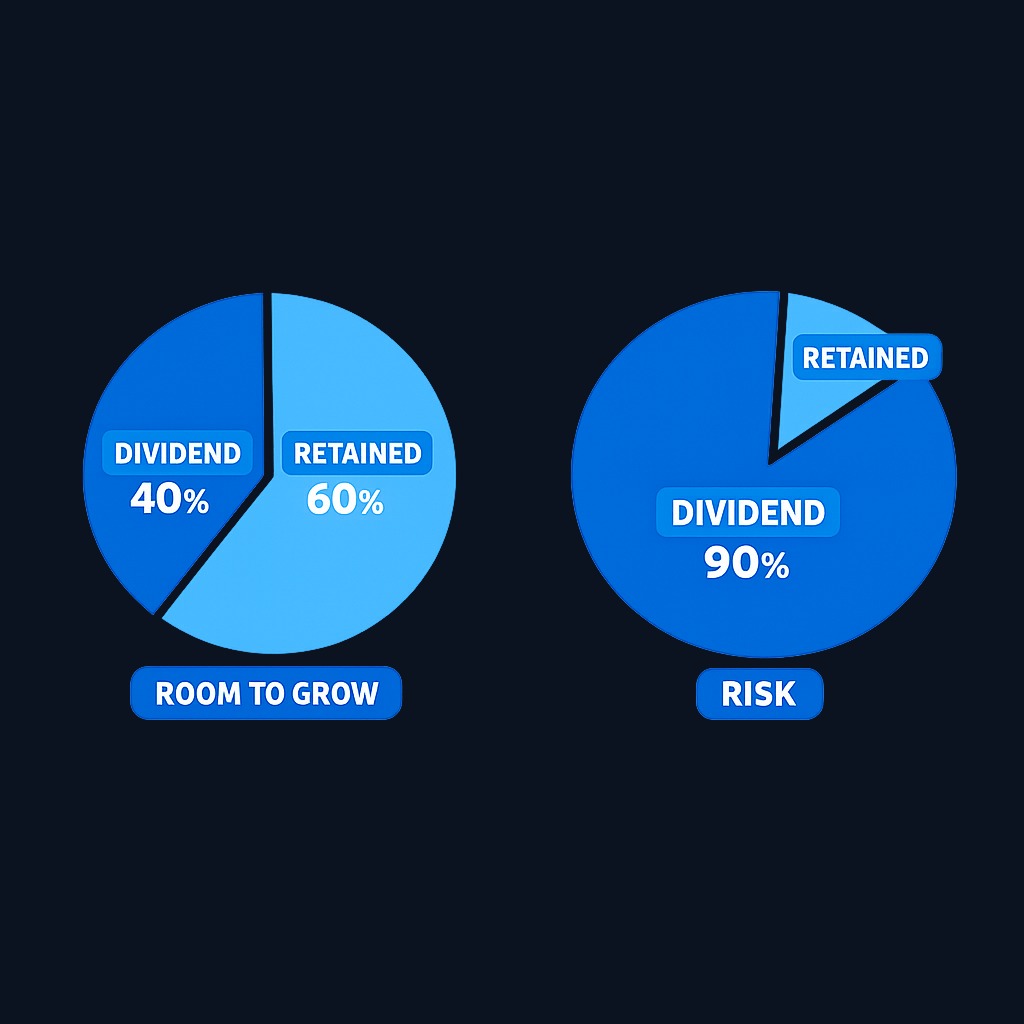
- Payout ratio. Divide dividends by net income. A company paying out 40% of earnings has room to keep raising; one paying 90% is raising on borrowed time. Compare against the company's own history and its industry norm.
- Earnings and cash flow direction. Dividend growth that outpaces earnings growth for years is a warning. The gap eventually closes, usually through a slower raise or a cut.
- Streak history and behavior in recessions. Look at what the company did in past downturns. Boards that protected the dividend through stress tend to prioritize it; boards that cut quickly may cut again.
A useful habit is reading the raise itself. A token increase of a cent or two after years of larger raises often signals a board conserving cash while technically extending the streak.
Practice investing with Finelo
Build practical investing skills with guided lessons, simulator practice, and structured challenges.
Taxes and total return context
Dividend income is taxable in regular brokerage accounts, and the rate depends on classification. The IRS treats dividends as either ordinary or qualified; qualified dividends generally receive the lower capital-gains tax rates, while ordinary ones are taxed as regular income, per IRS Topic No. 404. Holding-period rules apply, so rapid trading can turn otherwise qualified dividends into ordinary ones.
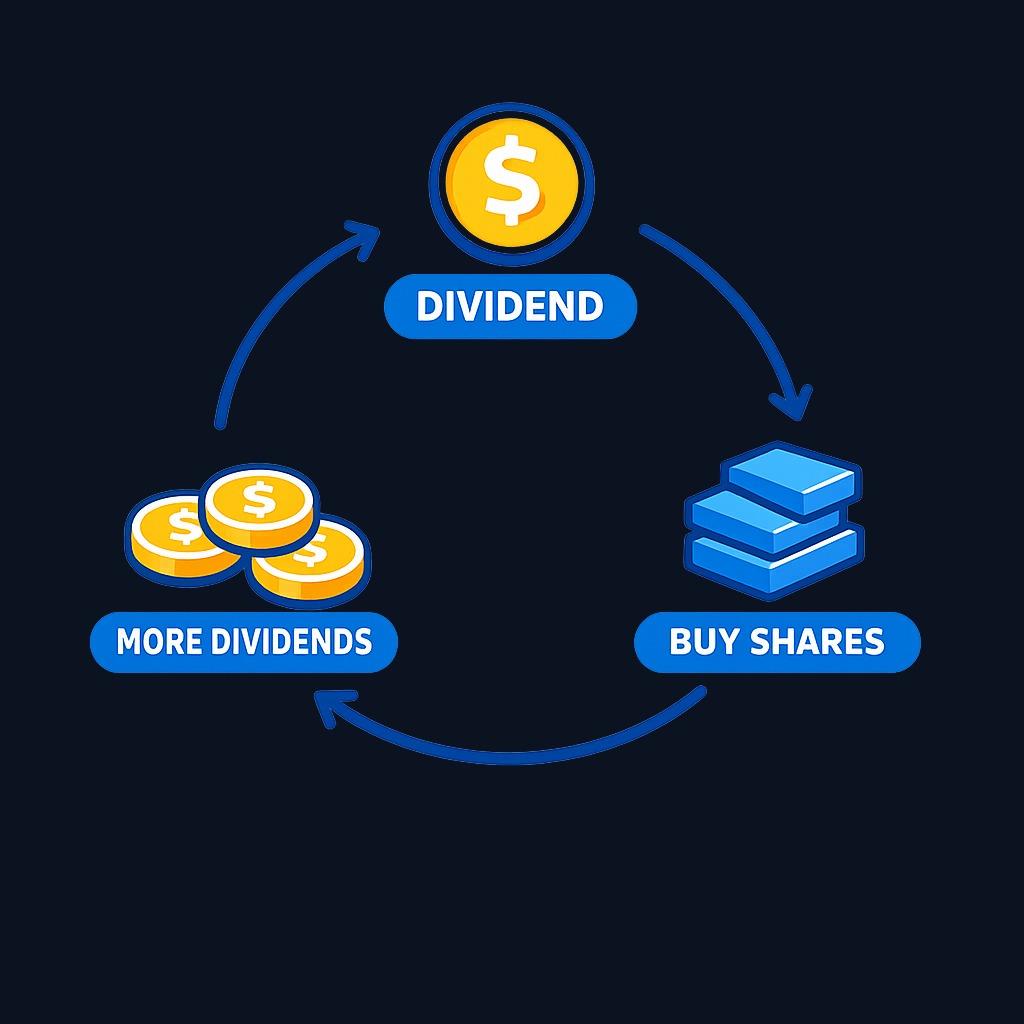
Growth also feeds total return. Reinvested dividends buy more shares, which themselves pay growing dividends. That compounding loop is the engine behind long-term dividend-growth strategies, and it works best when raises are consistent and reinvestment is automatic.
Limitations of the metric
The dividend growth rate looks backward, and that creates blind spots:
- Past raises do not bind the future. A 20-year streak can end in one board meeting.
- Starting points distort CAGR. Measuring from a cut year makes growth look artificially fast; measuring from a peak makes it look slow.
- Buybacks substitute for dividends. Some companies return most cash through repurchases, so a modest dividend growth number understates total shareholder return.
- Currency and special payouts add noise. Foreign payers and one-time specials can make the series jumpy.
- High growth from a tiny base flatters the math. Doubling a token dividend is easy; the percentage means little until the payout is substantial.
Treat the number as one input beside payout ratio, earnings trend, and valuation, never as a standalone signal.
What to know before deciding
Before buying a stock for its dividend growth, confirm four things. First, the calculation window: know whether the quoted growth rate is 1-year, 5-year, or 10-year, because they tell different stories. Second, coverage: the payout ratio and free cash flow should leave room for the next several raises. Third, valuation: a great dividend grower bought at an extreme price can still disappoint. Fourth, your own timeline: growth compounds slowly, so the strategy rewards patience measured in years. Verify the dividend history on the company's own investor relations page rather than relying on aggregated screeners alone.
Decision framework: choosing between dividend stocks
- Define your income horizon. Need cash now? Weight current yield. Building future income? Weight growth.
- Compute the 5-year CAGR yourself. Confirm the screener's number from the company's declared dividends.
- Check the payout ratio against earnings. Prefer raises funded by profit growth, not a rising payout ratio.
- Stress-test the streak. Ask what happened to the dividend in the last recession and whether debt has grown since.
- Compare the combination, not one number. Yield plus growth plus coverage beats any single metric. A 2.5% yield growing 9% with a 45% payout ratio often serves long-term goals better than a static 5% yield.
A common mistake is chasing the longest streak or the highest growth number in isolation. The durable outcomes come from the middle of the triangle: reasonable yield, credible growth, and comfortable coverage.
Conclusion and next steps
The dividend growth rate turns dividend investing from a snapshot into a trajectory: calculate it with the CAGR formula, verify it against payout ratio and earnings, and balance it against current yield for your timeline. Past growth informs but never guarantees the future, so sustainability checks matter as much as the headline number.
Next steps: pick two dividend payers, compute their 5-year dividend CAGRs, and compare payout ratios. If you want structured, beginner-friendly practice with income-investing concepts, Finelo builds these skills through guided lessons.
Frequently asked questions
What is a good dividend growth rate?
Context decides. Mid-single-digit annual growth is solid for mature companies, while faster growth usually comes with lower starting yields. Compare a company against its own history, its sector peers, and inflation rather than a universal benchmark.
How is dividend growth rate different from dividend yield?
Yield measures today's payment against today's price. Growth rate measures how fast the payment rises over time. Yield is a snapshot; growth is a trajectory. Long-term income depends heavily on the trajectory.
Can a company keep raising dividends while earnings fall?
For a while, yes, by raising the payout ratio or borrowing. That pattern is unsustainable and often precedes a cut. Watch payout ratio trends to catch it early.
Should I automatically reinvest growing dividends?
Reinvestment accelerates compounding, and many brokers automate it at no cost. Whether it fits depends on your need for current cash and your tax situation, since dividends in taxable accounts are taxed whether reinvested or not.
dividendgrowthratecalculate
Practice investing with Finelo
Build practical investing skills with guided lessons, simulator practice, and structured challenges.
About the author
Finelo Team
The Finelo Team creates practical investing and trading education designed to help beginners learn faster with structured challenges, simulator practice, and bite-sized lessons.
Keep reading — Related articles

Investing
Tax-gain harvesting vs. tax-loss harvesting
Compare realizing investment gains with realizing losses, including holding periods, wash sales, offsets, and portfolio tradeoffs.
Finelo Team

Investing
Stable value fund vs. money market fund
Compare investment structure, contract protections, transfer restrictions, net yields, and access inside a retirement account.
Finelo Team

Investing
Single-life vs. joint-life annuity
Compare income for one lifetime with continued payments to a survivor, using equal premiums and matching guarantee terms.
Finelo Team


