Earnings per share (EPS) tells you how much profit a company generated for each share of its common stock. You calculate it by taking net income, subtracting preferred dividends, and dividing by the weighted average number of shares outstanding. Investors use EPS to compare profitability across companies and time periods, and it feeds directly into the P/E ratio.
Earnings Per Share: Understanding Its Importance and Calculation
Earnings per share (EPS) tells you how much profit a company generated for each share of its common stock. You calculate it by taking net income, subtracting preferred dividends, and dividing by the weighted average…
7 min read
Practice investing with Finelo
Build practical investing skills with guided lessons, simulator practice, and structured challenges.
Want to learn more?
Build practical investing skills with guided lessons, simulator practice, and structured challenges.
Explore FineloExplore Finelo's 28-day challenges
Turn learning into a daily habit with guided challenge paths.
This page is for beginner investors who want to read earnings reports with confidence. You will learn the formula, the difference between basic and diluted EPS, what moves the number, its blind spots, and a framework for using it well. Everything here is educational, not financial advice.
What is earnings per share (EPS)?
EPS answers a simple question: if the company's profit for the period were split across every common share, how much would each share get? It converts a huge, abstract number like net income into a per-share figure that connects directly to the stock you can actually buy.

That per-share view is what makes EPS the most quoted line in an earnings report. A company earning $10 billion is not automatically a better investment than one earning $1 billion; what matters to a shareholder is profit per unit of ownership. EPS puts companies of different sizes on comparable footing and anchors valuation metrics like the price-to-earnings ratio, where the P/E divides the share price by this exact number.
How to calculate earnings per share
The formula:
EPS = (net income − preferred dividends) ÷ weighted average shares outstanding
Walk through an example. A company reports net income of $500 million for the year, pays $20 million in dividends to preferred shareholders, and has a weighted average of 240 million common shares outstanding:
- Profit available to common shareholders = 500 − 20 = $480 million
- EPS = 480 ÷ 240 = $2.00 per share
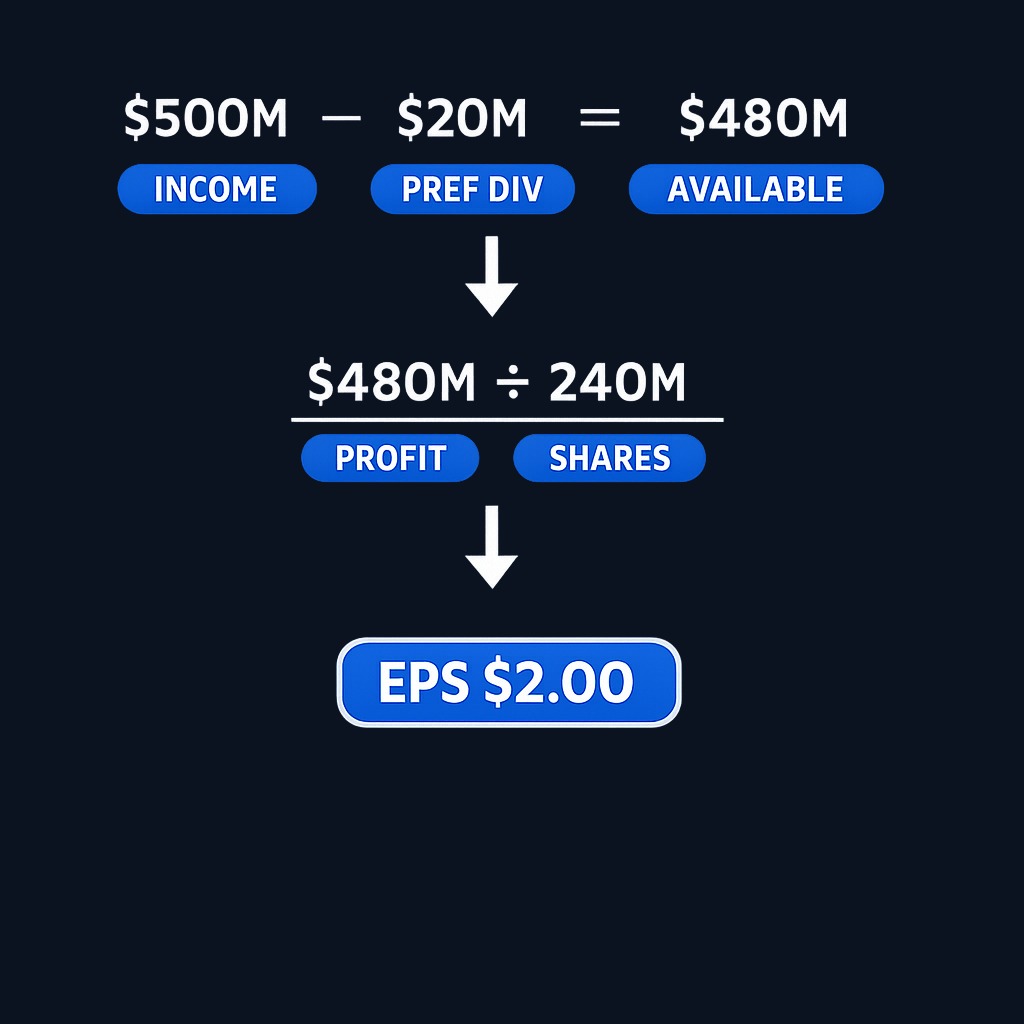
Two details matter. First, preferred dividends come out of the numerator because EPS measures profit available to common shareholders only. Second, the denominator uses the weighted average of shares outstanding over the period, not a single-day count, because buybacks and share issuance change the number of shares during the year. All inputs come from the income statement and share data in the company's financial reports.
Basic vs diluted EPS
Companies report EPS two ways, and the gap between them is informative:
| Version | Share count used | What it shows |
|---|---|---|
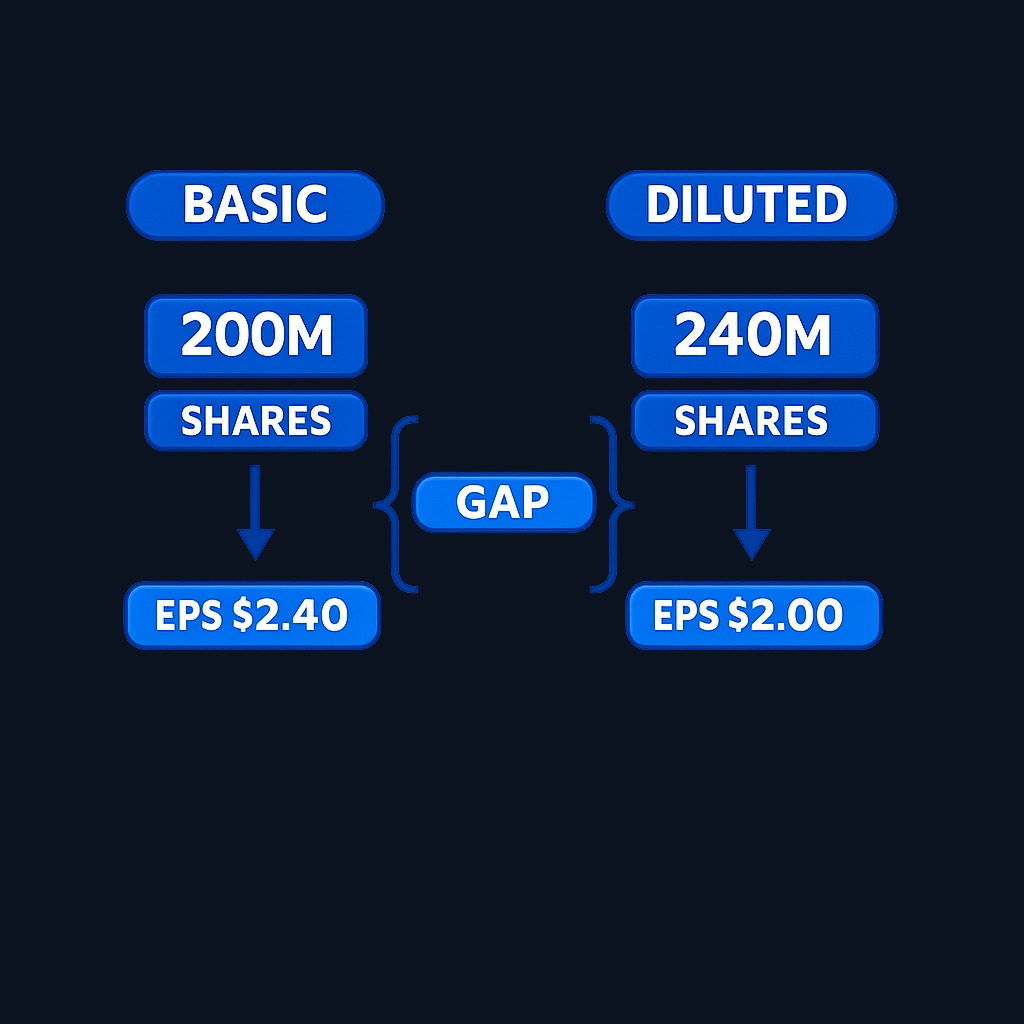
| Basic EPS | Shares currently outstanding (weighted average) | Profit per existing share |
| Diluted EPS | Outstanding shares plus all potential shares | Profit per share if every option, warrant, and convertible converted |
Diluted EPS assumes stock options, warrants, restricted stock units, and convertible securities all become common shares. Because that raises the share count, diluted EPS is equal to or lower than basic EPS. Analysts usually prefer the diluted number as the conservative view of profitability. A wide, persistent gap between basic and diluted figures signals heavy use of stock-based compensation or convertibles, meaning existing shareholders face meaningful future dilution.
Why EPS matters for investors
- Valuation input. The P/E ratio is price divided by EPS, so every P/E discussion is an EPS discussion in disguise.
- Trend tracking. A company growing EPS steadily across years is converting business performance into per-share value; erratic or shrinking EPS invites questions.
- Expectations game. Analysts publish EPS estimates each quarter, and prices often react to whether reported numbers beat or miss the consensus, sometimes sharply.
- Comparability. Within one industry, EPS growth rates help rank how efficiently companies turn revenue into shareholder profit.
One habit separates careful readers from headline readers: check what kind of EPS a report emphasizes. Companies often promote adjusted or non-GAAP EPS, which excludes items management deems one-time. Those adjustments can be legitimate or flattering, so compare them against the official GAAP number in the same report.
Practice investing with Finelo
Build practical investing skills with guided lessons, simulator practice, and structured challenges.
Factors that move EPS
EPS changes for reasons that have nothing to do with a better underlying business, so trace the cause every time:
- Profit changes. Growing revenue or widening margins raises net income, the honest driver of EPS growth.
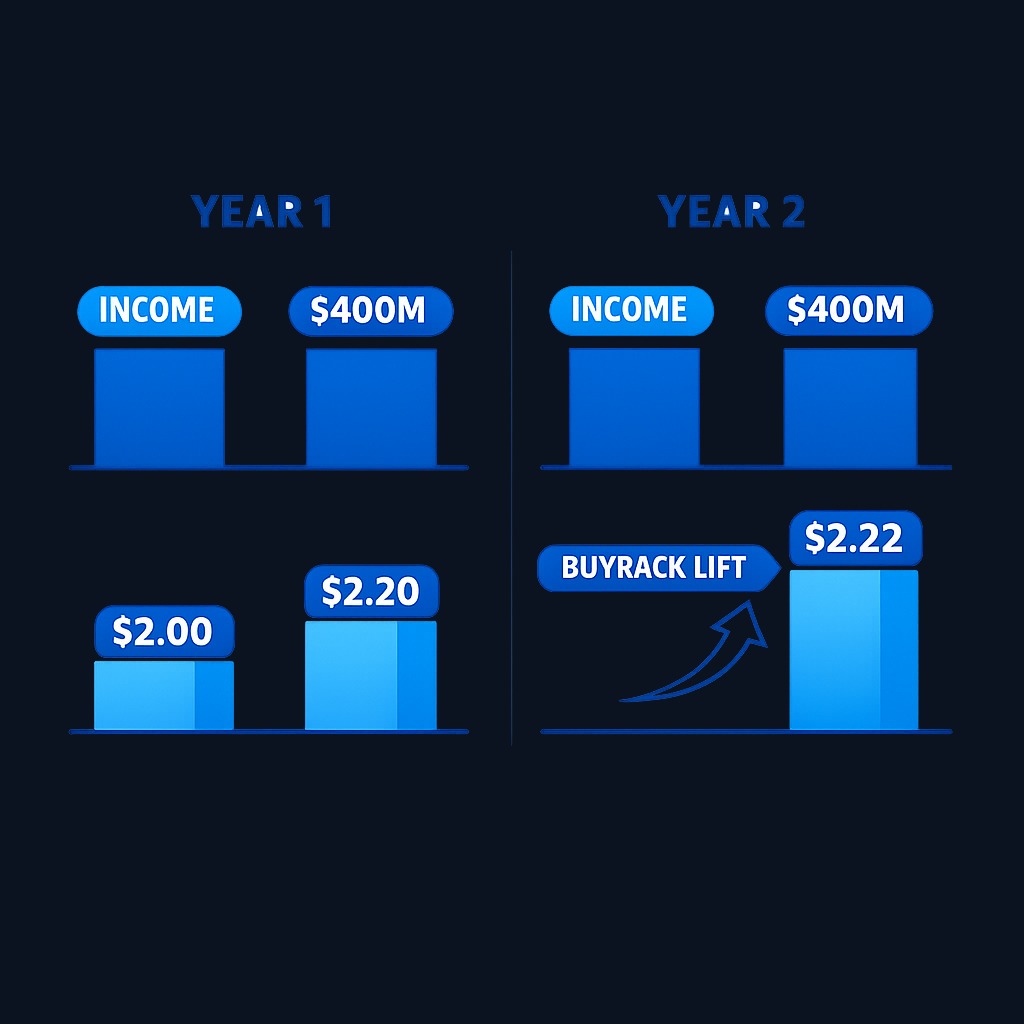
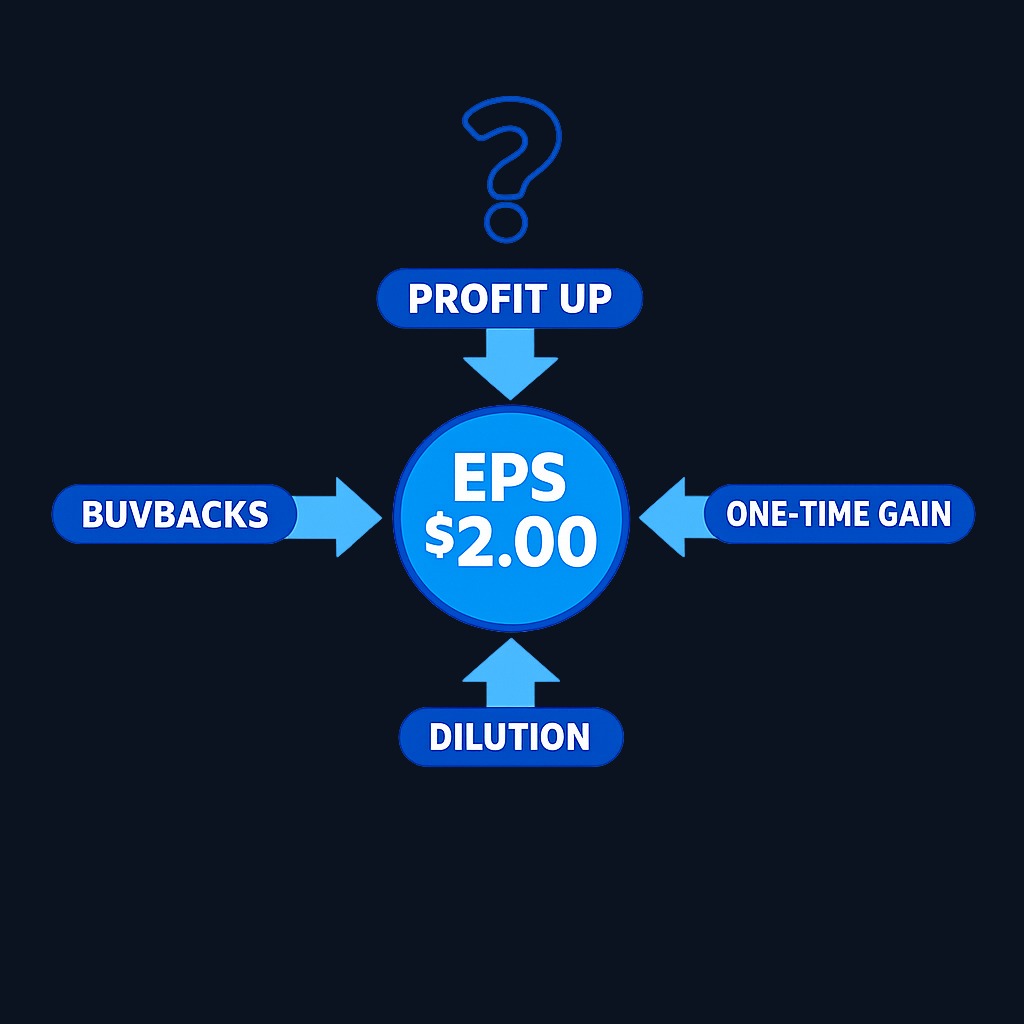
- Share buybacks. Repurchasing stock shrinks the share count and lifts EPS even when total profit is flat. That can still benefit shareholders, but it is arithmetic, not operating improvement.
- Share issuance. New shares from fundraising or stock compensation expand the denominator and dilute EPS.
- One-time items. Asset sales, legal settlements, write-downs, and tax changes can swing a single period's number dramatically.
- Seasonality. Many businesses earn most of their profit in certain quarters, so compare a quarter to the same quarter last year, not to the previous quarter.
A useful check: compare EPS growth to net income growth over the same stretch. When EPS grows much faster than total profit, buybacks are doing a large share of the lifting.
Limitations of EPS
EPS is powerful but narrow, and treating it as a complete verdict causes mistakes:
- It ignores the capital used. Two companies can post identical EPS while one needed far more equity to produce it; return-based metrics catch what EPS misses.
- It says nothing about cash. Accounting profit and cash flow differ, and some companies show positive EPS while cash drains away.
- It can be managed. Timing of expenses, adjustments, and buybacks all polish EPS without improving the business.
- It skips debt. A company can lever up to boost profits and EPS while its risk quietly rises.
- Negative-earnings companies break comparisons. For young or cyclical firms with losses, EPS offers little insight, and other measures like revenue growth or cash burn matter more.
None of this makes EPS useless. It makes EPS a starting point that needs company context, several periods of history, and companion metrics.
Real-world examples of EPS in action
Consider three simplified scenarios investors meet constantly:
- The buyback effect. A company earns the same $400 million two years running but reduces shares outstanding from 200 million to 180 million. EPS rises from $2.00 to about $2.22, an 11% increase with zero profit growth. Reading the share count line prevents mistaking this for operating momentum.
- The dilution drag. A fast-growing firm doubles net income but issues so many new shares for acquisitions and stock compensation that EPS climbs only 40%. Owners captured less growth than the income statement headline implied.
- The beat that wasn't. A company beats quarterly EPS estimates thanks to a one-time tax benefit, while operating profit misses. The stock's initial pop fades as analysts strip out the non-recurring item.
In each case, the number alone misled; the story behind the number carried the truth.
Decision framework: how to use EPS well
- Start with diluted EPS from the official financial statements, not headlines.
- Check five years of history. Consistent growth means more than one strong quarter.
- Compare EPS growth to net income growth to see how much buybacks contribute.
- Reconcile adjusted EPS to GAAP EPS and judge whether exclusions are truly one-time.
- Pair EPS with cash flow and debt before drawing conclusions about quality.
- Then value it. Only after the quality check does the P/E built on that EPS mean anything.
Personal-finance foundation matters too: keep a liquid emergency fund before investing, so market swings never force you to sell at the worst time while you are still learning to read these numbers.
Conclusion and next steps
Earnings per share compresses a company's profitability into the one number shareholders feel directly: profit per unit of ownership. Calculate it from net income minus preferred dividends over weighted average shares outstanding, favor the diluted version, and always ask what moved it, real profit growth, buybacks, or accounting noise, before letting it shape a decision.
Next steps: open the latest annual report of a company you follow, find basic and diluted EPS, and compute the gap. Then compare five years of diluted EPS against net income growth. For structured practice with metrics like this, Finelo offers beginner-friendly investing education you can work through at your own pace.
Frequently asked questions
What is a good EPS?
There is no universal threshold, because EPS scales with share count and company size. What matters is the trend, growing steadily over years, and how the number compares to direct competitors and to the expectations already priced into the stock.
What is the difference between EPS and dividends per share?
EPS measures profit generated per share; dividends per share measure cash actually paid out per share. A company can earn $3.00 per share and pay $1.00 as a dividend, retaining the rest to reinvest in the business.
Why did a company's EPS rise when its profit didn't?
Most often because share buybacks reduced the number of shares outstanding, spreading the same profit across fewer shares. One-time gains and accounting adjustments can also lift EPS temporarily without any operating improvement.
Is negative EPS always bad?
Not automatically. Early-stage companies often run losses while building scale, and cyclical firms dip negative in downturns. Persistent negative EPS with no path to profit is the real warning sign, especially when cash reserves are shrinking at the same time.
earningspershareitscalculation
Practice investing with Finelo
Build practical investing skills with guided lessons, simulator practice, and structured challenges.
About the author
Finelo Team
The Finelo Team creates practical investing and trading education designed to help beginners learn faster with structured challenges, simulator practice, and bite-sized lessons.
Keep reading — Related articles

Investing
Tax-gain harvesting vs. tax-loss harvesting
Compare realizing investment gains with realizing losses, including holding periods, wash sales, offsets, and portfolio tradeoffs.
Finelo Team

Investing
Stable value fund vs. money market fund
Compare investment structure, contract protections, transfer restrictions, net yields, and access inside a retirement account.
Finelo Team

Investing
Single-life vs. joint-life annuity
Compare income for one lifetime with continued payments to a survivor, using equal premiums and matching guarantee terms.
Finelo Team


