Market cap measures the value of a company's equity: share price multiplied by shares outstanding. Enterprise value measures the cost of the whole business: market cap plus debt, minus cash. In the enterprise value vs market cap comparison, market cap prices the stock, while enterprise value prices the entire operation, financing included.
Enterprise Value vs Market Cap: Understanding the Key Differences
Market cap measures the value of a company's equity: share price multiplied by shares outstanding. Enterprise value measures the cost of the whole business: market cap plus debt, minus cash. In the enterprise value vs…
6 min read
Practice investing with Finelo
Build practical investing skills with guided lessons, simulator practice, and structured challenges.
Want to learn more?
Build practical investing skills with guided lessons, simulator practice, and structured challenges.
Explore FineloExplore Finelo's 28-day challenges
Turn learning into a daily habit with guided challenge paths.
This page is for investors who see both numbers on a stock screener and want to know which one to trust for a given decision. You will find the formulas, a worked example, a decision guide, and the traps each metric hides. Everything here is educational, not financial advice.
How to calculate enterprise value and market cap
Market capitalization is the simple one:
Market cap = current share price × shares outstanding
A company with 100 million shares trading at $50 has a market cap of $5 billion. That figure moves every time the stock price moves, and it represents what the equity, and only the equity, is worth at market prices: the value investors currently place on the company's shares.

Enterprise value (EV) builds on it:
EV = market cap + total debt + preferred stock + minority interest − cash and equivalents
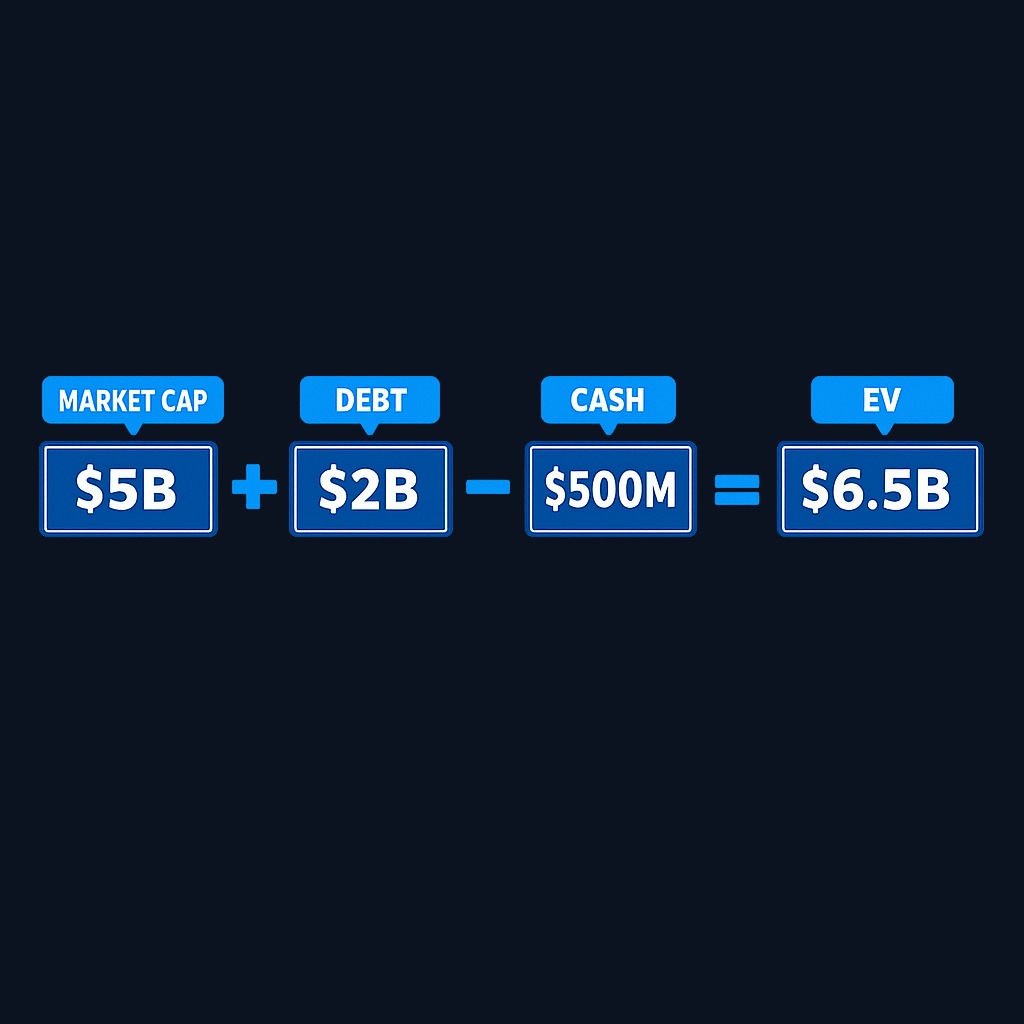
Continue the example. The same $5 billion company carries $2 billion of debt and holds $500 million in cash:
EV = 5.0 + 2.0 − 0.5 = $6.5 billion
The logic mirrors buying a house. The equity is your down payment, the debt is the mortgage you assume, and the cash in the company is money you effectively get back at closing. EV approximates what an acquirer would truly pay to own the business free and clear, which is why analysts call it the takeover price.

Key differences between enterprise value and market cap
| Dimension | Market cap | Enterprise value |
|---|---|---|
| What it values | Equity only | The whole business, capital structure included |
| Includes debt? | No | Yes, added |
| Includes cash? | No | Yes, subtracted |
| Changes with financing decisions? | Only indirectly | Directly, as debt and cash shift |
| Typical pairing | Equity metrics like P/E and earnings per share | Operating metrics like EV/EBITDA and EV/Sales |
| Best quick read | Company size and index classification | Real cost to acquire and capital-structure-neutral comparisons |
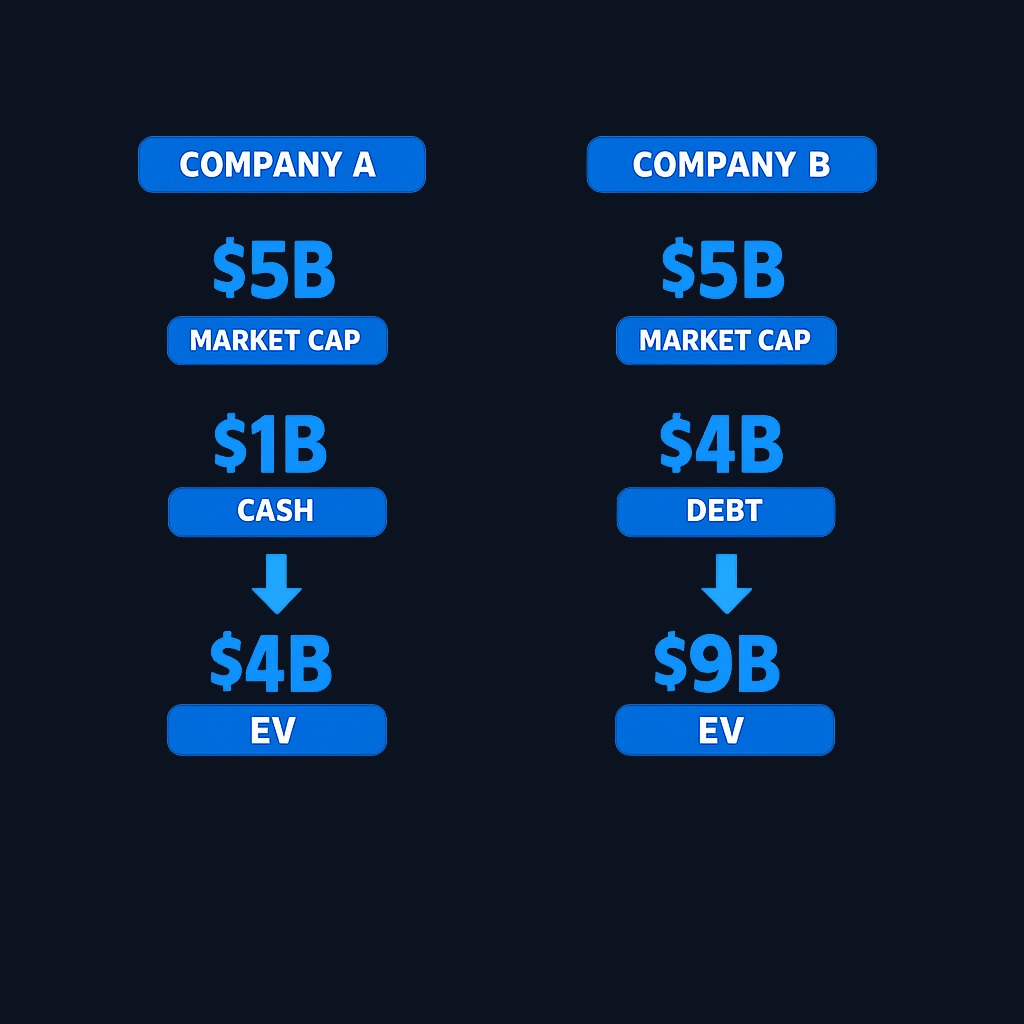
The practical consequence: two companies with identical market caps can be wildly different purchases. A $5 billion market cap firm with no debt and $1 billion of cash has an EV of $4 billion. Another $5 billion firm with $4 billion of debt and little cash has an EV near $9 billion. Same equity price tag, more than double the total cost, and very different risk profiles when conditions tighten.
When to use enterprise value vs market cap
Use market cap when:
- You need a quick read on company size, index membership, or style category (large cap vs small cap).
- You are working with equity-level ratios like P/E, which compare share price to earnings available to shareholders.
- You are sizing positions or screening by liquidity and free float.
Use enterprise value when:
- You compare companies with different debt loads. EV/EBITDA puts a leveraged firm and a debt-free firm on the same footing, which P/E cannot do.
- You think like an acquirer, estimating what taking over the whole business would cost.
- You evaluate capital-intensive sectors, where financing choices dominate the balance sheet.
A useful habit is reading the gap between the two numbers. When EV sits far above market cap, debt is doing heavy lifting, and equity holders sit behind a large creditor claim. That burden grows heavier as borrowing costs climb; benchmark interest rates tracked in the Federal Reserve's H.15 selected interest rates release set the tone for what refinancing that debt will cost. When EV sits below market cap, the company holds more cash than debt, a cushion that pure equity metrics quietly ignore.
Practice investing with Finelo
Build practical investing skills with guided lessons, simulator practice, and structured challenges.
Real-world examples and scenarios
The cash-rich technology firm. Mature software companies often hold large cash reserves and little debt, so EV runs below market cap. Valuing them on market-cap-based ratios alone overstates how expensive the underlying operations are, which is one reason analysts lean on EV/EBITDA in the sector.
The leveraged utility. Utilities and telecoms finance infrastructure with heavy borrowing, pushing EV well above market cap. An investor screening only by market cap sees a mid-sized company; an acquirer sees a much larger total commitment once the debt comes along.
The takeover math. When one company buys another, headlines quote the equity price, but the buyer's board studies EV. Assumed debt raises the true cost, and acquired cash lowers it. Deal premiums make sense only against the enterprise value baseline.
The screening trap. A "cheap" stock with a low P/E can carry an EV several times its market cap. The equity looks inexpensive precisely because the debt absorbs most of the business's value, and equity holders are last in line.
Common misconceptions and caveats
- "Market cap is what the company is worth." It is what the equity is worth. The business as a whole includes its obligations.
- "Lower EV always means cheaper." EV is a raw size figure; cheapness only emerges when you scale it by operating results, as in EV/EBITDA.
- "Cash always reduces the real price." Some cash is trapped overseas, restricted, or needed for operations, so the subtraction can flatter EV.
- "EV works for every company." For banks and insurers, debt is part of the operating machine rather than pure financing, so EV-based ratios are usually avoided in those sectors.
- "The numbers are static." Both metrics drift with share price, and EV also jumps with every refinancing, buyback, or acquisition. Check the date on any figure you use.
Conclusion and next steps
Market cap prices the equity; enterprise value prices the business, debt and cash included. Neither is "right" alone: market cap answers size and per-share questions, while EV answers acquisition and cross-company comparison questions. The gap between them is a one-glance leverage check.
Next steps: pick two companies in the same industry, compute both metrics from their latest filings, and compare the EV-to-market-cap gap. Then try EV/EBITDA beside P/E and note where the rankings disagree. If you want guided practice with valuation building blocks, Finelo teaches these concepts step by step.
Frequently asked questions
Why is enterprise value usually higher than market cap?
Because most companies carry more debt than cash, and EV adds net debt on top of the equity value. When a company holds more cash than debt, the relationship flips and EV falls below market cap.
Can enterprise value be lower than market cap?
Yes. A company with a large net cash position has an EV below its market cap, since an acquirer would effectively recover that cash after buying the equity.
Which is better for comparing two companies?
For operating comparisons across different capital structures, EV paired with EBITDA or sales is the fairer yardstick. For equity-focused questions, size classification, or per-share analysis, market cap and its ratios fit better.
Does a stock buyback change enterprise value?
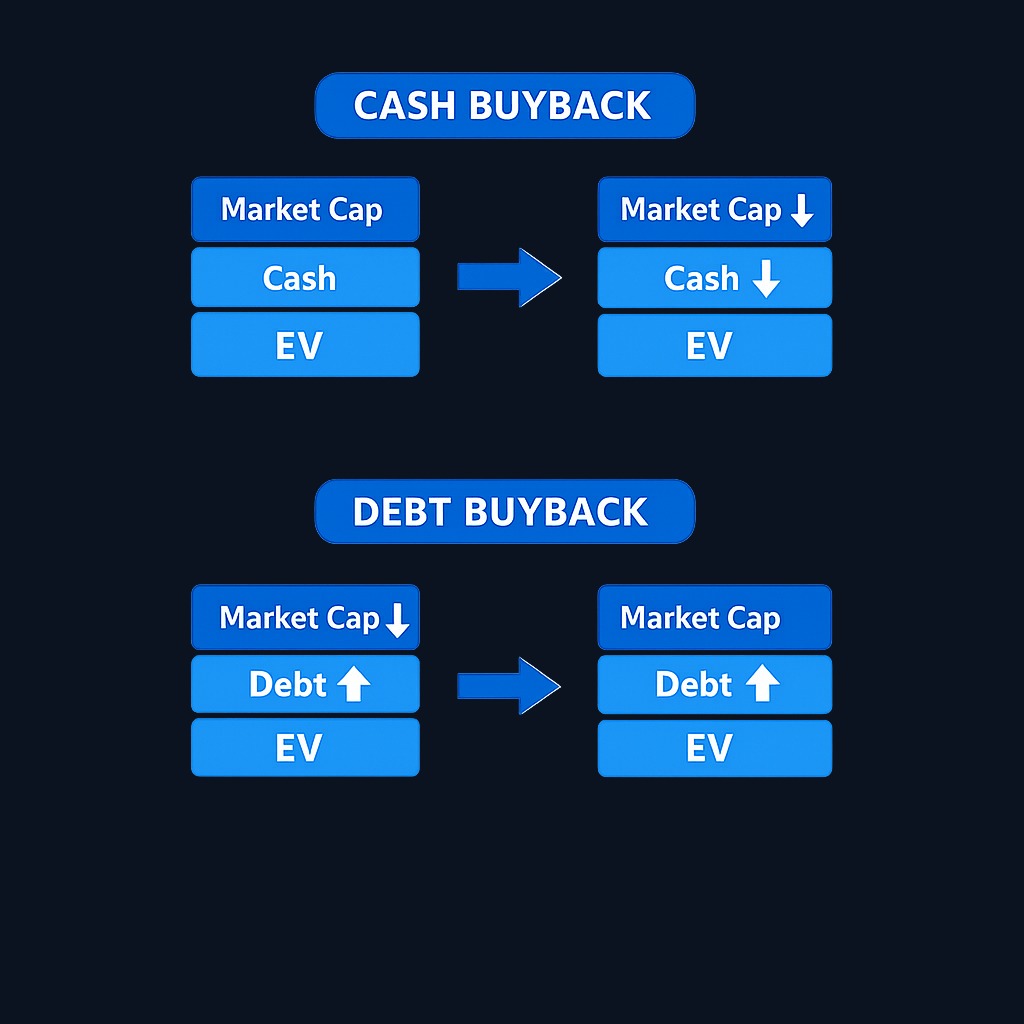
A buyback funded with cash reduces market cap and reduces cash by similar amounts, leaving EV roughly stable. Funding the buyback with new debt keeps EV near constant too, but shifts the balance between equity and debt claims.
enterprisevaluemarketcap
Practice investing with Finelo
Build practical investing skills with guided lessons, simulator practice, and structured challenges.
About the author
Finelo Team
The Finelo Team creates practical investing and trading education designed to help beginners learn faster with structured challenges, simulator practice, and bite-sized lessons.
Keep reading — Related articles

Investing
Tax-gain harvesting vs. tax-loss harvesting
Compare realizing investment gains with realizing losses, including holding periods, wash sales, offsets, and portfolio tradeoffs.
Finelo Team

Investing
Stable value fund vs. money market fund
Compare investment structure, contract protections, transfer restrictions, net yields, and access inside a retirement account.
Finelo Team

Investing
Single-life vs. joint-life annuity
Compare income for one lifetime with continued payments to a survivor, using equal premiums and matching guarantee terms.
Finelo Team


