ETF liquidity is how easily you can buy or sell an ETF's shares at a fair price. It comes from two layers: visible trading on the exchange, plus the fund's ability to create and redeem shares based on its underlying holdings. That second layer means an ETF can be far more liquid than its screen volume suggests.
ETF Liquidity: How It Really Works and How to Judge It
Understand ETF liquidity: the two layers of trading, why volume alone misleads, how spreads work, and how to trade ETFs efficiently.
7 min read
Practice investing with Finelo
Build practical investing skills with guided lessons, simulator practice, and structured challenges.
Want to learn more?
Build practical investing skills with guided lessons, simulator practice, and structured challenges.
Explore FineloExplore Finelo's 28-day challenges
Turn learning into a daily habit with guided challenge paths.
This page is for investors comparing funds, especially anyone worried that a smaller ETF might be "too thinly traded" to own. By the end, you will know which numbers actually measure tradability and which ones mislead. Read the two-layer model first, then use the checklist before your next order. This article is educational, not financial advice.
What ETF liquidity means
Liquidity has a practical definition: the cost and speed of turning shares into cash, or cash into shares, without moving the price against yourself. For a liquid ETF, you can trade a normal-sized order instantly at a price very close to the fund's fair value. For an illiquid one, you pay a wider spread, and larger orders may push the price.
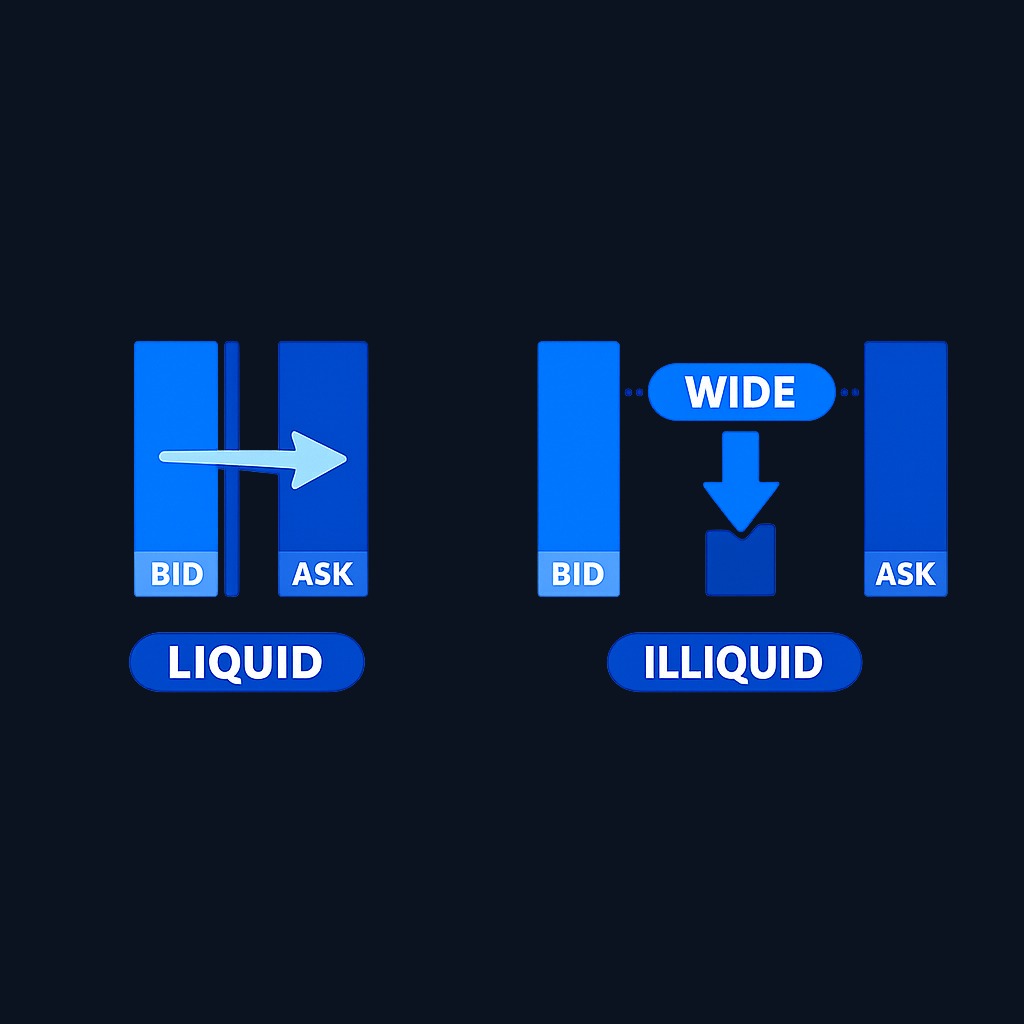
Note what liquidity is not. It is not the fund's size alone, and it is not yesterday's volume alone. Two ETFs with identical volume can have very different true liquidity, because what ultimately backs an ETF's tradability is the liquidity of the securities it holds.
The two layers of ETF liquidity
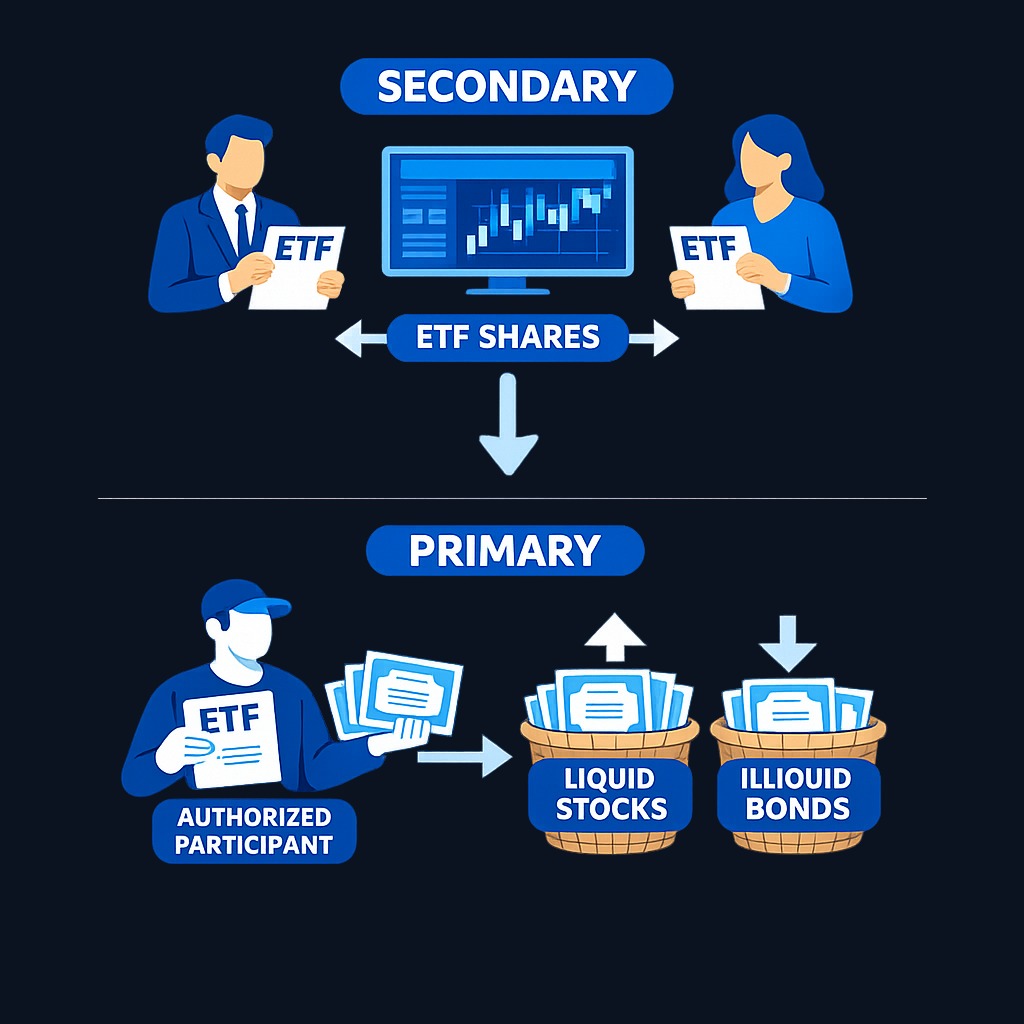
The first layer is the secondary market: ETF shares changing hands between investors on an exchange, just like a stock. Screen volume, quoted depth, and the bid-ask spread all live here.
The second layer is the primary market. Large institutions called authorized participants can create new ETF shares by delivering the underlying basket of securities to the fund, or redeem shares back into that basket. When buying pressure exceeds available shares, they create more. When selling dominates, they redeem. This mechanism ties supply to demand.
The practical consequence: an ETF holding deeply traded large-cap stocks can absorb large orders even if the ETF itself trades rarely, because market makers can hedge and create shares using the liquid underlying basket. Liquidity flows through from the holdings. An ETF holding thinly traded small-caps or exotic bonds has a lower ceiling, no matter its own volume.
Why volume alone misleads
Many investors screen out ETFs with low average daily volume. That rule throws away good funds and keeps some deceptive ones. A new or niche ETF may trade a few thousand shares a day yet quote tight spreads, because market makers price it competitively off the underlying basket even when few trades occur. Meanwhile, a high-volume ETF holding illiquid assets can gap badly in stress, because its real backstop, the basket, is hard to trade.
A better habit is to look at the spread and the holdings together:
| Signal | What it tells you | What it misses |
|---|---|---|
| Average daily volume | How often shares change hands | The creation/redemption backstop |
| Bid-ask spread | The real round-trip cost today | Depth for very large orders |
| Underlying holdings' liquidity | The ceiling on true tradability | Nothing, but it is harder to check |
| Fund size (AUM) | Viability and closure risk | Trading cost at your order size |
Bid-ask spreads: the visible cost
The spread is the gap between the highest price buyers bid and the lowest price sellers ask. It is your immediate, unavoidable trading cost. The SEC's ETF investor bulletin uses a clean example: an ETF quoted at $59.50 bid and $60.00 ask carries a 50-cent spread. Buy 200 shares at the ask and sell them immediately at the bid, and you lose $100. The bulletin also notes that more liquid, higher-volume ETFs typically quote tighter spreads, and that a fund's median bid-ask spread is published on the ETF's own website.
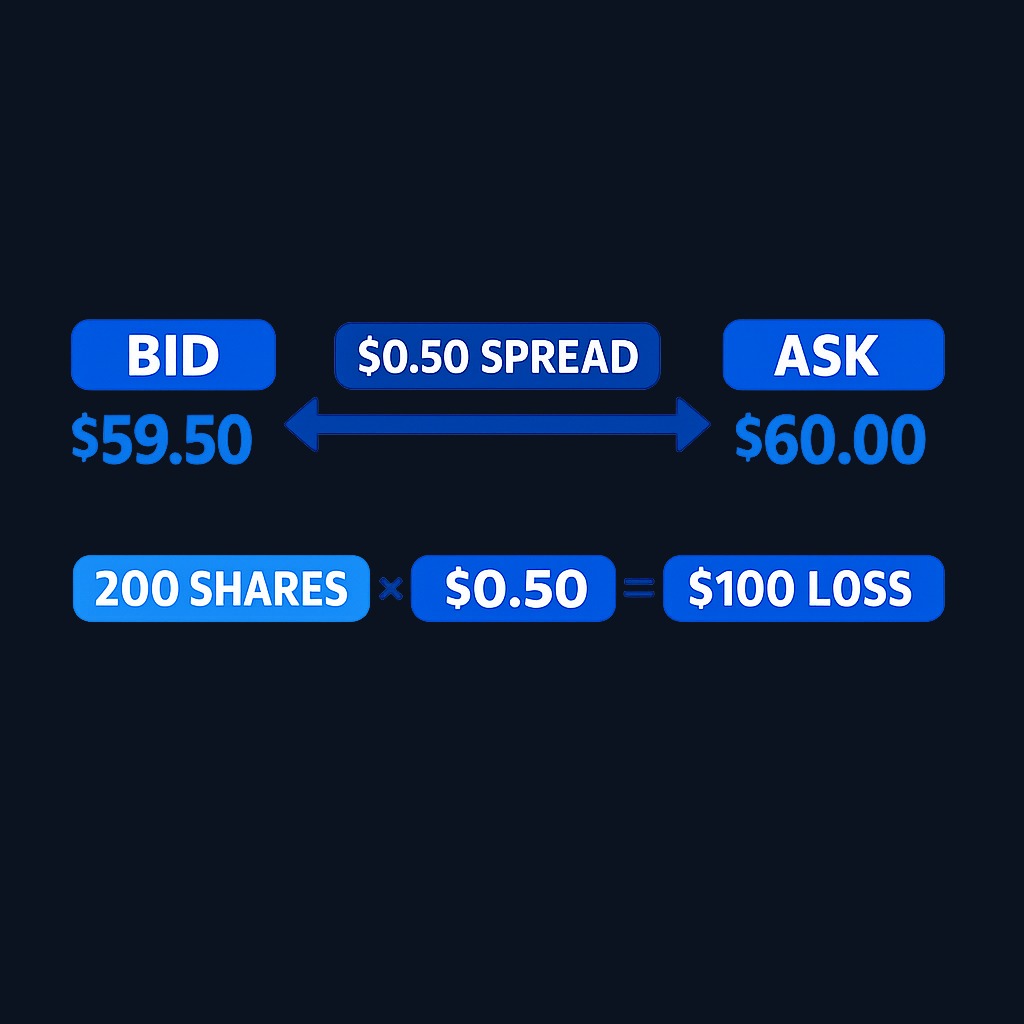
Treat the spread as a percentage. A 2-cent spread on a $100 ETF is 0.02% per round trip, negligible for a long-term holder. A 50-cent spread on a $60 ETF is 0.83%, which can exceed a year of expense-ratio savings from picking the "cheaper" fund.
Practice investing with Finelo
Build practical investing skills with guided lessons, simulator practice, and structured challenges.
How to judge an ETF's liquidity
Run this five-point check before buying:
- Median bid-ask spread. Find it on the issuer's fund page. Under roughly 0.05% is excellent for most equity ETFs; treat materially wider spreads as a real cost.
- Spread in percentage terms at your trade size. Watch the live quote for a minute. Note how much size sits at the bid and ask.
- Underlying holdings. Large-cap domestic stocks trade easily; high-yield bonds, frontier markets, and micro-caps do not. The basket sets the ceiling.
- Average daily volume in context. Use it as a supporting signal, not a filter. Compare your intended order to typical volume.
- Fund size and age. Very small funds carry closure risk, which is an inconvenience risk more than a loss risk, but worth knowing.
If a fund fails on spread and holdings, no volume statistic should talk you back into it.
Trading practices that protect you
A few habits capture most of the benefit:
- Use limit orders. They cap the price you accept, which matters most exactly when liquidity thins out.
- Avoid the first and last minutes of the session. Spreads are often widest right after the open, before market makers settle on fair value.
- Be careful in stressed markets. During sharp selloffs, spreads widen and prices can detach from fair value. If you do not need to trade, waiting is often cheaper.
- Split unusually large orders. If your order is a meaningful share of daily volume, work it in pieces or over time.
What to know before deciding
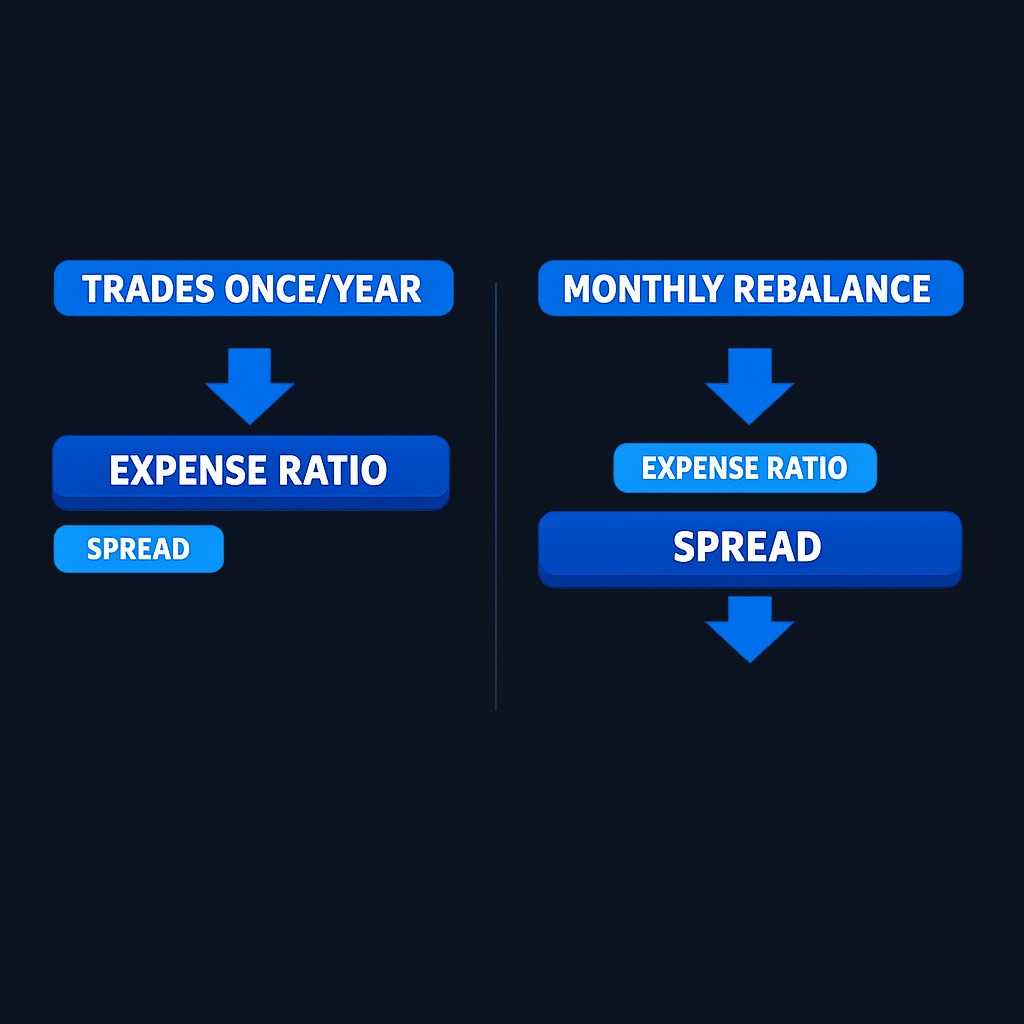
Before choosing between similar ETFs, compare total cost of ownership: expense ratio plus your expected trading costs from spreads, scaled by how often you trade. Confirm the underlying market is one that stays tradable when you might need to sell. Check the issuer's published spread and premium/discount history. And match the fund to your horizon: a long-term holder trading twice a decade can tolerate a wider spread than an active trader rebalancing monthly.
Decision framework: choosing between two similar ETFs
- Same exposure? If the indexes differ meaningfully, decide on exposure first; liquidity is a tiebreaker.
- Compare expense ratios. This is your recurring cost.
- Compare median spreads. This is your per-trade cost. Weight it by your trading frequency.
- Check basket liquidity. Prefer the fund whose holdings you could sell in a bad week.
- Only then consider volume. Between two funds that tie on everything else, the more actively traded one usually offers easier fills.
An investor trading once a year should weight step 2 heaviest. A monthly rebalancer should weight step 3.
Conclusion and next steps
ETF liquidity lives in two layers: the visible market where shares trade, and the creation and redemption machinery that connects the ETF to its underlying basket. Spreads are the honest price tag of tradability, holdings set the ceiling, and volume is only a supporting clue.
Next steps: pick two ETFs you are comparing, find each one's median bid-ask spread and top holdings, and compute the round-trip spread cost at your typical order size. To build these evaluation skills with guided lessons, try the Finelo app, which teaches investing fundamentals for beginners step by step.
Frequently asked questions
Is a low-volume ETF unsafe to buy?
Not automatically. If the fund's holdings are liquid and its quoted spread is tight, market makers can create and redeem shares to meet demand. Judge the spread and the basket, not the volume alone.
What makes an ETF's spread widen?
Volatility, uncertainty about the value of the underlying holdings, closed or illiquid underlying markets, and thin market-maker competition. Spreads also widen briefly around the market open and during stress.
How do I find an ETF's typical spread?
Fund issuers publish a median bid-ask spread figure on each ETF's page, and you can watch the live bid and ask in your brokerage before trading. Compare the spread as a percentage of price.
Does ETF liquidity matter for long-term investors?
Less than for traders, but it still matters at entry and exit. A wide spread is a real one-time cost, and illiquid underlying assets can mean bigger discounts if you must sell during stress.
etfliquidityreallyjudge
Practice investing with Finelo
Build practical investing skills with guided lessons, simulator practice, and structured challenges.
About the author
Finelo Team
The Finelo Team creates practical investing and trading education designed to help beginners learn faster with structured challenges, simulator practice, and bite-sized lessons.
Keep reading — Related articles

Investing
Tax-gain harvesting vs. tax-loss harvesting
Compare realizing investment gains with realizing losses, including holding periods, wash sales, offsets, and portfolio tradeoffs.
Finelo Team

Investing
Stable value fund vs. money market fund
Compare investment structure, contract protections, transfer restrictions, net yields, and access inside a retirement account.
Finelo Team

Investing
Single-life vs. joint-life annuity
Compare income for one lifetime with continued payments to a survivor, using equal premiums and matching guarantee terms.
Finelo Team


