Definition note: This article uses the common non-GAAP convention (cash flow from operations − capital expenditures) ÷ revenue. It is not identical to FCFF or FCFE, and “free” does not mean cash can be distributed without considering debt, liquidity, taxes, acquisitions, or future investment. Working-capital timing and deferred capital spending can also inflate a period. CFA Institute distinguishes FCFF and FCFE.
Free Cash Flow Margin: What It Is, How to Calculate It, and Why It Matters

Free cash flow margin measures how much of every revenue dollar a company converts into free cash flow. The formula is simple: free cash flow divided by revenue, expressed as a percentage. A business with $2 billion in…
8 min read
Practice investing with Finelo
Build practical investing skills with guided lessons, simulator practice, and structured challenges.
Want to learn more?
Build practical investing skills with guided lessons, simulator practice, and structured challenges.
Explore FineloExplore Finelo's 28-day challenges
Turn learning into a daily habit with guided challenge paths.
Free cash flow margin measures how much of every revenue dollar a company converts into free cash flow. The formula is simple: free cash flow divided by revenue, expressed as a percentage. A business with $2 billion in revenue and $400 million of free cash flow runs a 20% free cash flow margin, meaning twenty cents of each sales dollar comes out the other side as spendable cash. This page is for investors learning to judge business quality beyond reported earnings. Below you will find the calculation with a worked example, interpretation benchmarks by industry, the traps that distort the ratio, and a decision framework for using it in your own analysis.
What free cash flow actually is
Free cash flow (FCF) is the cash a company generates from operations minus capital expenditures, the money reinvested in property, equipment, and technology to keep the business running and growing.
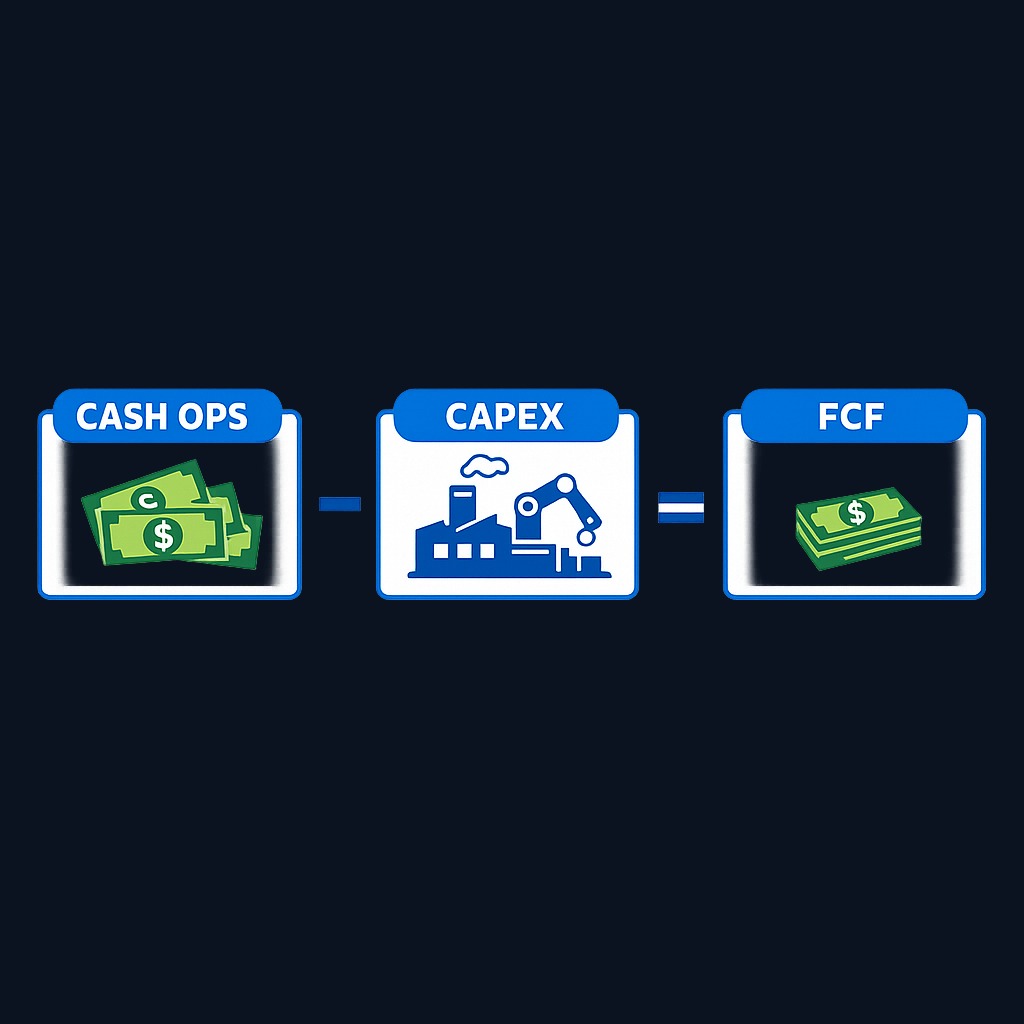
FCF = operating cash flow − capital expenditures
Both inputs come from the cash flow statement, which makes FCF harder to cosmetically improve than net income. Earnings absorb non-cash items like depreciation, stock-based compensation adjustments, and accrual timing; cash flow records money that actually moved. That is why many professional investors treat free cash flow as the cleaner measure of what a business truly produces for its owners. Public companies file these statements with the SEC, and you can pull any filer's cash flow statement directly from the EDGAR database to run the numbers yourself.
How to calculate free cash flow margin
Free cash flow margin = (free cash flow ÷ revenue) × 100
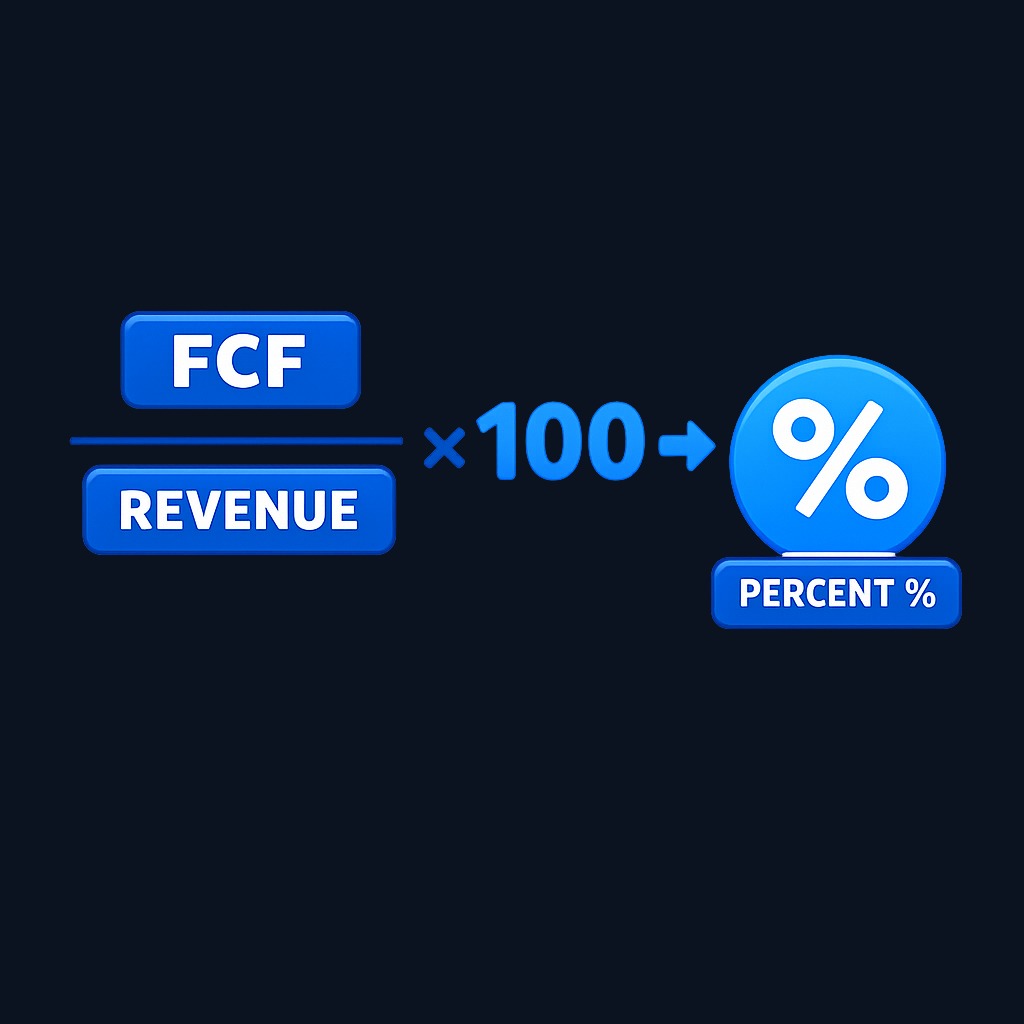
A worked example. Suppose a software company reports:
| Line item | Amount |
|---|---|
| Revenue | $5,000 million |
| Operating cash flow | $1,650 million |
| Capital expenditures | $250 million |
| Free cash flow | $1,400 million |
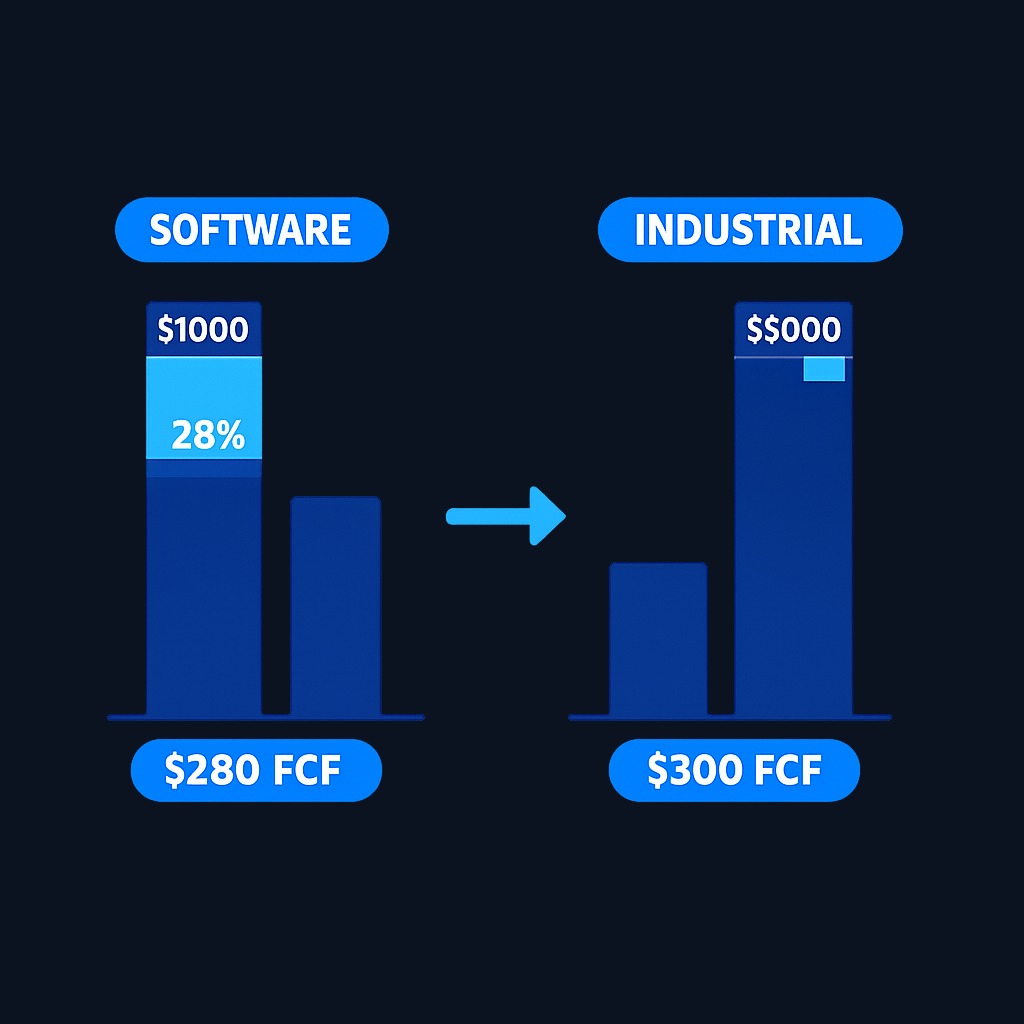
| FCF margin | 28% |
The company converts 28% of sales into free cash. Now compare a heavy industrial with $5,000 million of revenue, $900 million of operating cash flow, and $600 million of capex: its FCF is $300 million and its margin is 6%. Same revenue, radically different cash economics. The margin makes that difference visible in one number, which raw FCF totals cannot do across companies of different sizes.
Why free cash flow margin matters
- It measures conversion quality. Revenue growth means little if none of it becomes cash. The margin shows how efficiently sales turn into resources the company can actually deploy.
- It funds everything shareholders care about. Dividends, share buybacks, debt paydown, and acquisitions are all paid from free cash flow, not from accounting earnings.
- It resists manipulation. Because it is built from cash movements, the ratio is harder to dress up than earnings-based margins, though not impossible.
- It reveals business-model strength. Durably high margins usually signal pricing power, low capital intensity, or both, the raw ingredients of what analysts call an economic moat.
- It sharpens comparisons. Two competitors can post identical net margins while one quietly consumes far more capital to stay in place. The FCF margin catches it.
Peer comparison: avoid universal FCF-margin cutoffs
Capital intensity, working-capital structure, acquisition policy, and the chosen FCF definition differ across companies. Use a named peer set and calculate each margin from the same fields over matching periods. Explain changes in receivables, payables, inventory, asset sales, and capital expenditure instead of applying a universal sector table.
Common pitfalls when analyzing FCF margin
- One-year snapshots. A margin can spike simply because management deferred capex or stretched supplier payments. Average three to five years before drawing conclusions.
- Ignoring capex cycles. A company mid-way through building factories shows depressed margins that may rebound sharply. Judge the phase, not just the number.
- Working-capital noise. Big swings in receivables, payables, or inventory can inflate or crush a single period's operating cash flow without changing the underlying business.
- Stock-based compensation. Cash flow statements add SBC back, flattering FCF for companies that pay heavily in shares while diluting owners. Consider netting it out for a stricter view.
- Cross-industry comparisons. Scoring a grocery chain against a software firm on FCF margin tells you about their industries, not their management.
- Negative margin panic. For young companies, negative free cash flow can be rational investment. The question is whether unit economics point toward future conversion, not whether today's number is red.
Practice investing with Finelo
Build practical investing skills with guided lessons, simulator practice, and structured challenges.
How companies improve their free cash flow margin
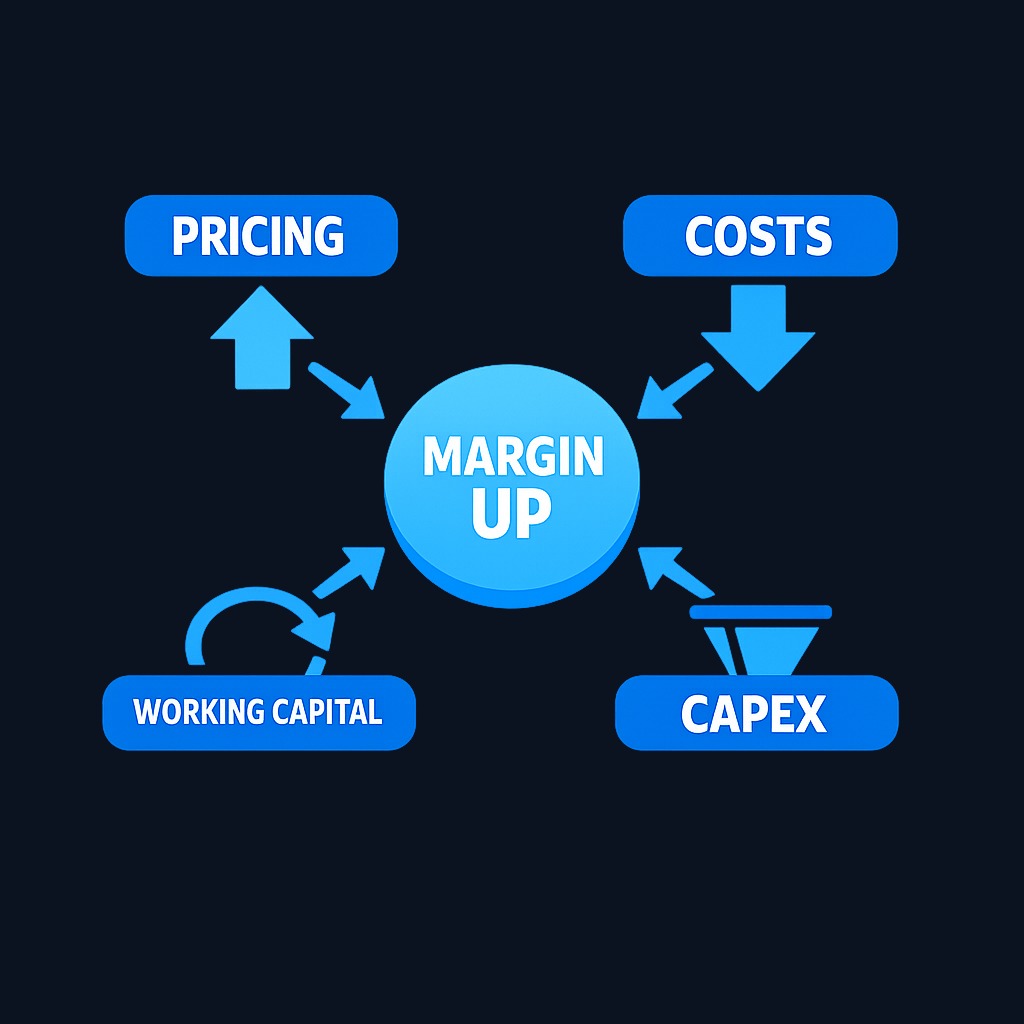
Management teams pull four levers. They raise prices or shift mix toward higher-margin products, which lifts operating cash flow directly. They cut the cash cost base, from procurement terms to headcount discipline. They tighten working capital, collecting receivables faster and holding leaner inventory. And they spend capital more selectively, favoring projects with faster paybacks. For an investor, the interesting part is durability: margin gains from pricing power tend to persist, while gains from starving necessary capex quietly borrow from the future and often reverse.
What to know before deciding
Free cash flow margin is one of the highest-signal single ratios available, but it works best inside a small dashboard rather than alone. Pair it with revenue growth to see whether cash conversion survives scaling, with debt levels to see who has first claim on that cash, and with return on invested capital to see what reinvested dollars actually earn. Verify the inputs in the company's own filings rather than relying on pre-computed screens, since data providers define free cash flow inconsistently. And remember that the ratio describes the past; your judgment about whether the margin is sustainable is the actual investment decision.
Decision framework: using FCF margin in your analysis
| Your goal | How to apply the ratio |
|---|---|
| Screening for quality businesses | Require a positive multi-year average FCF margin, then investigate durability |
| Comparing two competitors | Compare margins over the same 3-5 year window within the same industry |
| Evaluating a dividend payer | Check that dividends are covered by free cash flow, not funded by debt |
| Assessing a growth company | Watch the margin's trajectory toward positive rather than its current level |
FAQ
What is a good free cash flow margin?
There is no reliable universal 8%, 15%, or 25% cutoff. Compare consistently calculated margins with direct peers and the company's own history, and explain unusual working-capital or capital-expenditure changes.
How is free cash flow margin different from net profit margin?
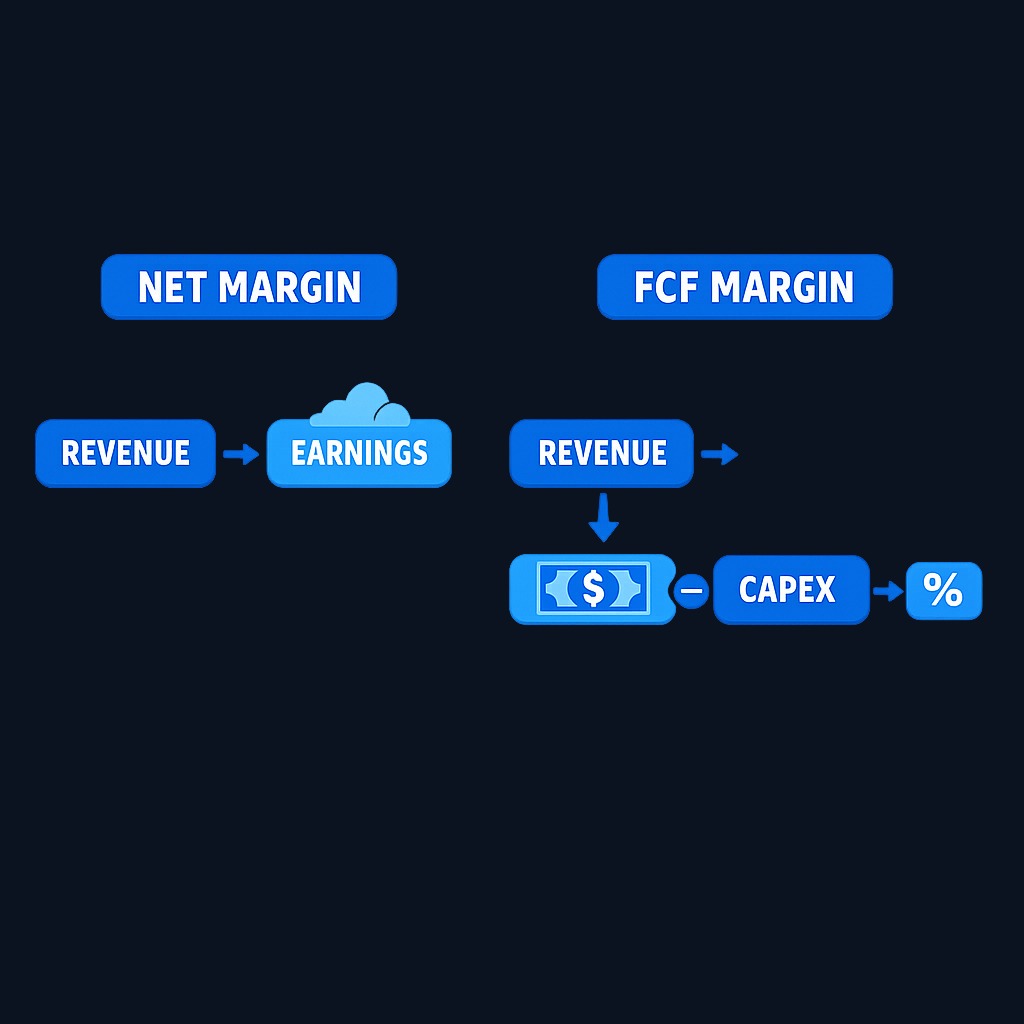
Net margin is based on accounting earnings, which include non-cash items and accrual estimates. FCF margin is based on cash actually generated after reinvestment, so it more directly measures what the business produces for shareholders.
Can free cash flow margin be negative?
Yes. Heavy investment phases, working-capital swings, or genuine operating losses all push it negative. For young companies that can be a deliberate choice; for mature ones it deserves scrutiny.
Where do I find the numbers to calculate it?
Revenue sits on the income statement; operating cash flow and capital expenditures sit on the cash flow statement. Both appear in a company's quarterly and annual filings, available free through the SEC's EDGAR system.
Conclusion and next steps
Free cash flow margin distills a business down to one question: how much of each sales dollar becomes cash the owners could actually use? Calculate it from the filings, average it across years, benchmark it inside the industry, and interrogate any sudden improvement. Used that way, it exposes both quiet compounders and expensive treadmills that earnings alone can hide. As a next step, pick three companies you already follow, compute their five-year average FCF margins from EDGAR filings, and rank them; the exercise teaches more than any definition can.
InvestingFundamental AnalysisFinancial StatementsBeginner
Practice investing with Finelo
Build practical investing skills with guided lessons, simulator practice, and structured challenges.
About the author
Finelo Team
The Finelo Team creates practical investing and trading education designed to help beginners learn faster with structured challenges, simulator practice, and bite-sized lessons.
Keep reading — Related articles

Investing
Tax-gain harvesting vs. tax-loss harvesting
Compare realizing investment gains with realizing losses, including holding periods, wash sales, offsets, and portfolio tradeoffs.
Finelo Team

Investing
Stable value fund vs. money market fund
Compare investment structure, contract protections, transfer restrictions, net yields, and access inside a retirement account.
Finelo Team

Investing
Single-life vs. joint-life annuity
Compare income for one lifetime with continued payments to a survivor, using equal premiums and matching guarantee terms.
Finelo Team


