Definition note: Net income is accrual accounting profit. Cash flow from operations is the operating section of the cash-flow statement. “Free cash flow” is non-GAAP and must be defined; this article uses CFO minus capital expenditures as a simple convention, while valuation work may require FCFF or FCFE. Neither FCF nor CFO equals “what arrived in the bank” or what owners can safely withdraw. Capital-expenditure disclosures also rarely separate maintenance and growth spending precisely. See CFA Institute's free-cash-flow methodology.
Free Cash Flow vs Net Income: Understanding the Key Differences
Net income is the accounting profit a company reports on its income statement; free cash flow is the actual cash the business generated after paying for operations and capital investments. The two can diverge widely: a…
8 min read
Practice investing with Finelo
Build practical investing skills with guided lessons, simulator practice, and structured challenges.
Want to learn more?
Build practical investing skills with guided lessons, simulator practice, and structured challenges.
Explore FineloExplore Finelo's 28-day challenges
Turn learning into a daily habit with guided challenge paths.
Net income is the accounting profit a company reports on its income statement; free cash flow is the actual cash the business generated after paying for operations and capital investments. The two can diverge widely: a firm can report strong profits while burning cash, or modest profits while gushing it. This page is for investors weighing free cash flow vs net income and deciding which number to trust for valuation, dividend safety, and quality checks. Work through the definitions and differences below, then practice statement analysis with guided lessons in the Finelo app.
Free cash flow and net income defined
What is net income?
Net income - the "bottom line" - is revenue minus every expense the accounting rules recognize: cost of goods, operating costs, depreciation, interest, and taxes. It is computed on the accrual basis, meaning revenue counts when earned and expenses when incurred, regardless of when cash actually moves. Earnings per share, the number headlines quote, is net income divided by shares outstanding.
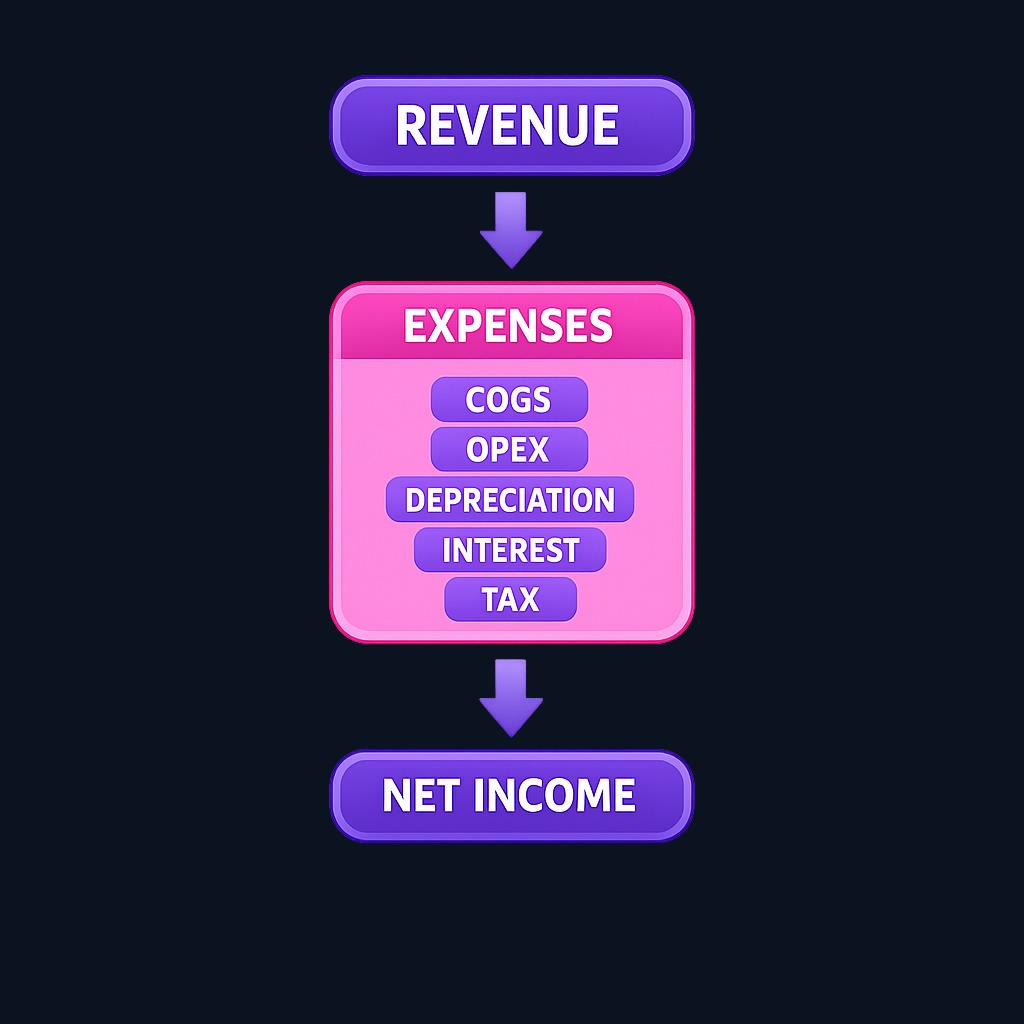
Accrual accounting exists for a good reason: it matches effort to result. A machine bought this year but used for ten years is expensed gradually as depreciation, which paints a fairer picture of yearly performance than one giant cash hit.
What is free cash flow?
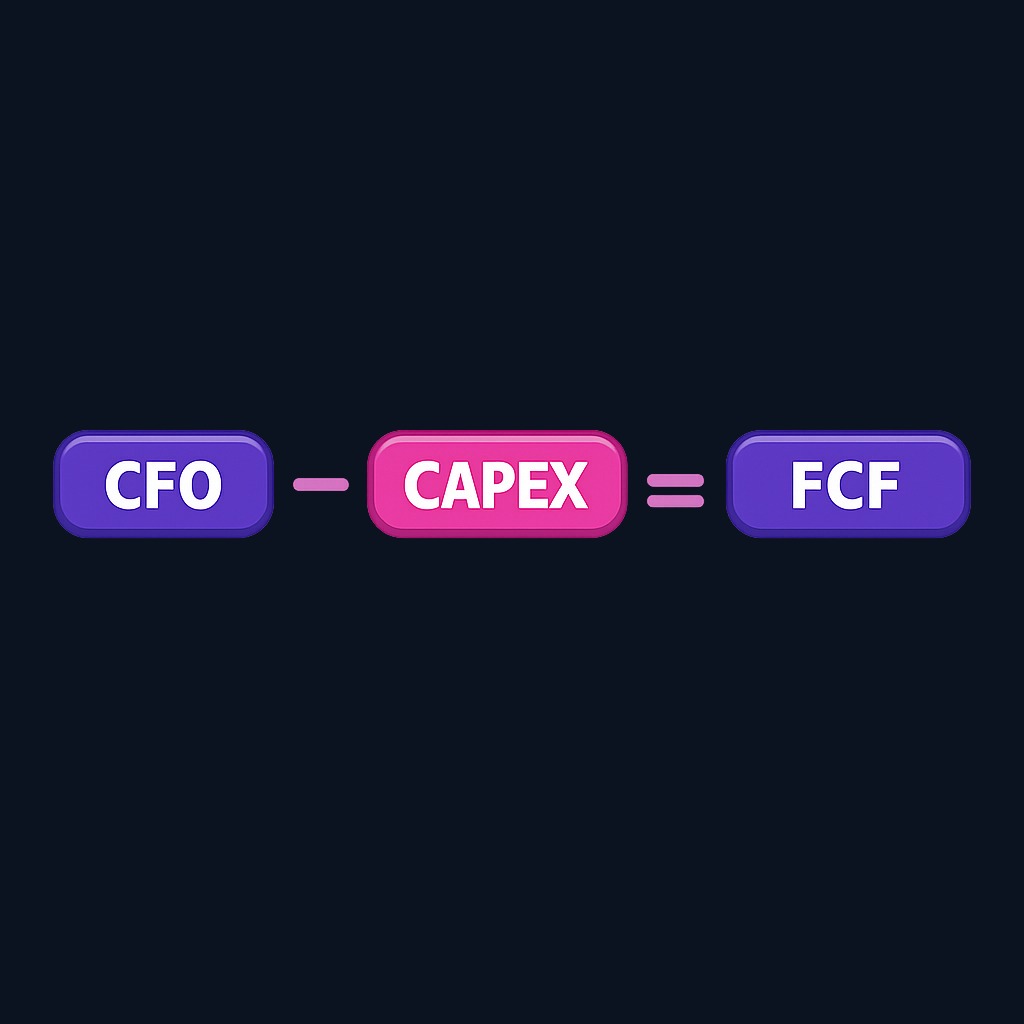
Free cash flow (FCF) starts from a different question: how much cash did the business actually produce that owners could take out without harming operations? The standard shortcut:
Free cash flow = Cash flow from operations − Capital expenditures
Both inputs sit on the cash flow statement, which any US public company files with its reports - accessible for free through the SEC's EDGAR database. Operating cash flow captures real collections and payments; subtracting capital expenditures accounts for the reinvestment needed to maintain and grow the asset base.
Key differences between free cash flow and net income
| Dimension | Net income | Free cash flow |
|---|---|---|
| Basis | Accrual accounting | Actual cash movement |
| Includes non-cash items | Yes - depreciation, stock compensation, write-downs | No - they never touch cash |
| Capital spending | Spread over years as depreciation | Deducted in full when spent |
| Working capital swings | Largely invisible | Fully reflected |
| Vulnerability to estimates | Higher - reserves, recognition timing, assumptions | Lower - cash is hard to fake |
The philosophical difference drives everything: net income measures economic performance as accounting standards define it, while free cash flow measures liquidity generation as the bank account experiences it. Depreciation illustrates the split perfectly. It reduces net income every year without moving a dollar, while the original purchase hit free cash flow entirely in the year of payment.
Working capital is the other big wedge. When customers pay slowly, receivables grow: revenue and profit look fine while cash lags. When inventory piles up, cash is spent long before any sale registers. Free cash flow feels these strains immediately; net income does not.

When to use each metric
Reach for net income when comparing profitability across companies on a standardized basis, tracking margin trends, computing ratios the market quotes daily (P/E, EPS growth), or evaluating businesses with smooth, predictable working capital.
Reach for free cash flow when valuing a business on discounted cash flows, judging whether dividends and buybacks are actually affordable, assessing debt-service capacity, or stress-testing the quality of reported earnings.
Use both together when something looks too good. The most informative single check in fundamental analysis is the ratio of free cash flow to net income over several years. Persistently strong profits with weak cash conversion is the classic signature of aggressive accounting, ballooning receivables, or capex the income statement is quietly understating.

What the gap between them reveals
A few recurring patterns show how the two numbers tell different stories. Fast-growing subscription businesses often show weak net income - heavy upfront spending on growth - while collecting subscriptions in advance produces solid operating cash. The income statement says "unprofitable"; the cash statement says "self-funding."
The reverse pattern is more dangerous. A manufacturer reporting steady profits while receivables and inventory swell year after year is booking earnings it has not collected. If customers ultimately do not pay, yesterday's profits become tomorrow's write-downs. Cash flow flagged the problem quarters earlier.
Capital intensity creates a third pattern. Businesses that must constantly replace expensive equipment can show respectable net income while free cash flow stays thin, because depreciation understates the true ongoing cost of staying competitive. Long-term owners of such businesses live on what the cash statement says, not the income statement.

Common misconceptions
Three myths worth retiring. "Positive net income means the company is fine" - profitable companies fail from cash shortages. "Free cash flow is always the truer number" - a single year's FCF can be distorted by lumpy capex or one-off working-capital swings, so multi-year averages matter. "Negative FCF is always bad" - a company investing heavily at high returns can run negative free cash flow productively for years, provided the funding holds and the returns are real.
Practice investing with Finelo
Build practical investing skills with guided lessons, simulator practice, and structured challenges.
What to know before deciding
Neither metric wins in isolation, and both can be managed in the short run. Net income carries estimate risk - reserves, recognition timing, and impairment judgments all involve discretion. Free cash flow carries timing noise - postponing supplier payments or deferring capex flatters it temporarily at the expense of the future. Definitions of FCF also vary: some analysts subtract only maintenance capex, others deduct acquisitions or stock-based compensation adjustments. Whatever definition you use, apply it consistently across time and across companies, and read the full cash flow statement rather than a single derived number.
Decision framework: reading the two together
- Pull five years of net income and free cash flow from the filings.
- Compute the conversion ratio (FCF ÷ net income) each year and note the trend.
- Investigate persistent gaps in the working-capital and capex lines of the cash flow statement.
- Match the metric to the question: valuation and payout safety lean on FCF; comparability and margin analysis lean on net income.
- Treat divergence as a research prompt, not a verdict - the explanation may be benign growth mechanics or a genuine red flag, and the footnotes usually settle it.
FAQ
Can a company have positive net income and negative free cash flow?
Yes, and it is common. Heavy capital spending, growing receivables, or inventory buildup consume cash that accrual profit does not reflect. The combination deserves scrutiny when it persists for years.
Is free cash flow better than net income for valuation?
Most intrinsic-valuation methods, such as discounted cash flow analysis, are built on free cash flow because owners can only ever receive cash. Net income still matters for standardized comparisons and market multiples.
Why is depreciation in net income but not free cash flow?
Depreciation allocates an old cash payment across the years the asset serves. Net income deducts that allocation annually; free cash flow instead recognized the entire outflow when the equipment was purchased.
What is a good free cash flow to net income ratio?
Mature businesses converting most of their profit to cash - ratios near or above 1.0 over multi-year stretches - signal high earnings quality. Persistent ratios far below that level warrant a closer read of receivables, inventory, and capex.
Conclusion and next steps
Net income tells you what the accountants concluded; free cash flow tells you what the bank account received. Each answers questions the other cannot, and the relationship between them - tracked over several years - is one of the sharpest quality signals available to ordinary investors. Make the conversion check a standard step in every company review, and let sustained divergence send you into the footnotes. To turn that routine into a durable skill, practice full statement walk-throughs in Finelo's interactive lessons.
InvestingFundamental AnalysisFinancial StatementsBeginner
Practice investing with Finelo
Build practical investing skills with guided lessons, simulator practice, and structured challenges.
About the author
Finelo Team
The Finelo Team creates practical investing and trading education designed to help beginners learn faster with structured challenges, simulator practice, and bite-sized lessons.
Keep reading — Related articles

Investing
Tax-gain harvesting vs. tax-loss harvesting
Compare realizing investment gains with realizing losses, including holding periods, wash sales, offsets, and portfolio tradeoffs.
Finelo Team

Investing
Stable value fund vs. money market fund
Compare investment structure, contract protections, transfer restrictions, net yields, and access inside a retirement account.
Finelo Team

Investing
Single-life vs. joint-life annuity
Compare income for one lifetime with continued payments to a survivor, using equal premiums and matching guarantee terms.
Finelo Team


