This guide assumes the reader already knows gross margin = (revenue − cost of goods sold) ÷ revenue. Its distinct purpose is to explain why the percentage changed. A gross-margin bridge separates price, product or customer mix, input cost, freight, labor, inventory accounting, foreign exchange, and acquisition effects instead of treating one headline percentage as a verdict.
Gross Margin Bridge: Separating Price, Mix, Volume, and Cost Effects

This guide assumes the reader already knows gross margin = (revenue − cost of goods sold) ÷ revenue. Its distinct purpose is to explain why the percentage changed. A gross-margin bridge separates price, product or…
8 min read
Practice investing with Finelo
Build practical investing skills with guided lessons, simulator practice, and structured challenges.
Want to learn more?
Build practical investing skills with guided lessons, simulator practice, and structured challenges.
Explore FineloExplore Finelo's 28-day challenges
Turn learning into a daily habit with guided challenge paths.
How to build a gross-margin bridge
- Start with the prior-period gross profit at the prior margin.
- Apply volume at prior-period unit economics; volume can change gross profit dollars without changing margin.
- Isolate price and discounting while holding mix constant.
- Measure mix by product, geography, channel, or customer cohort.
- Reconcile unit input costs, freight, labor, scrap, and supplier rebates.
- Separate accounting and scope changes such as LIFO/FIFO effects, inventory write-downs, acquisitions, divestitures, and FX translation.
- Tie the bridge back to reported revenue, COGS, and gross profit.
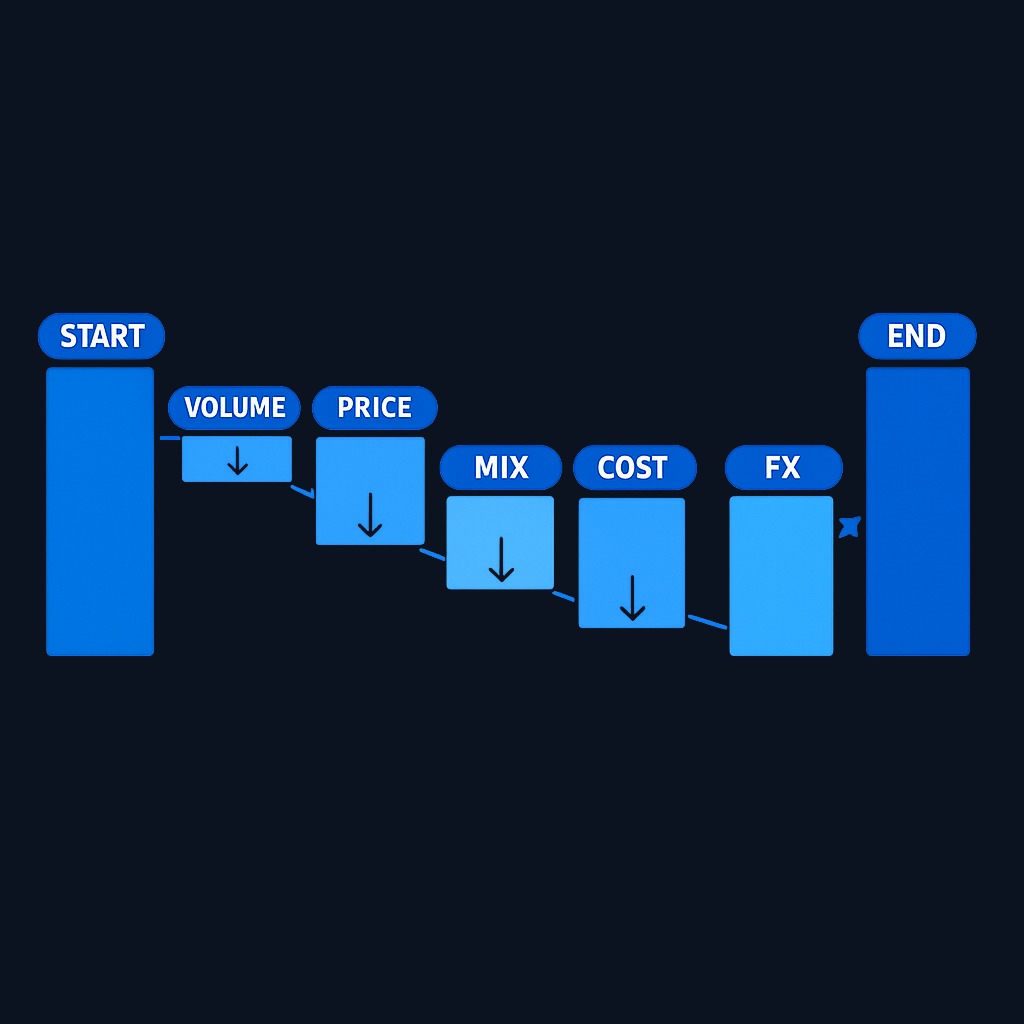
A rising margin caused by price realization can be durable or can invite competition; a rise caused by temporarily favorable mix may reverse. A decline caused by a planned product launch has a different meaning from a decline caused by discounting or obsolete inventory. Use management's bridge only after checking whether the components reconcile and whether definitions stayed constant.
Gross profit margin is (revenue − cost of goods sold) ÷ revenue. The calculation is simple; the purpose of this article is to build a price/mix/volume/cost bridge, reconcile it to the statements, and avoid unsupported sector benchmarks.
What gross profit margin measures
Gross margin isolates the economics of the product itself. It answers one question: after paying for the materials, labor, and other costs directly tied to each sale, what share of the revenue survives? Everything else, rent, marketing, executive salaries, interest, taxes, comes later in the income statement. That isolation is what makes the ratio powerful. A weak gross margin means the core product economics are strained, and no amount of overhead discipline further down the statement can fully repair that. A strong gross margin means the business earns real room on every sale and gets to decide how to spend it.
How to calculate gross profit margin
Gross profit margin = (Revenue − COGS) ÷ Revenue × 100
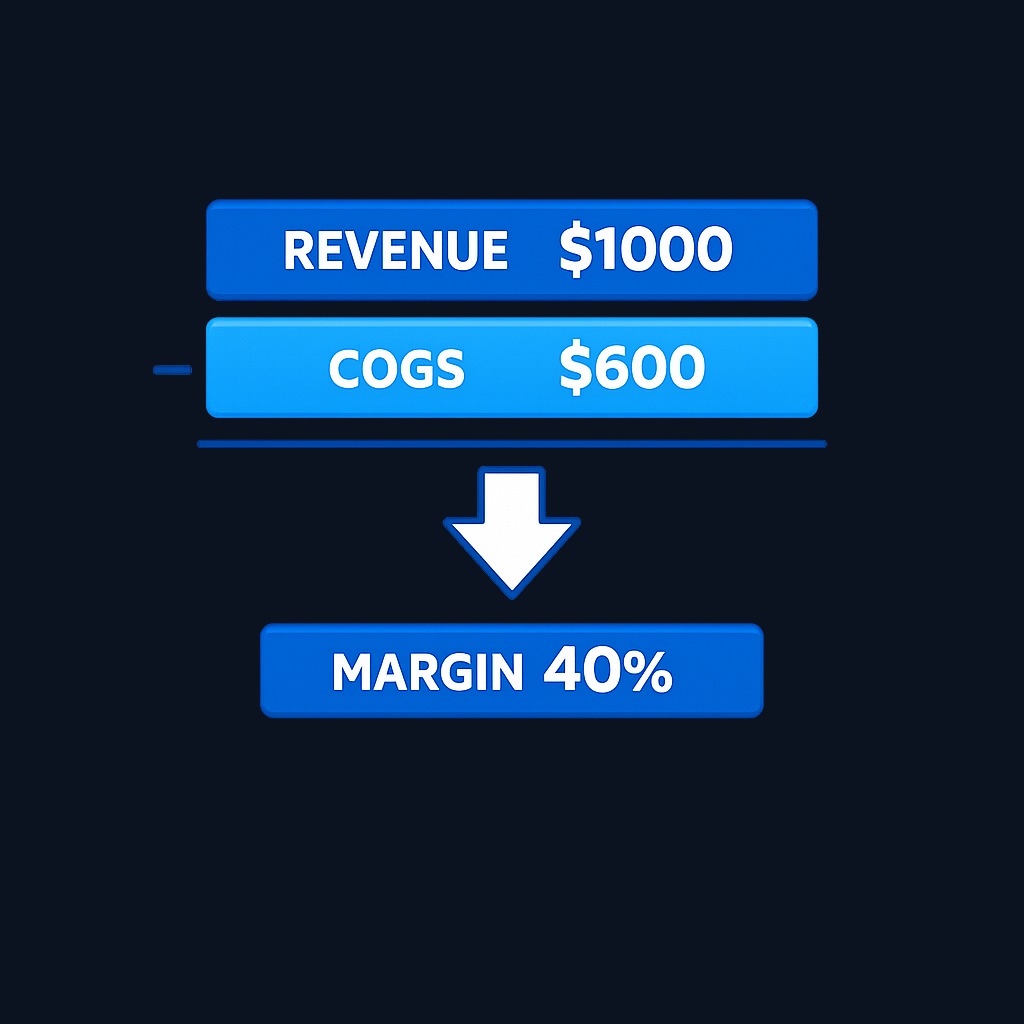
Cost of goods sold (COGS) includes the costs that scale directly with production: raw materials, direct labor, factory overhead, freight-in, and for retailers the wholesale cost of inventory sold. It excludes selling, general, and administrative expenses. Both inputs sit at the top of the income statement, and for any US-listed company you can pull the filings free from the SEC's EDGAR database. One warning: companies differ in what they classify into COGS, especially around depreciation and delivery costs, so check the footnotes before comparing two firms decimal-for-decimal.
Why gross margin matters
Three reasons the ratio earns its place at the top of most analyses:
- It reveals pricing power. A company that sustains a high gross margin is charging meaningfully more than its direct costs, which usually signals a differentiated product or brand customers accept.
- It funds everything else. Marketing, research, and expansion are all paid out of gross profit. Thin margins leave nothing to invest.
- It scales the business model. Software and services often carry high gross margins because each extra unit costs little to deliver; heavy manufacturing carries lower margins because every unit consumes materials. The margin tells you which game a company is playing.
Gross margin vs operating and net margin
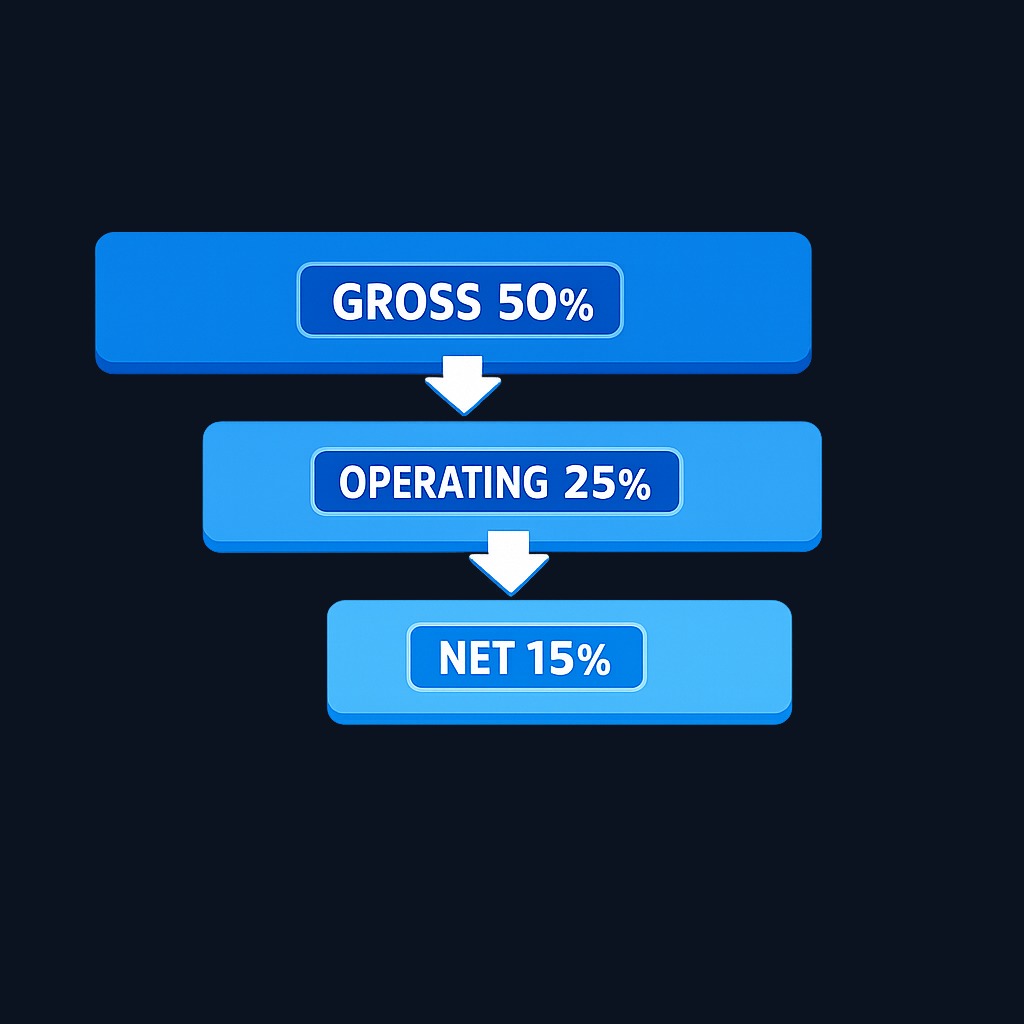
| Margin | What is subtracted | Question it answers |
|---|---|---|
| Gross profit margin | Direct production costs only | Is the product itself profitable? |
| Operating margin | Direct costs + overhead | Is the whole operation profitable? |
| Net profit margin | Everything, incl. interest and tax | What finally remains for owners? |
Reading the three as a waterfall locates problems fast. Strong gross margin but weak operating margin points to bloated overhead. Similar gross and net margins suggest a lean, lightly taxed, low-debt operation.
Peer comparison without generic industry benchmarks
Gross margins vary with product mix, accounting classification, channel, geography, and business model. Do not apply an unsourced sector range or assume a five- or ten-point gap proves competitive advantage. Recalculate a named peer set from like periods, inspect COGS policies, and use the bridge to explain the gap.
Practice investing with Finelo
Build practical investing skills with guided lessons, simulator practice, and structured challenges.
Worked example: two products, one decision
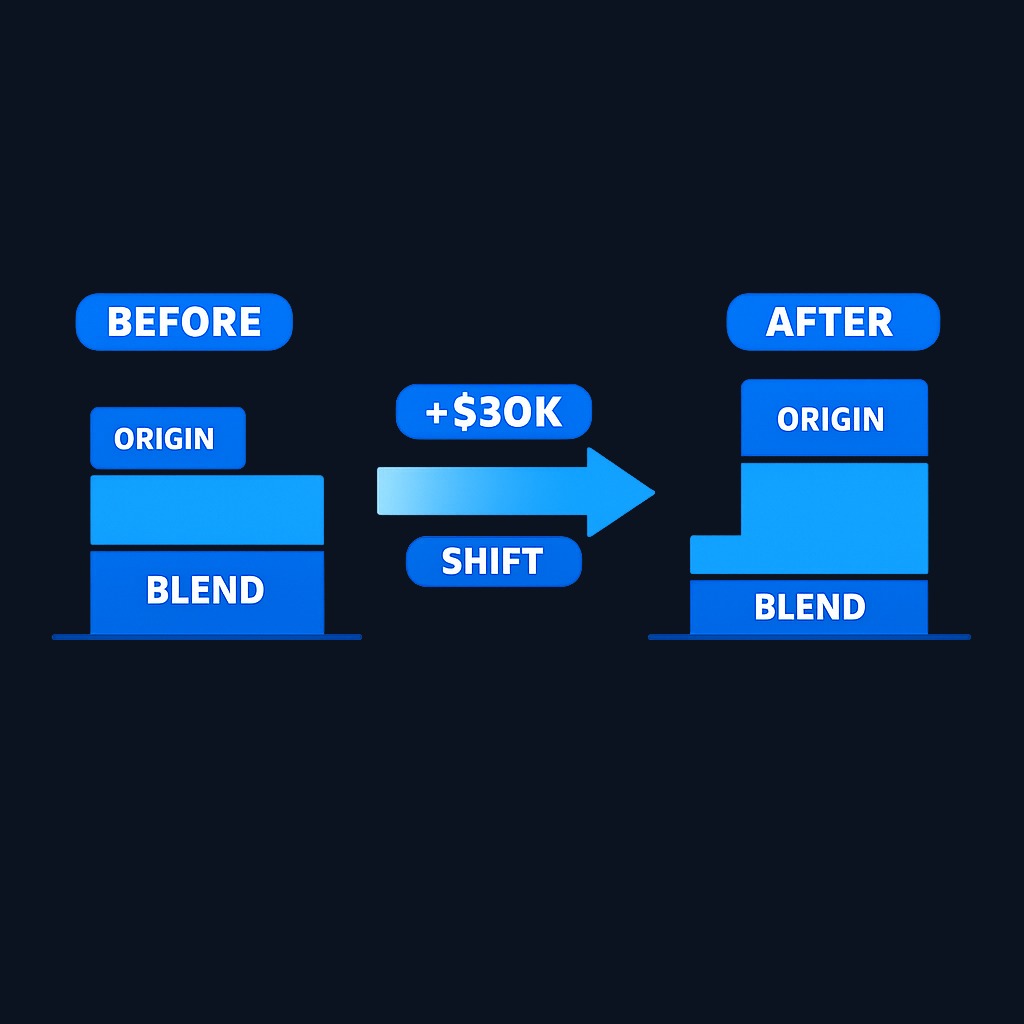
Meridian Roasters sells two coffee lines. The house blend sells for $14 a bag with $9.10 of direct cost per bag. The single-origin line sells for $22 with $11 of direct cost.
- House blend gross margin: (14 − 9.10) ÷ 14 = 35%
- Single-origin gross margin: (22 − 11) ÷ 22 = 50%
Last quarter the company sold 30,000 house bags and 8,000 single-origin bags: gross profit of $147,000 from the blend and $88,000 from single-origin. The blended company-wide margin is (147,000 + 88,000) ÷ (420,000 + 176,000) ≈ 39.4%. Now the mix insight: shifting just 5,000 buyers from blend to single-origin would lift total gross profit by about $30,500 with no new customers at all. That is why analysts obsess over product mix, and why a rising gross margin often signals a mix shift rather than a price increase.
Strategies to improve gross profit margin
Companies work both levers. On price: targeted increases where demand tolerates them, better product mix, bundling, and premium tiers. On cost: renegotiating supplier terms, buying in volume, reducing waste and rework, automating direct labor, and redesigning products to use cheaper inputs without hurting quality. Sustainable improvements usually come from mix and pricing power; margin gains that come purely from squeezing suppliers or cutting corners on quality tend to reverse.
What to know before deciding
Gross margin is powerful but easy to misread. Keep these cautions in mind.
COGS definitions differ
Two competitors can classify the same delivery or depreciation cost differently, shifting several points of margin with zero economic difference. Compare methodology before comparing numbers.
Margin is not markup
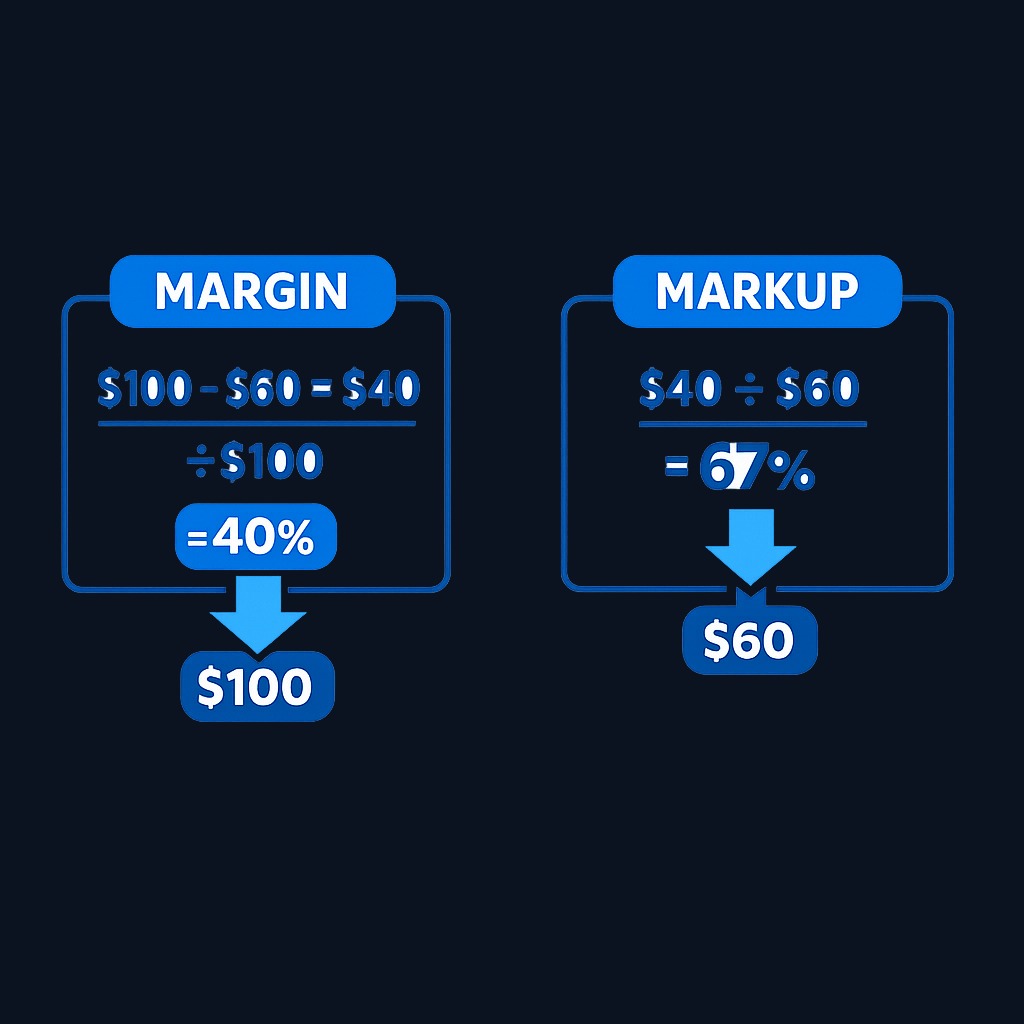
Margin divides profit by revenue; markup divides it by cost. A product bought for $60 and sold for $100 has a 40% margin but a 66.7% markup. Mixing the two is one of the most common errors in pricing and in beginner analysis.
High margin does not equal high profit
A 90% margin on tiny revenue can produce less gross profit than a 25% margin on huge volume. Always pair the percentage with absolute dollars, and check the trend across several periods rather than a single quarter, since input-cost spikes and seasonal mix can distort any one reading.
Decision framework: using gross margin in analysis
- Pull 3-5 years of gross margins for the company and 2-3 direct competitors from their filings.
- Judge level against peers only. A 30% margin is a red flag in software and a triumph in grocery.
- Explain every big move. Price increases, input costs, and product mix each leave different fingerprints in the filings' management discussion.
- Follow the waterfall down. Pair gross margin with operating and net margin to see whether product-level strength survives overhead and financing.
- Weight durability over level. A stable 45% beats a volatile 55% for most long-term theses.
This routine pairs naturally with broader habits like fundamental analysis and portfolio-level diversification, which keep any single ratio from carrying your whole decision.
FAQ
What is a good gross profit margin?
There is no universal good margin. Benchmark a consistently calculated figure against direct competitors and the company's own history, then explain price, mix, unit-cost, FX, and accounting effects.
What is included in cost of goods sold?
Costs that scale directly with production or sales: raw materials, direct labor, manufacturing overhead, freight-in, and purchased inventory for resellers. Overhead such as rent, marketing, and administrative salaries is excluded and appears further down the income statement.
How is gross profit margin different from net profit margin?
Gross margin subtracts only direct production costs, showing product-level efficiency. Net margin subtracts every expense including overhead, interest, and taxes, showing the final bottom line. A company can post a strong gross margin and still lose money overall.
Can gross profit margin be too high?
A very high margin can invite competition or signal underpricing risk in reverse: rivals may undercut, or customers may defect if value feels thin. It can also reflect underinvestment in quality. Durability of the margin matters more than its peak level.
Conclusion and next steps
Gross profit margin measures the raw economics of what a company sells: the share of each revenue dollar left after direct costs. Calculate it, benchmark it against true peers, explain its moves, and follow it down the income-statement waterfall to operating and net margin. Do that across a few filings and you will read profitability faster than most beginners ever learn to. Put the skill into practice now: pick two competitors, pull their latest annual filings, and run the two-product mix math from the example above on their segment data.
InvestingFundamental AnalysisFinancial StatementsBeginner
Practice investing with Finelo
Build practical investing skills with guided lessons, simulator practice, and structured challenges.
About the author
Finelo Team
The Finelo Team creates practical investing and trading education designed to help beginners learn faster with structured challenges, simulator practice, and bite-sized lessons.
Keep reading — Related articles

Investing
Tax-gain harvesting vs. tax-loss harvesting
Compare realizing investment gains with realizing losses, including holding periods, wash sales, offsets, and portfolio tradeoffs.
Finelo Team

Investing
Stable value fund vs. money market fund
Compare investment structure, contract protections, transfer restrictions, net yields, and access inside a retirement account.
Finelo Team

Investing
Single-life vs. joint-life annuity
Compare income for one lifetime with continued payments to a survivor, using equal premiums and matching guarantee terms.
Finelo Team


