Gross margin shows the share of revenue left after the direct costs of producing what a company sells. Net margin shows what remains after every expense: operating costs, interest, and taxes. Comparing gross margin vs net margin tells you whether a company's profitability problems live in production, in overhead, or in financing.
Gross Margin vs Net Margin: Understanding the Key Differences
Gross margin shows the share of revenue left after the direct costs of producing what a company sells. Net margin shows what remains after every expense: operating costs, interest, and taxes. Comparing gross margin vs…
5 min read
Practice investing with Finelo
Build practical investing skills with guided lessons, simulator practice, and structured challenges.
Want to learn more?
Build practical investing skills with guided lessons, simulator practice, and structured challenges.
Explore FineloExplore Finelo's 28-day challenges
Turn learning into a daily habit with guided challenge paths.
This page is for investors and business-curious readers learning to read an income statement. You will get both formulas, a worked example, a comparison table, industry benchmarks, and a framework for when each metric matters most. Everything here is educational, not financial advice.
What is gross margin?
Gross margin measures production-level profitability. The formula:
Gross margin = (revenue - cost of goods sold) ÷ revenue × 100
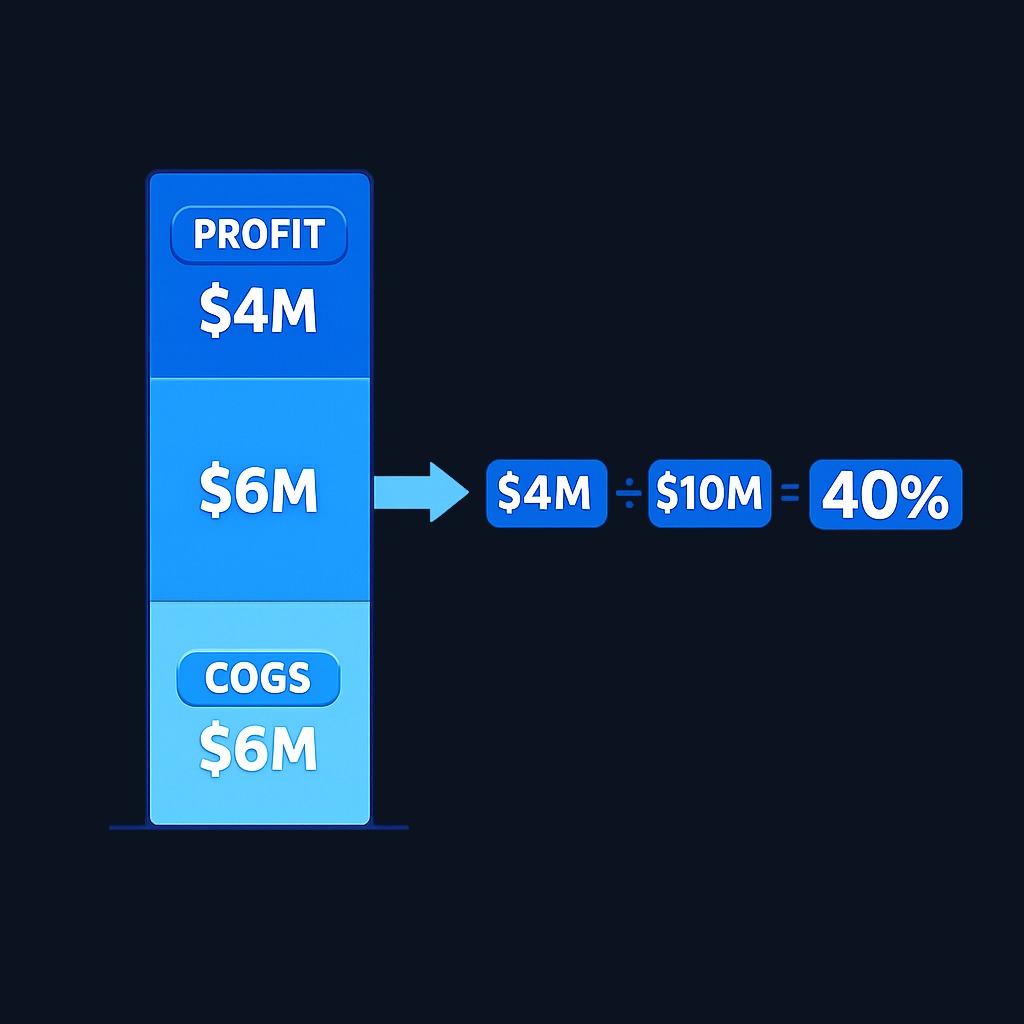
Cost of goods sold, or COGS, covers the direct costs of making a product or delivering a service: materials, factory labor, manufacturing overhead, or hosting costs for a software product. If a company sells $10 million of goods and COGS is $6 million, gross profit is $4 million and gross margin is 40%.
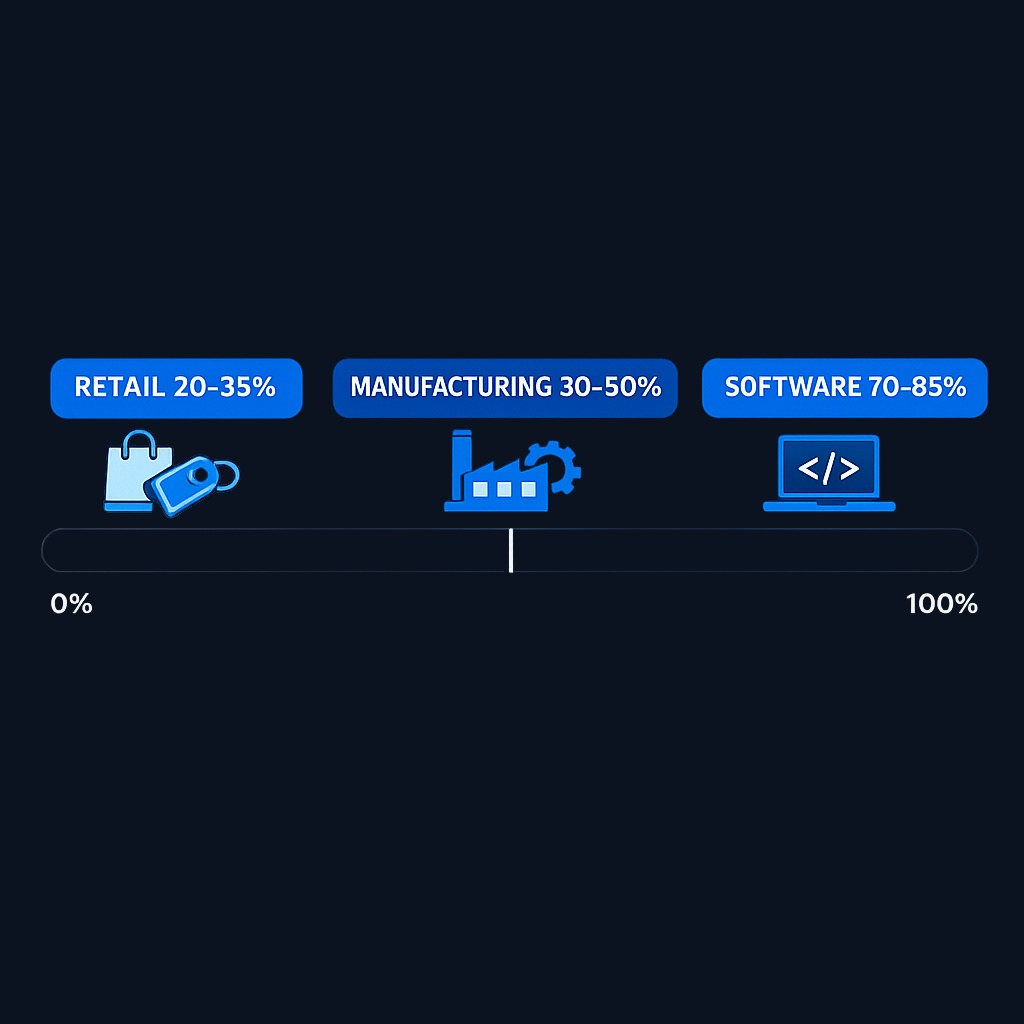
A strong gross margin signals pricing power and production efficiency. It answers the question: does the core product make money before the rest of the business takes its share? Software firms often post gross margins above 70% because each extra sale costs little to deliver, while grocery retailers operate near 20-30% because the product itself is most of the cost.
What is net margin?
Net margin measures bottom-line profitability. The formula:
Net margin = net income ÷ revenue × 100
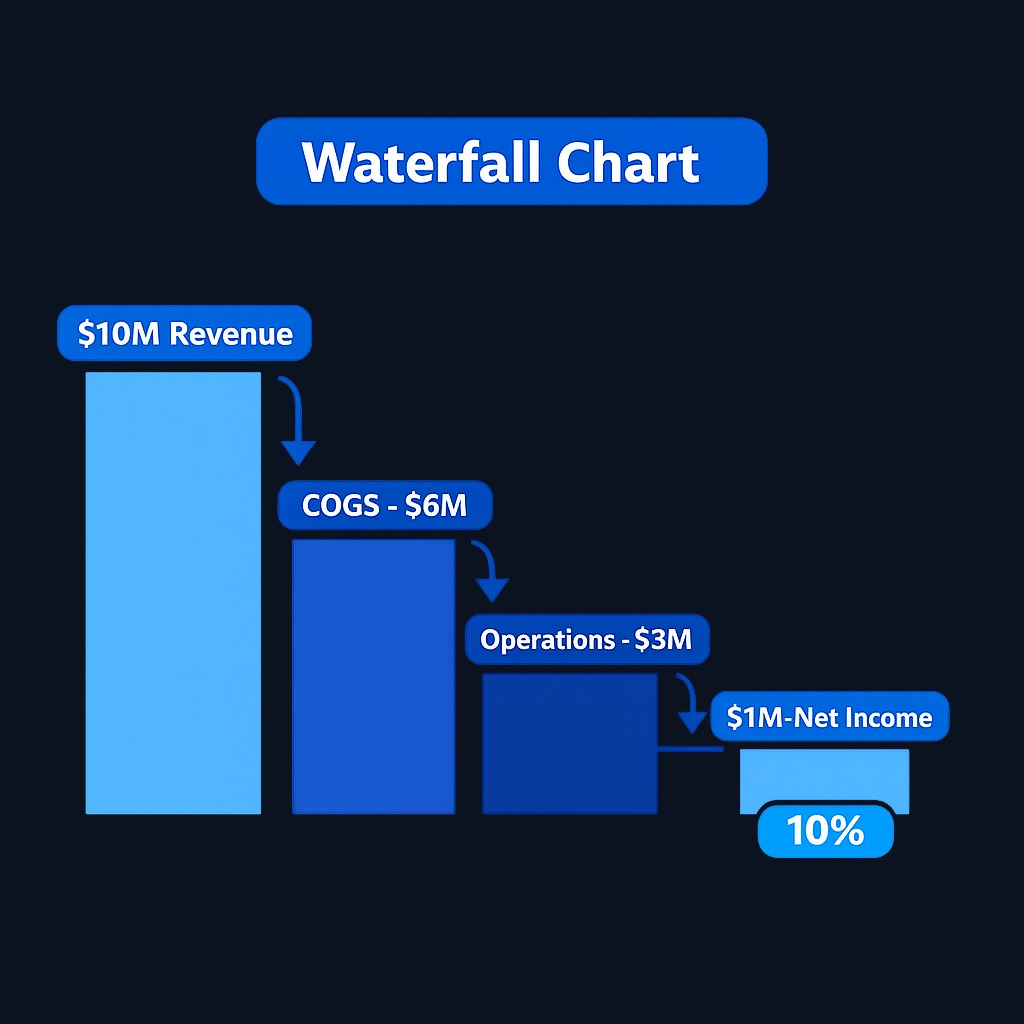
Net income starts from gross profit and subtracts everything else: selling and marketing, research, administrative salaries, rent, depreciation, interest on debt, and taxes. If that same $10 million company spends $3 million on all other costs and taxes, net income is $1 million and net margin is 10%.
Net margin answers the shareholder's question: how many cents of each revenue dollar does the company actually keep? It is the most complete profitability measure, and also the noisiest, because one-time charges, interest costs, and tax quirks all land here.
Key differences between gross margin and net margin
| Feature | Gross margin | Net margin |
|---|---|---|
| What it measures | Production efficiency | Total profitability |
| Costs deducted | COGS only | All expenses, interest, taxes |
| Typical size | Larger | Smaller |
| Best for spotting | Pricing power, unit economics | Overall discipline, bottom line |
| Distorted by | Inventory accounting choices | One-time items, tax effects |
A worked example
Two companies each report $100 million in revenue. Alpha has a 60% gross margin but heavy marketing and admin spending, leaving a 5% net margin. Beta has a 35% gross margin but lean operations, ending at a 12% net margin. Alpha's product is more profitable per unit; Beta runs the tighter overall ship. Read together, the margins show where each business wins and leaks money, which neither number reveals alone.
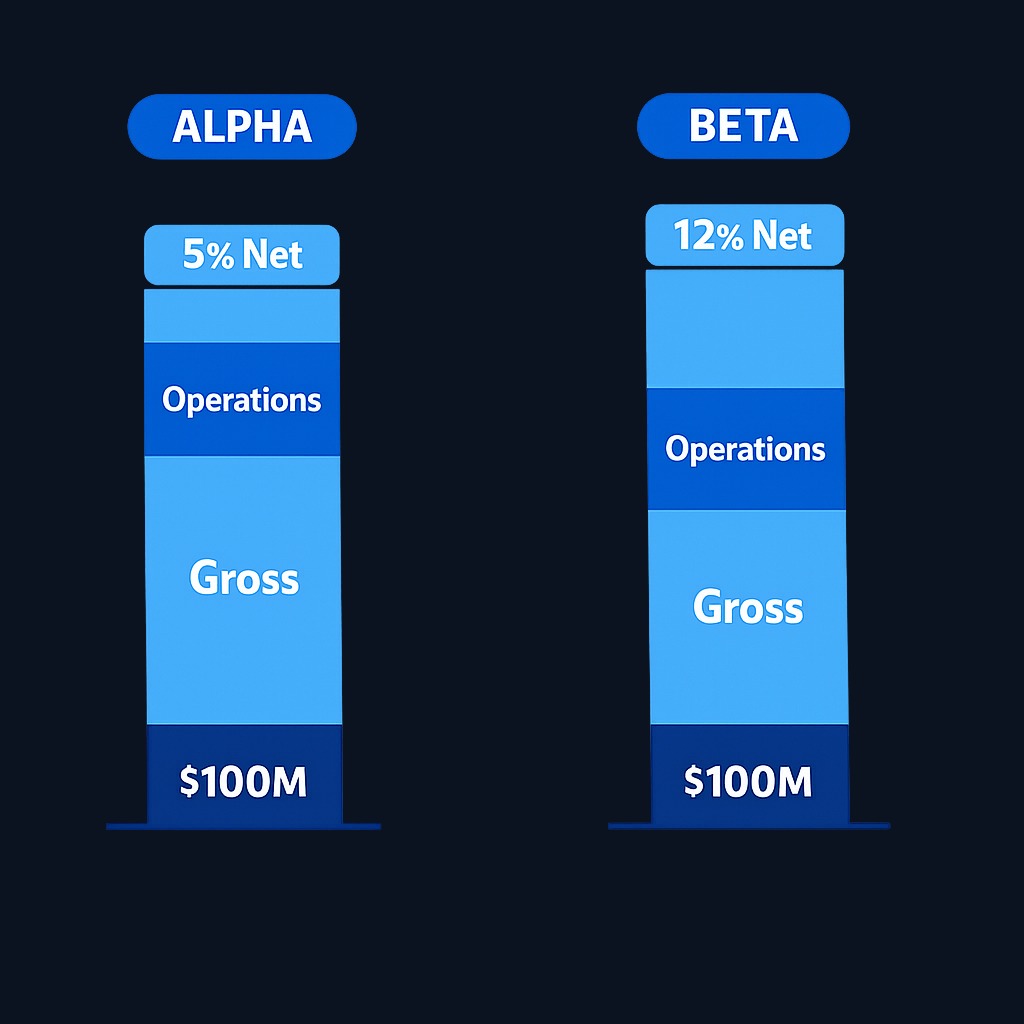
The gap between the two margins is itself informative. A wide gap means large operating, interest, or tax costs sit between the product and the bottom line, and shrinking that gap is often where profit growth comes from.
Practice investing with Finelo
Build practical investing skills with guided lessons, simulator practice, and structured challenges.
Decision framework: when to use gross margin vs net margin
- Judging a product or pricing decision? Use gross margin. It isolates unit economics before overhead muddies the picture.
- Comparing operational efficiency across peers? Start with gross margin to compare production costs, then check operating and net margins to see who controls overhead best.
- Valuing the whole company as a shareholder? Net margin matters most; it feeds earnings, EPS, and most valuation multiples.
- Tracking a turnaround? Watch both. Improving gross margin shows product-level fixes; improving net margin confirms the savings reach the bottom line.
- Screening young growth companies? Lean on gross margin. Many reinvest so aggressively that net margin is negative by choice, and gross margin reveals whether the model can eventually profit.
A useful habit is reading the full margin ladder, gross, then operating, then net, so you can locate exactly which layer of costs changes the story.
Industry-specific benchmarks
Margins only mean something against the right peer group:
| Industry | Typical gross margin | Typical net margin |
|---|---|---|
| Software / SaaS | High (often 70%+) | Varies widely with growth spending |
| Retail and grocery | Low to moderate | Thin, low single digits |
| Restaurants | Moderate | Thin |
| Pharmaceuticals | High | Moderate to high |
| Airlines and heavy industry | Low to moderate | Thin and cyclical |
Treat these as directional patterns rather than fixed targets, since definitions and cost structures vary by company and over time. The comparison that matters is a company against its direct competitors and its own history. A 25% gross margin is alarming for software and excellent for a grocer.
What to know before deciding
Margin analysis has classic traps. Companies classify costs differently, so one firm's COGS is another's operating expense, which distorts gross margin comparisons. One-time items, asset sales, write-offs, or unusual tax benefits, can inflate or crush net margin in a single year, so look at multi-year trends. Interest costs make leveraged companies look worse on net margin even when operations match a debt-free peer. And taxes are a real, recurring wedge between gross and net: business tax obligations vary by structure and jurisdiction, as the IRS outlines in its business taxes overview, so after-tax comparisons across countries or entity types need care. When in doubt, read the income statement itself rather than a single summary ratio.
Conclusion and next steps
Gross margin isolates what production costs leave behind; net margin shows what every cost leaves behind. The first reveals unit economics, the second reveals the whole machine, and the gap between them shows where money leaks. Read them together, against industry peers and multi-year trends, and the income statement starts telling you a story instead of a number.
Next steps: pull the income statement of a company you follow, compute both margins for the last three years, and note which direction each is moving and why.
Frequently asked questions
Why is gross margin always higher than net margin?
Because net margin subtracts every cost gross margin ignores: overhead, marketing, research, interest, and taxes. Net income is what survives all deductions, so it is necessarily the smaller percentage of revenue.
What is a good gross margin or net margin?
It depends on the industry. Software businesses commonly run gross margins above 70%, while grocers live near 20-30%. Compare a company to direct peers and its own past rather than a universal benchmark.
Can a company have a high gross margin and negative net margin?
Yes, and it is common in young growth companies. The product earns well per unit, but heavy spending on marketing, research, or expansion pushes the bottom line below zero, sometimes deliberately.
Which margin matters more for stock investors?
Net margin connects directly to earnings and valuation, so it usually matters more for shareholders. Gross margin matters as the leading indicator: it shows whether the core business can support future profits once spending normalizes.
grossmarginnet
Practice investing with Finelo
Build practical investing skills with guided lessons, simulator practice, and structured challenges.
About the author
Finelo Team
The Finelo Team creates practical investing and trading education designed to help beginners learn faster with structured challenges, simulator practice, and bite-sized lessons.
Keep reading — Related articles

Investing
Tax-gain harvesting vs. tax-loss harvesting
Compare realizing investment gains with realizing losses, including holding periods, wash sales, offsets, and portfolio tradeoffs.
Finelo Team

Investing
Stable value fund vs. money market fund
Compare investment structure, contract protections, transfer restrictions, net yields, and access inside a retirement account.
Finelo Team

Investing
Single-life vs. joint-life annuity
Compare income for one lifetime with continued payments to a survivor, using equal premiums and matching guarantee terms.
Finelo Team


