Analyzing financial statements means reading a company's core filings together, then testing them with a handful of ratios. Don't judge a company from one number alone. Read the income statement for revenue and net earnings over a period. Read the balance sheet for what the company owns and owes on a single date. Read the cash flow statement to see whether the business generates real cash. Then run four or five ratios covering liquidity, leverage, and profitability. Do this across three-plus years, and you can tell a durable business from one running on hope.
How to Analyze Financial Statements: A Complete Guide
Analyzing financial statements means reading a company's core filings together, then testing them with a handful of ratios. Don't judge a company from one number alone. Read the income statement for revenue and net…
12 min read
Practice investing with Finelo
Build practical investing skills with guided lessons, simulator practice, and structured challenges.
Want to learn more?
Build practical investing skills with guided lessons, simulator practice, and structured challenges.
Explore FineloExplore Finelo's 28-day challenges
Turn learning into a daily habit with guided challenge paths.
This page is for anyone using free, public filings to judge a company before investing, lending to it, or working for it. It's not written for professional analysts building institutional models. Read the statements section first for the vocabulary. Follow the step-by-step section to build your own checklist. Then compare the case studies to see the same ratios produce opposite verdicts on two similar-looking companies.
Understanding the Key Financial Statements
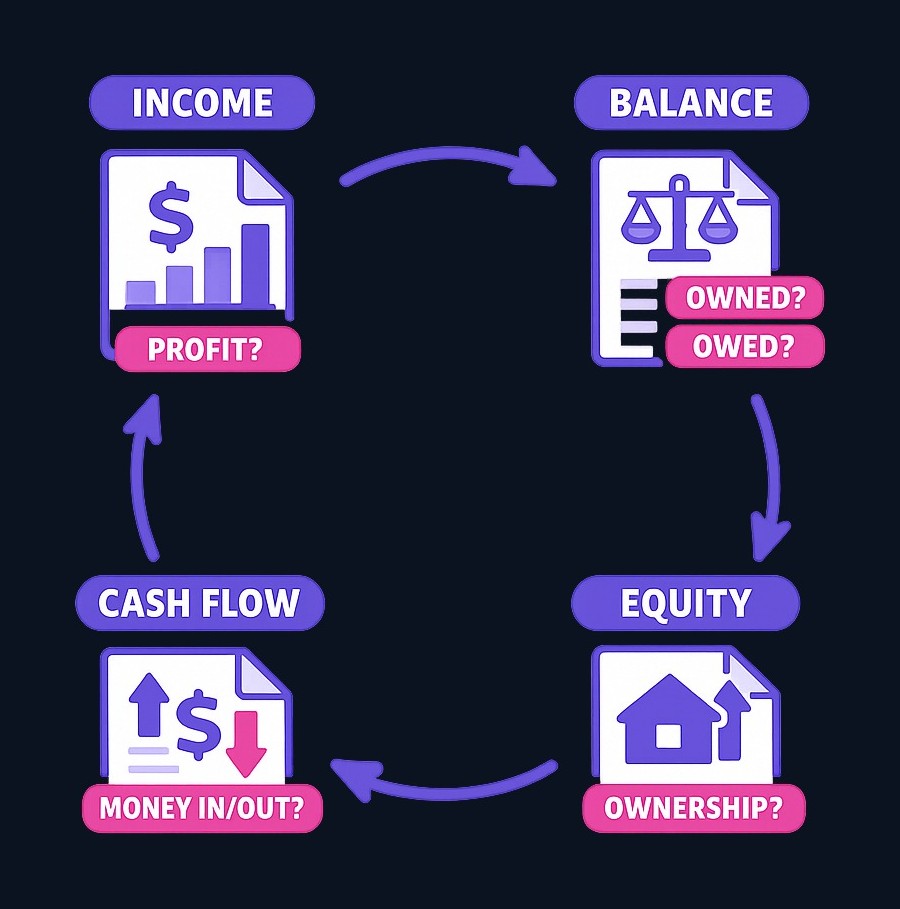
Every publicly traded company files the same four main financial statements: the balance sheet, the income statement, the cash flow statement, and the statement of shareholders' equity. Each one answers a different question.
- The income statement answers "did the business make money?" It shows revenue earned over a specific period, expenses subtracted layer by layer, and the resulting net earnings or losses. Read three-plus years side by side. Revenue and net income should generally move together. If revenue grows while net income shrinks, costs are winning — investigate why.
- The balance sheet answers "what does the company own and owe right now?" It's a snapshot at a single date. It rests on one identity: assets equal liabilities plus shareholders' equity. Assets — cash, inventory, equipment — sit against liabilities like debt and accounts payable. What's left over is equity, the owners' actual stake.
- The cash flow statement answers "where did the actual cash go?" It splits inflows and outflows into operating, investing, and financing activities. It matters because accounting profit and real cash can diverge. A company can report earnings while cash quietly drains from operations.
- The statement of shareholders' equity tracks how equity changed over the period: new stock issued, dividends paid, retained earnings added or subtracted. It's the least-read of the four statements. It's also often the most useful for spotting dilution or aggressive buybacks.
One habit to build early: read the footnotes. The notes disclose accounting policies, tax details, and pension or stock-option obligations. None of that appears in the summary numbers. That's often where the real risk — or the real story — is hiding.
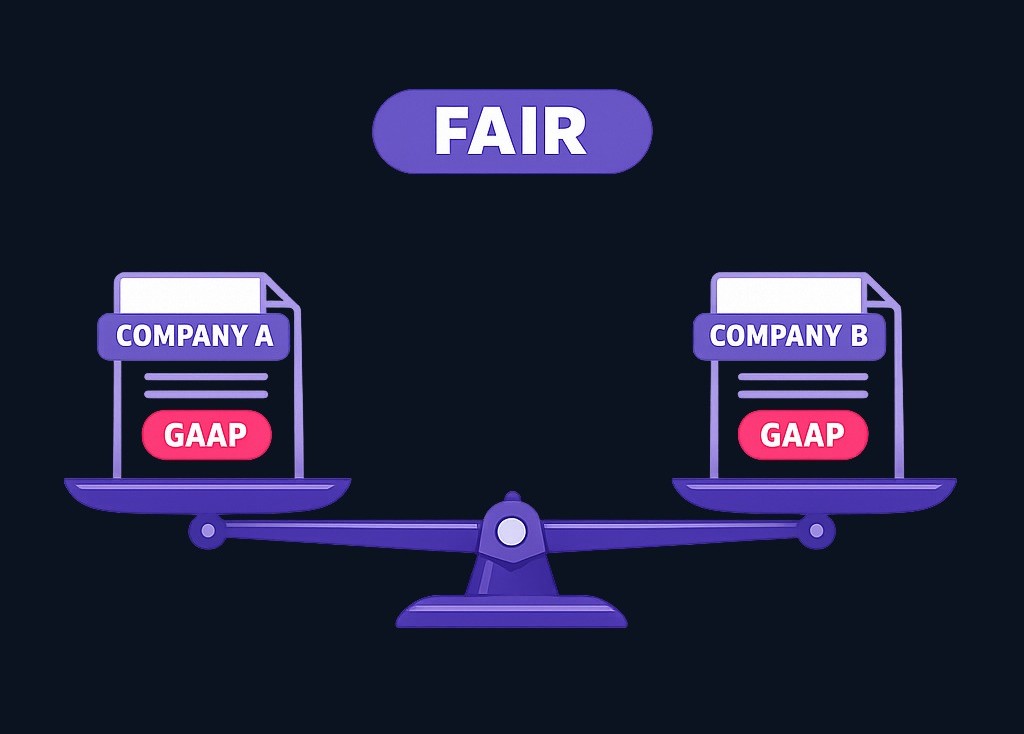
GAAP stands for Generally Accepted Accounting Principles, the framework that establishes financial reporting standards in the United States. It governs how a company records revenue, values assets, and discloses information. The point of GAAP is comparability: GAAP-based reports aim to give investors a level playing field for judging performance across time periods and across companies. Comparing two GAAP filers on the same ratio is fair. Comparing a GAAP filer against a company reporting under different standards usually isn't.
Step-by-Step Guide to Analyzing Financial Statements
Run the same five-step routine on any company, in this order.
- Read the income statement trend first. Pull three to five years of revenue and net income. Confirm both are growing. If one isn't, find out why before moving on.
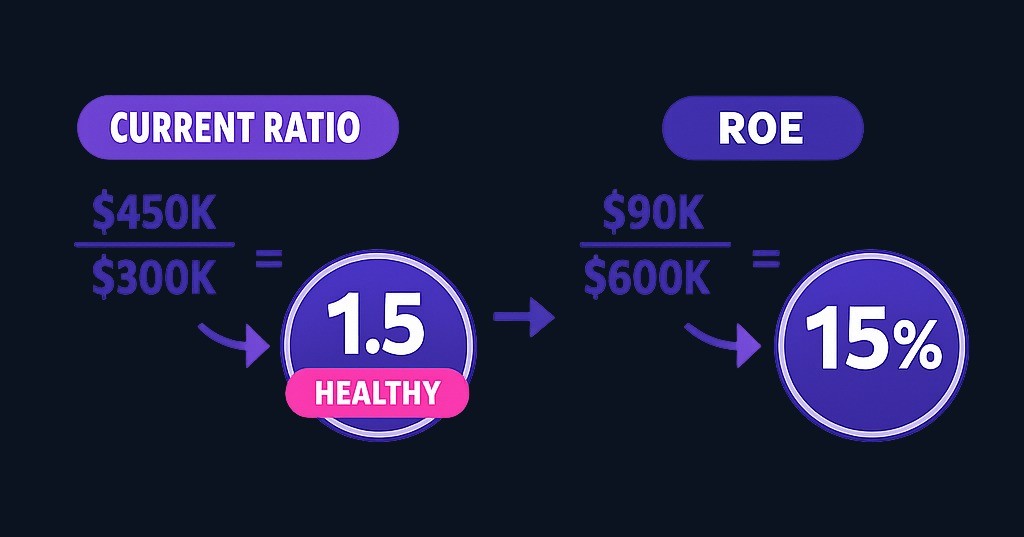
- Check balance sheet strength. Two liquidity ratios do most of the work. The current ratio — current assets divided by current liabilities — measures whether short-term assets cover short-term obligations. A range of 1.0 to 3.0 is generally read as healthy. Below 1.0, short-term bills exceed short-term resources. Above 3.0, cash may be sitting idle instead of working. The quick ratio is more conservative: it excludes inventory and prepaid expenses from the asset side. It answers a sharper question: could this company pay its bills without selling inventory first?
- Test leverage. The debt ratio (total liabilities divided by total assets) and financial leverage (total assets divided by total equity) show how much of the company runs on debt versus equity. The debt-to-equity ratio compares total debt directly against shareholders' equity. Most investors prefer it below 1, and treat 2 or higher as a signal of elevated risk.
- Check profitability with margins. Gross margin, operating margin, and net margin each show how much of every revenue dollar the company actually keeps after subtracting different layers of cost. Steady or improving margins are a good sign. Margins that narrow over several periods flag rising costs or competitive pressure.
- Layer in return and valuation ratios. Return on equity — net income divided by shareholders' equity — shows the return shareholders earn on their stake. The P/E ratio (share price divided by earnings per share) shows how much you pay per dollar of annual profit. The PEG ratio divides P/E by the projected earnings growth rate to add growth context — a PEG under 1 is generally read as undervalued.
Worked example (hypothetical, for illustration only): a company reports $450,000 in current assets and $300,000 in current liabilities. Current ratio = 1.5 — comfortably inside the healthy range. The same company earns $90,000 in net income against $600,000 in shareholders' equity. ROE = 15%. Compare that against its own history and its closest peers before deciding if it's good.
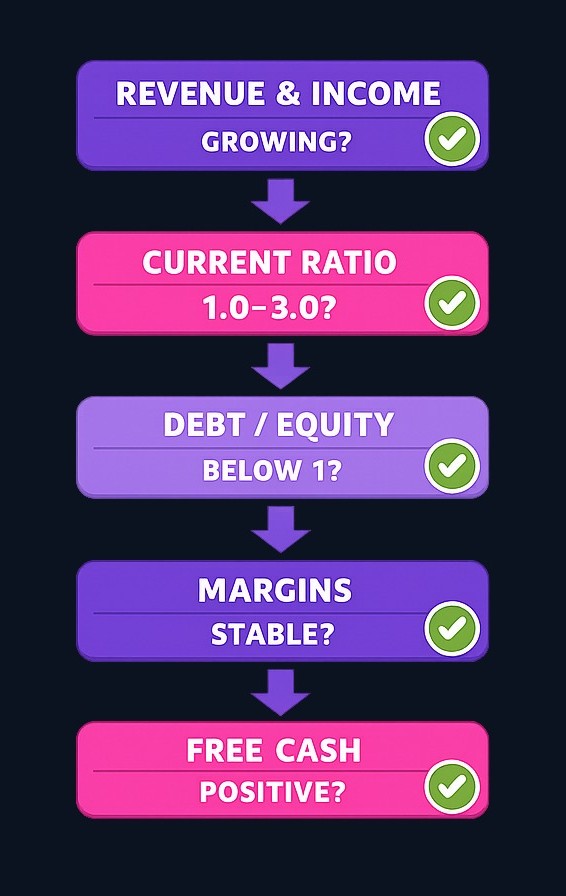
Decision Framework: Is This Company Financially Healthy?
Use this sequence to reach a verdict instead of eyeballing one ratio:
- Revenue and net income both growing over 3+ years? Good — move to the next check. Flat or declining? Find the cause before continuing.
- Current ratio between 1.0 and 3.0? Good. Below 1.0, check whether cash flow from operations still covers near-term bills. Above 3.0, ask why cash isn't being deployed.
- Debt-to-equity below 1? Good. Between 1 and 2, check the industry norm. Above 2, treat it as an elevated-risk flag until proven otherwise.
- Margins stable or improving? Good. Narrowing margins for two or more consecutive periods — investigate competitive or cost pressure before buying.
- Footnotes free of major surprises? Good. Pension shortfalls, covenant issues, or related-party transactions in the notes should slow you down, whatever the top-level ratios say.
- All five checks pass? That's a reasonable candidate for deeper qualitative research. Two or more fail? Treat it as a weak case until the next quarter's filing changes the picture.
Common Pitfalls in Financial Statement Analysis
- Reading one statement, or one year, alone. A strong income statement can hide a balance sheet loaded with debt. One good quarter can be an anomaly, not a trend. Read all four statements together, across multiple years.
- Ignoring the gap between profit and cash. Accounting profit and actual cash movement can diverge. A company can report rising earnings while cash drains from operations. If net income climbs but operating cash flow doesn't follow, investigate before trusting the reported number.
- Comparing ratios across industries. A P/E of 25 can be cheap for a fast-growing software company. The same P/E can be expensive for a slow utility. Ratios only mean something compared against the same company's own history and its closest peers — never against an unrelated sector.
- Treating a low ratio as automatically cheap. A price-to-book ratio below 1 can signal undervaluation — or it can mean the market expects further deterioration. The same caution applies to a falling P/E. Sometimes the market is right to be worried.
- Skipping the footnotes. The notes disclose accounting policies, tax details, and pension or stock-option obligations that never appear in the summary numbers. Skip them, and you miss exactly the disclosures companies are required to make about their own risk.
- Forgetting that economic conditions move every company's numbers. Rising interest rates raise borrowing costs and can compress margins broadly. A slowing economy can shrink revenue across an entire sector at once. Before blaming one company's weak numbers on mismanagement, check whether its peers show the same pattern.
- Analyzing once and never again. Financial statements refresh every quarter, and companies drift from their historical patterns. Re-run the checklist at least once a year, and immediately after any major company news.
Practice investing with Finelo
Build practical investing skills with guided lessons, simulator practice, and structured challenges.
Case Studies: Strong vs. Weak Financial Statements
Two illustrative companies — composites built for this guide, not real firms — show how the same checklist can produce opposite verdicts.
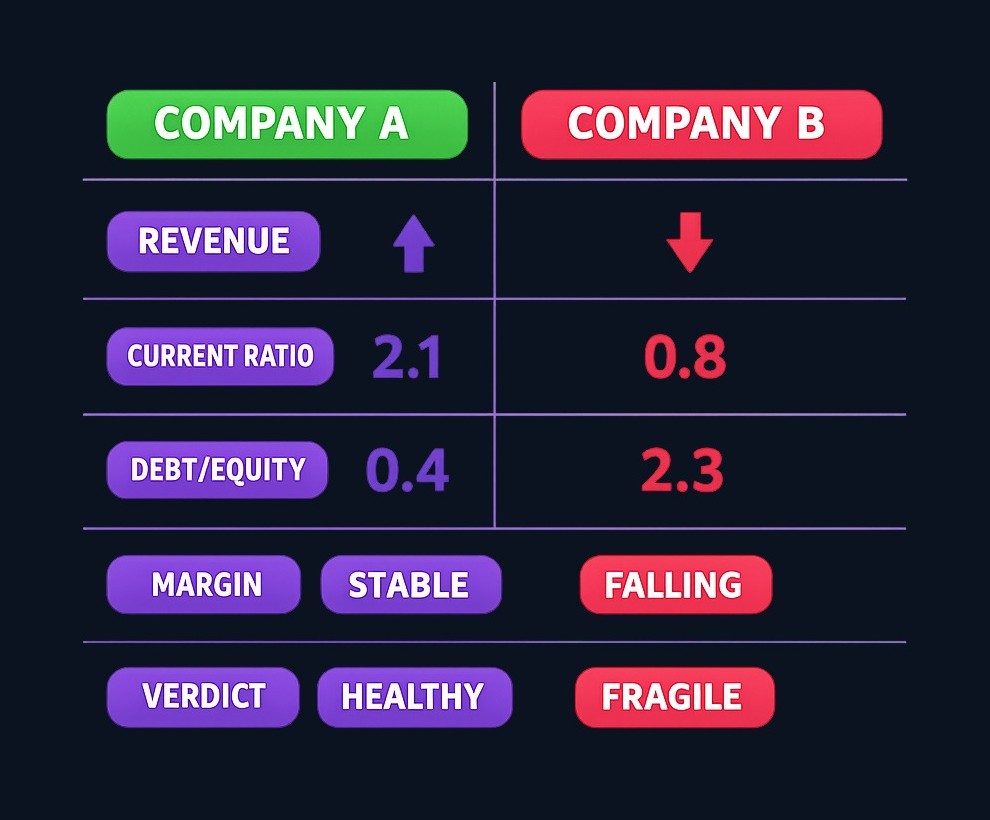
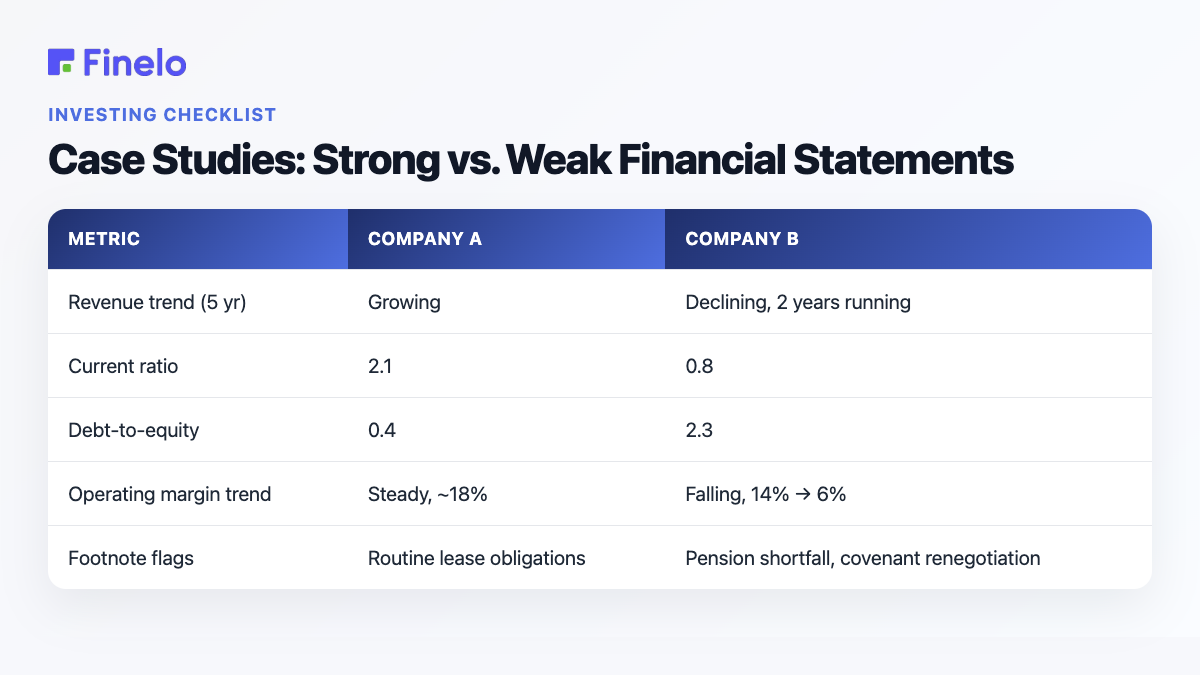
Company A: the resilient operator. Revenue has grown for five straight years, and net income has grown with it. Current ratio: 2.1, comfortably inside the healthy 1.0–3.0 range. Debt-to-equity: 0.4, well under the commonly cited 1.0 caution line. Operating margin has held steady around 18% for three years, matching the pattern of margins holding steady or beating peers as a positive sign. ROE sits at 16%, consistent with its own five-year average. The footnotes disclose only routine lease obligations. Verdict: financially healthy, funded mainly by its own operations, and worth a deeper qualitative look.
Company B: the fragile story. Revenue has declined for two consecutive years. Reported net income barely stayed positive — already a mismatch worth investigating. Current ratio: 0.8, below the healthy range. Short-term obligations now exceed short-term resources. Debt-to-equity: 2.3, above the caution threshold most investors watch for. Operating margin has compressed from 14% to 6% over three years — the exact narrowing pattern that signals rising costs or competitive pressure. The footnotes reveal a pension shortfall and a recent covenant renegotiation with lenders. Verdict: a company under real financial strain, where a "cheap" share price likely reflects the market pricing in further trouble.
| Metric | Company A | Company B |
|---|---|---|
| Revenue trend (5 yr) | Growing | Declining, 2 years running |
| Current ratio | 2.1 | 0.8 |
| Debt-to-equity | 0.4 | 2.3 |
| Operating margin trend | Steady, ~18% | Falling, 14% → 6% |
| Footnote flags | Routine lease obligations | Pension shortfall, covenant renegotiation |
The lesson generalizes beyond these two composites. Identical-looking numbers on one statement can mean opposite things once you read all four statements, run the ratios, and check the footnotes. A single metric — even a good one — never settles the verdict alone.
What to Know Before Deciding
Before you call a company "financially healthy" and move to a buy decision, confirm each of these:
- You've read at least three years of the income statement, not one.
- The current ratio and debt-to-equity both fall inside the healthy ranges above — or you understand exactly why they don't.
- Margins are stable or improving, not narrowing quarter after quarter.
- You've read the footnotes for pension, debt covenant, and related-party surprises.
- You've compared the company against peers in its own industry, not an unrelated sector.
- You've checked the most recent quarterly filing, not just the last annual report.
Public companies refresh these numbers every quarter, publishing a full annual report and three shorter quarterly updates in between. A company that looks like Company A after several quarters of margin compression could be drifting toward Company B. Checking each new filing against the same ratios — not just the year you first researched the stock — is what catches the shift early.
Tools and Resources for Financial Statement Analysis
You don't need paid software to run this checklist. The free toolkit:
- SEC EDGAR. The SEC's public database of company filings, free to search by company name or ticker. Annual reports, quarterly reports, and disclosures of major events are posted here directly by the companies that file them — the same source documents analysts use, with no summary layer in between.
- Your brokerage's research tab. Most mainstream brokerages bundle basic fundamentals, ratio history, and analyst commentary into the account you already have, at no extra cost.
- A simple spreadsheet. The whole checklist above — current ratio, debt-to-equity, margins, ROE, P/E, PEG — fits in one spreadsheet with a column per year. Building it yourself forces you to actually read each number instead of skimming a pre-built summary.
- Company investor relations pages. Annual reports, earnings call materials, and management presentations, published directly by the company.
- Financial news and screening platforms. Useful for building a shortlist and reading more than one perspective on the same filing. Treat any conclusion you read there as a starting point, never a replacement for your own checklist.
A practical workflow: pull the raw numbers from EDGAR or your brokerage's research tab. Run the five-step ratio checklist in a spreadsheet across three-plus years. Then read the footnotes and investor relations materials for the qualitative story the numbers alone can't tell.
Conclusion and Next Steps
The full loop: read all four statements — not just the income statement — across three-plus years. Run the core ratios: current ratio, debt-to-equity, margins, ROE, P/E, and PEG. Read the footnotes. Check whether the pattern matches the company's own history and its closest peers, not an unrelated industry. Two companies with an identical single ratio can deserve opposite verdicts once you follow that full sequence, exactly as the case studies above show.
Your next step: pull one company's last three annual filings from EDGAR. Build the five-step checklist in a spreadsheet. Practice the full routine on a company you already know before applying it to one you're actually considering buying, lending to, or working for.
This guide is educational, not personalized financial or investment advice. Ratios, benchmarks, and disclosure requirements can change, and no analysis method guarantees an outcome. Verify current figures and consult a qualified professional for your own situation.
Want a structured path from these fundamentals to confident investing? Finelo's Wealth Growth Quiz matches you with a learning track suited to your starting level.
Frequently asked questions
What is financial statement analysis?
It's the practice of reading a company's income statement, balance sheet, cash flow statement, and statement of shareholders' [equity](https://www.sec.gov/about/reports-publications/beginners-guide-financial-statements) together, then testing them with ratios like the current ratio, debt-to-equity, and margins. The goal is judging financial health and trend, not glancing at one number in isolation.
What is the difference between cash flow and profit?
Profit, or net income, is an accounting figure calculated after non-cash items like depreciation. Cash flow tracks actual money moving in and out through operating, investing, and financing [activities](https://www.sec.gov/about/reports-publications/beginners-guide-financial-statements). The two can diverge: a company can report a profit on paper while cash quietly drains from the business. That's why the cash flow statement earns its own read, separate from the income statement.
What are the four main financial statements?
The balance sheet, the income statement, the cash flow statement, and the statement of shareholders' [equity](https://www.sec.gov/about/reports-publications/beginners-guide-financial-statements). Together they show what a company owns and owes, whether it's profitable, where its cash actually went, and how its equity changed over the period.
What is GAAP?
GAAP stands for Generally Accepted Accounting Principles — the framework that establishes financial reporting standards in the United States and governs how companies record revenue, value assets, and disclose [information](https://www.fidelity.com/learning-center/trading-investing/fundamental-analysis/essentials-of-gaap). It exists so investors can make meaningful, like-on-like comparisons among [companies](https://www.fidelity.com/learning-center/trading-investing/fundamental-analysis/essentials-of-gaap).
InvestingBeginnerFinancial StatementsMarkets
Practice investing with Finelo
Build practical investing skills with guided lessons, simulator practice, and structured challenges.
About the author
Finelo Team
The Finelo Team creates practical investing and trading education designed to help beginners learn faster with structured challenges, simulator practice, and bite-sized lessons.
Keep reading — Related articles

Investing
Yield to Call vs Yield to Maturity: Assumptions and Bond Risks
Yield to call (YTC) estimates a bond's yield if the issuer redeems it on an eligible call date; yield to maturity (YTM) estimates yield if it remains outstanding to final maturity.
Finelo Team
Investing
Will My Employer Know If I Take a 401(k) Loan?
Who this page is for: readers new to 401(k) loans who want a practical, privacy‑focused explanation — what your employer can see, how to limit visibility, and the financial tradeoffs to weigh.
Finelo Team

Investing
What Medical Expenses Qualify for a 401(k) Hardship Withdrawal?
Before you decide, confirm three things with your plan administrator:
Finelo Team


