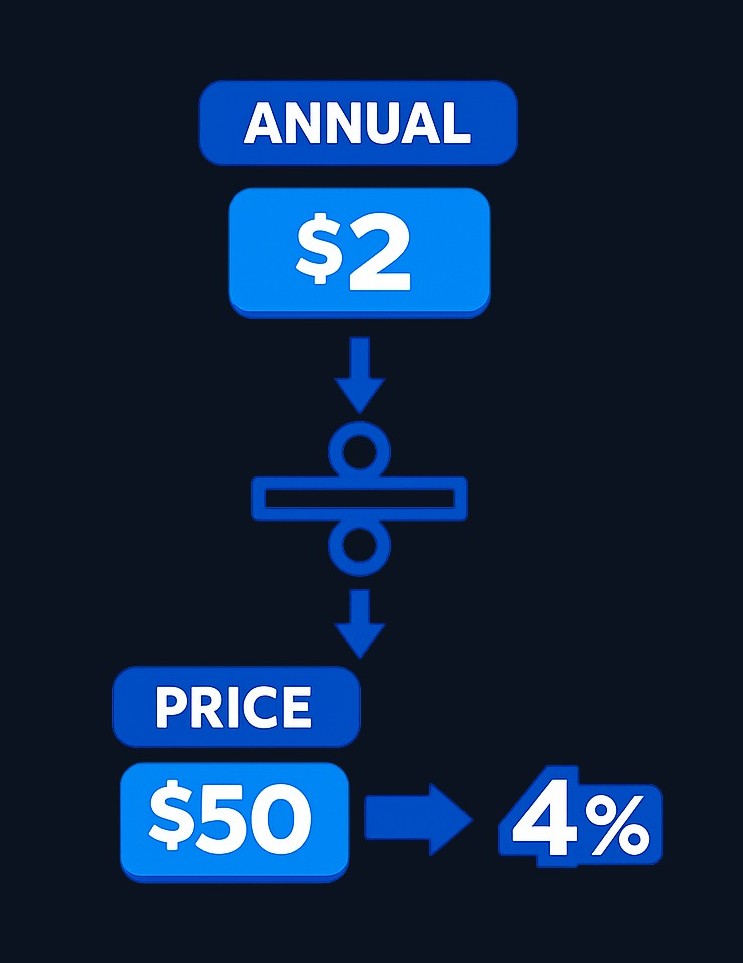
Dividend yield measures how much dividend income a stock pays relative to its price. The formula is simple: dividend yield = annual dividends per share ÷ current share price, multiplied by 100 to get a percentage. A stock paying $2 per year in dividends and trading at $50 has a yield of 4%.
How to Calculate Dividend Yield: A Step-by-Step Guide
Dividend yield measures how much dividend income a stock pays relative to its price. The formula is simple: dividend yield = annual dividends per share ÷ current share price, multiplied by 100 to get a percentage. A…
8 min read
Practice investing with Finelo
Build practical investing skills with guided lessons, simulator practice, and structured challenges.
Want to learn more?
Build practical investing skills with guided lessons, simulator practice, and structured challenges.
Explore FineloExplore Finelo's 28-day challenges
Turn learning into a daily habit with guided challenge paths.
That one number lets you compare the income power of any two dividend-paying stocks in seconds — a $50 stock and a $500 stock, a utility and a bank. This guide walks through the calculation step by step, the traps hiding inside that simple formula, and how to read the result like an experienced investor rather than chasing the biggest number.
What is Dividend Yield?
A dividend is a cash payment some companies make to shareholders, typically drawn from profits. Dividend yield converts those payments into a percentage of the stock's price, so income can be compared across stocks at any price level.
Formally: take the total annual dividends a company pays out and divide by the current share price. Three things to understand about the result:
- It's a rate, not a promise. Companies can cut or stop dividends at any time, so yield is not a guaranteed return.
- It moves constantly. Yield depends on the share price, and share prices are always in flux — so a yield can change day to day even when the dividend itself hasn't budged.
- It's only the income half. Yield says nothing about whether the share price itself is rising or falling. Total return combines both.
Why investors care: for income-focused portfolios — retirees drawing cash, or anyone building a dividend stream — yield is the metric that says how hard each invested dollar works. For everyone else, it's a quick lens on how a company returns cash to shareholders.
Step-by-Step Calculation of Dividend Yield
Step 1: Find the annual dividend per share. Two accepted methods exist:
- Trailing: add up the past 12 months of dividend payments — a historical, backward-facing view.
- Forward: multiply the most recent quarterly dividend by 4 — typically considered the better forward-looking estimate.
Match the multiplier to the payment schedule: quarterly payers × 4, monthly payers × 12, semi-annual payers × 2.
Step 2: Find the current share price. Any quote from your brokerage app or a finance site works. Use the live price, not what you paid — yield describes the stock today.
Step 3: Divide and convert. Annual dividend ÷ share price, then × 100.
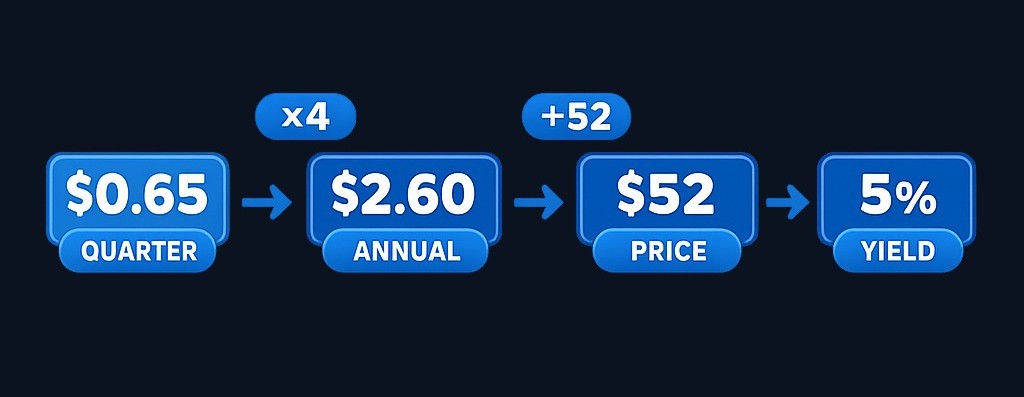
A full worked example. Suppose a company just paid a quarterly dividend of $0.65, and its stock trades at $52:
- Annual dividend: $0.65 × 4 = $2.60
- Share price: $52
- Yield: $2.60 ÷ $52 = 0.05 → 5.0%
Now the practical payoff — translating yield into income. If you hold 200 shares ($10,400 invested), a 5% yield implies about $520 per year in dividends, or roughly $130 per quarter, assuming the dividend holds. Reverse the math for planning: wanting $1,000 of annual income from this stock means holding about $20,000 of it at the current yield.
One habit worth building: run the calculation with both trailing and forward numbers. If the two disagree sharply, the dividend recently changed — and you should find out why before investing.
Factors Affecting Dividend Yield
Only two inputs exist, so yield changes whenever either the dividend or the share price changes:
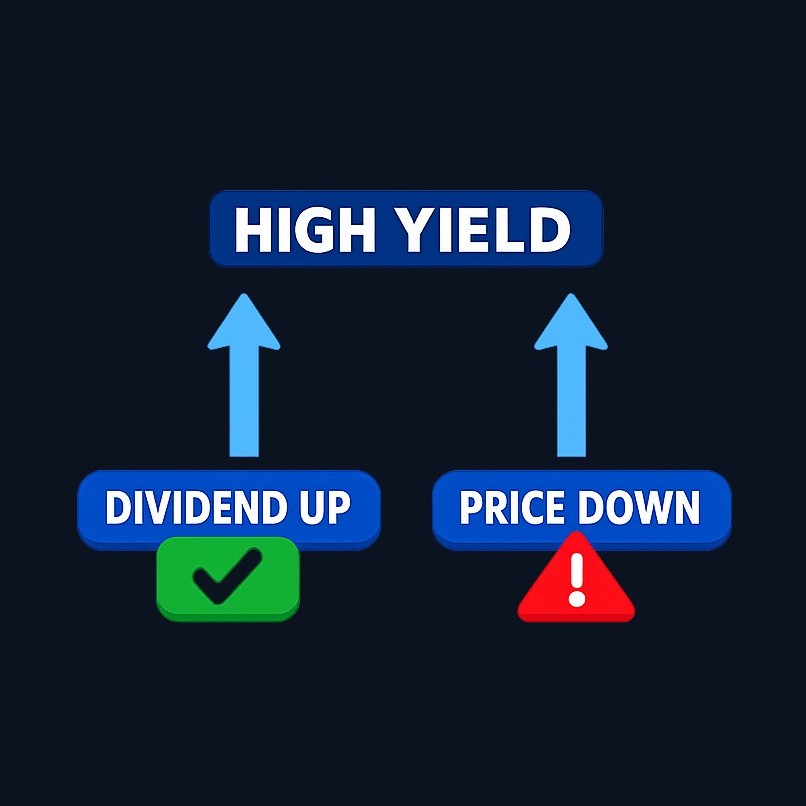
- Yield rises when the dividend increases or the share price falls.
- Yield falls when the dividend is cut or the share price rises.
Notice what that means: a rising yield is not automatically good news. It might mean a growing dividend — or a collapsing stock. The formula can't tell you which; you have to look.
Broader forces move yields too. Company performance drives the dividend side: profits fund dividends, so weakening earnings pressure the payment. Market sentiment drives the price side: a sector falling out of favor sees prices drop and measured yields rise across the board. And interest rates shape the whole landscape — when safer income alternatives pay more, dividend stocks compete for income investors' money, which tends to influence their prices and, through prices, their yields.
Company maturity matters as well. Established, slow-growing businesses often pay out generously because they have fewer growth projects to fund. Fast-growing companies frequently pay little or nothing, preferring to reinvest — which is why a low or zero yield isn't a flaw; it can simply signal a different strategy.
Practice investing with Finelo
Build practical investing skills with guided lessons, simulator practice, and structured challenges.
Real-World Examples of Dividend Yield Calculations
Three hypothetical companies show how the same formula tells three different stories:
| Steady Utility Co. | Growth Software Inc. | Fallen Retailer Corp. | |
|---|---|---|---|
| Annual dividend/share | $3.00 | $0.40 | $2.00 |
| Share price | $75 | $200 | $18 |
| Dividend yield | 4.0% | 0.2% | 11.1% |
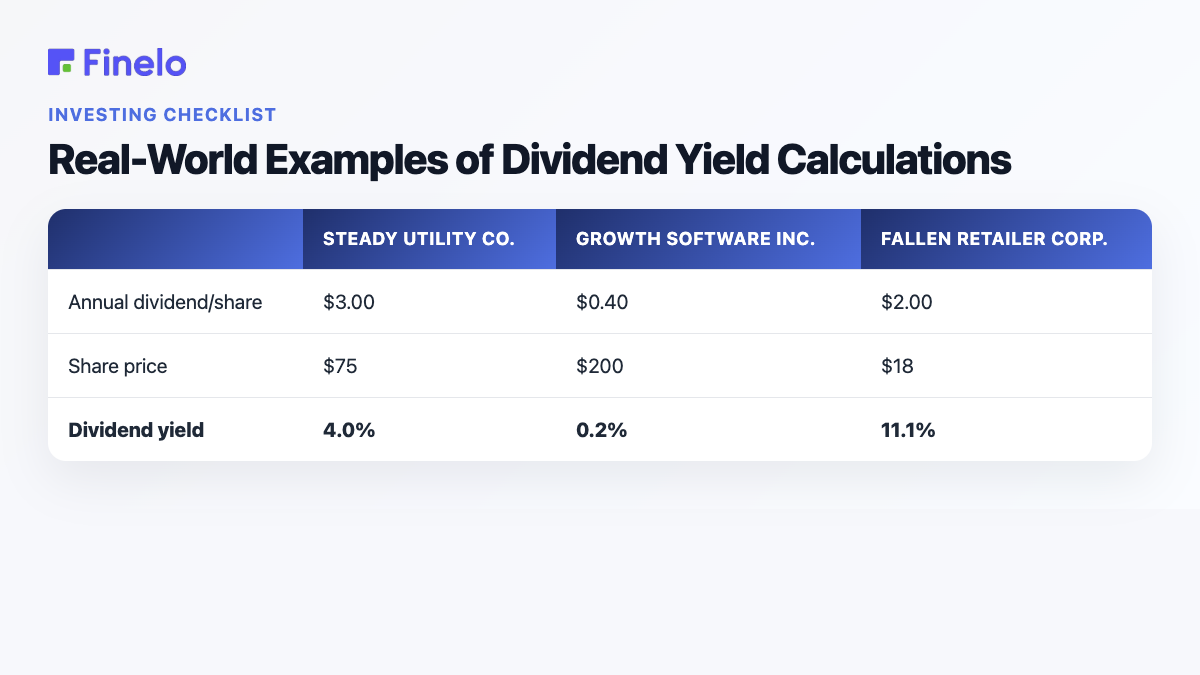
Steady Utility Co. — the classic income stock. A 4% yield from stable, regulated cash flows. The dividend is well covered by earnings, and the price doesn't swing much. This is the profile income investors typically seek.
Growth Software Inc. — the token payer. A 0.2% yield looks tiny, but it's a choice, not a weakness: profits go into growth. Investors here are betting on price appreciation, not income. Judging this stock by yield alone misjudges it entirely.
Fallen Retailer Corp. — the trap candidate. An 11.1% yield looks irresistible until you check why. The stock has slid from $45 to $18. The market is signaling doubt that the $2.00 dividend survives. As Fidelity warns, a very high yield can be a red flag that the company is struggling — the share price has fallen significantly or the dividend is at risk. If the dividend is cut to $0.50, today's buyer ends up holding a troubled stock yielding under 3%.
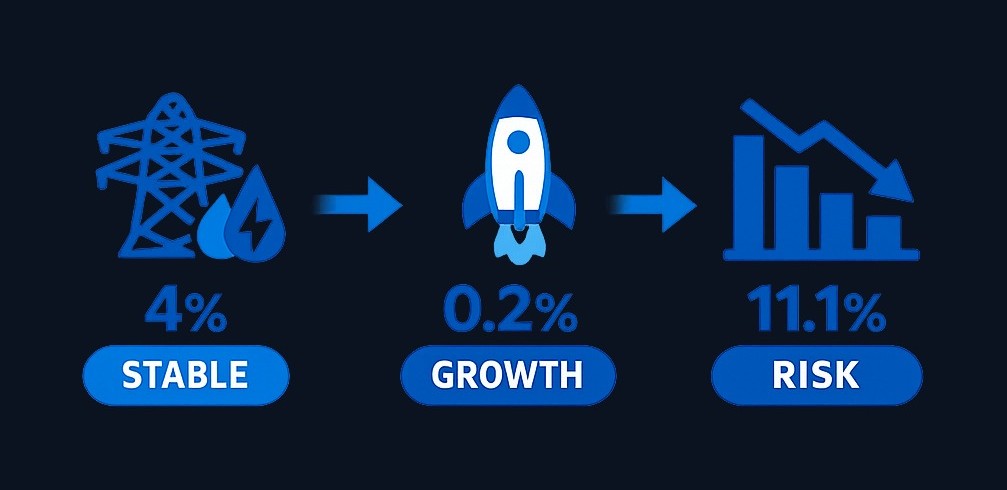
The lesson across all three: yield is a starting question, never a final answer. The number only becomes meaningful once you know what's driving it.
Understanding the Implications of Dividend Yield
A moderate, stable yield usually signals a mature company that shares profits consistently. Boring — in the good sense.
A very high yield demands skepticism before excitement. Since yield rises mechanically when price falls, extreme yields often mark stocks the market has punished. Sometimes the market is wrong and the income is real. Often, the elevated yield signals a dividend at risk. The test: is the dividend strong, or is the price weak?
A low or zero yield means little by itself. It can mark a growth company reinvesting everything, or a business that can't afford payouts. Context decides.
Two habits sharpen interpretation. First, compare within sectors, not across them — utilities and software companies live in different yield worlds, so a "high" yield for one is normal for the other. Second, look at the yield's history for the same stock: a yield far above its own long-term norm usually means the price has dropped, which is either an opportunity or a warning, and deserves investigation either way.
And remember the income-versus-total-return distinction: a high-yield stock whose price sinks 15% in a year still lost you money overall. Yield is one component of return, not the scoreboard.
Common Mistakes in Calculating Dividend Yield
- Using your purchase price instead of the current price. Yield describes today's market. (Income relative to what you paid is a different metric — yield on cost — useful, but don't mix the two.)
- Multiplying by the wrong frequency. Treating a quarterly payment as annual understates yield fourfold; treating a monthly payer's payment as quarterly misstates it too. Match the multiplier to the schedule.
- Counting one-time special dividends as recurring. A special payout inflates the trailing number for a year, promising income that won't repeat. Check whether the past 12 months include anything unusual.
- Ignoring a recent cut when using trailing figures. The trailing method looks backward, so a dividend slashed last month still shows up rosy in a 12-month sum. The forward method catches it.
- Chasing the biggest number. The screener sorted by yield puts the riskiest names on top, because struggling companies produce spectacular yields right before cutting them.
- Forgetting taxes and fees. Dividends may be taxable in regular accounts, so realized income can be smaller than the quoted yield suggests. Rules vary — check your situation.
Conclusion and Next Steps
The mechanics take a minute to learn: annual dividends ÷ current share price, times 100. The judgment takes longer — checking whether a yield is fueled by a healthy dividend or a falling price, comparing within sectors, and remembering that no dividend is guaranteed.
Your next steps: practice the calculation on a few stocks you know, run both trailing and forward versions, and investigate any yield that looks too good before trusting it. This guide is educational, not investment advice — evaluate risk, costs, and suitability for your own situation before buying any stock.
Want to build these analysis skills systematically? Finelo's Wealth Growth Quiz matches you with an investing learning path that fits your current level.
Frequently asked questions
What's the difference between trailing and forward dividend yield?
Trailing uses the actual dividends paid over the past 12 [months](https://www.fidelity.com/learning-center/trading-investing/dividend-yield); forward annualizes the most recent [payment](https://www.fidelity.com/learning-center/trading-investing/dividend-yield). Trailing reflects reality; forward reflects the current run-rate. When they differ a lot, the dividend recently changed.
What is a good dividend yield?
There's no universal number — it depends on the sector, the company's stability, and prevailing rates. A sustainable moderate yield generally beats a spectacular fragile one, since dividends can be cut at any [time](https://www.fidelity.com/learning-center/trading-investing/dividend-yield).
What's the difference between dividend yield and total return?
Yield counts only the income. Total return adds share-price change. A 5% yield with a 10% price drop is a negative year; a 1% yield with 20% price growth is an excellent one.
What is the dividend payout ratio?
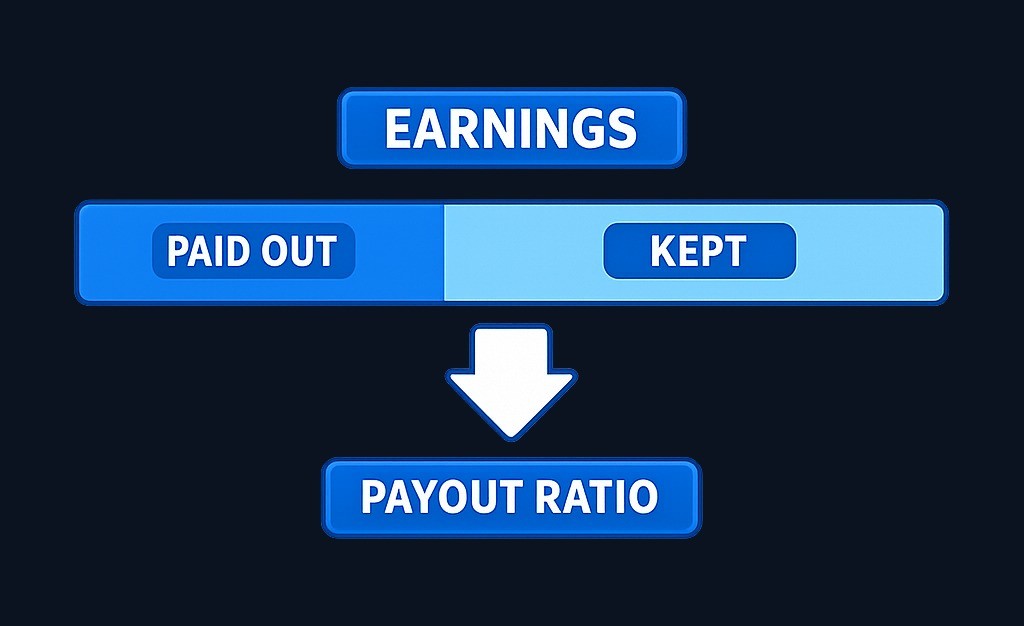
It's the share of a company's earnings paid out as dividends. It complements yield: yield tells you what you receive relative to price, while the payout ratio hints at whether the company can keep paying it. A payout consuming nearly all earnings leaves little cushion.
InvestingBeginnerDividendsMarkets
Practice investing with Finelo
Build practical investing skills with guided lessons, simulator practice, and structured challenges.
About the author
Finelo Team
The Finelo Team creates practical investing and trading education designed to help beginners learn faster with structured challenges, simulator practice, and bite-sized lessons.
Keep reading — Related articles

Investing
Yield to Call vs Yield to Maturity: Assumptions and Bond Risks
Yield to call (YTC) estimates a bond's yield if the issuer redeems it on an eligible call date; yield to maturity (YTM) estimates yield if it remains outstanding to final maturity.
Finelo Team

Investing
Will My Employer Know If I Take a 401(k) Loan?
Who this page is for: readers new to 401(k) loans who want a practical, privacy‑focused explanation — what your employer can see, how to limit visibility, and the financial tradeoffs to weigh.
Finelo Team

Investing
What Medical Expenses Qualify for a 401(k) Hardship Withdrawal?
Before you decide, confirm three things with your plan administrator:
Finelo Team


