Evaluating a stock before buying comes down to three layers of homework: read the company's financial statements to confirm it's healthy, use a handful of ratios to judge whether the price is reasonable, and weigh qualitative factors — management, competitive position, industry direction — that numbers can't capture. Remember what you're actually purchasing: a stock is an ownership share in a company, so you're buying into its future success or failure, not a lottery ticket.
How to Evaluate a Stock Before Buying: A Complete Guide
Evaluating a stock before buying comes down to three layers of homework: read the company's financial statements to confirm it's healthy, use a handful of ratios to judge whether the price is reasonable, and weigh…
7 min read
Practice investing with Finelo
Build practical investing skills with guided lessons, simulator practice, and structured challenges.
Want to learn more?
Build practical investing skills with guided lessons, simulator practice, and structured challenges.
Explore FineloExplore Finelo's 28-day challenges
Turn learning into a daily habit with guided challenge paths.
This guide is for beginners who want a repeatable evaluation routine. It walks through each layer with worked examples, shows how two similar-looking stocks can deserve opposite verdicts, and ends with a checklist you can apply to any company before spending a dollar.
Understanding Financial Statements
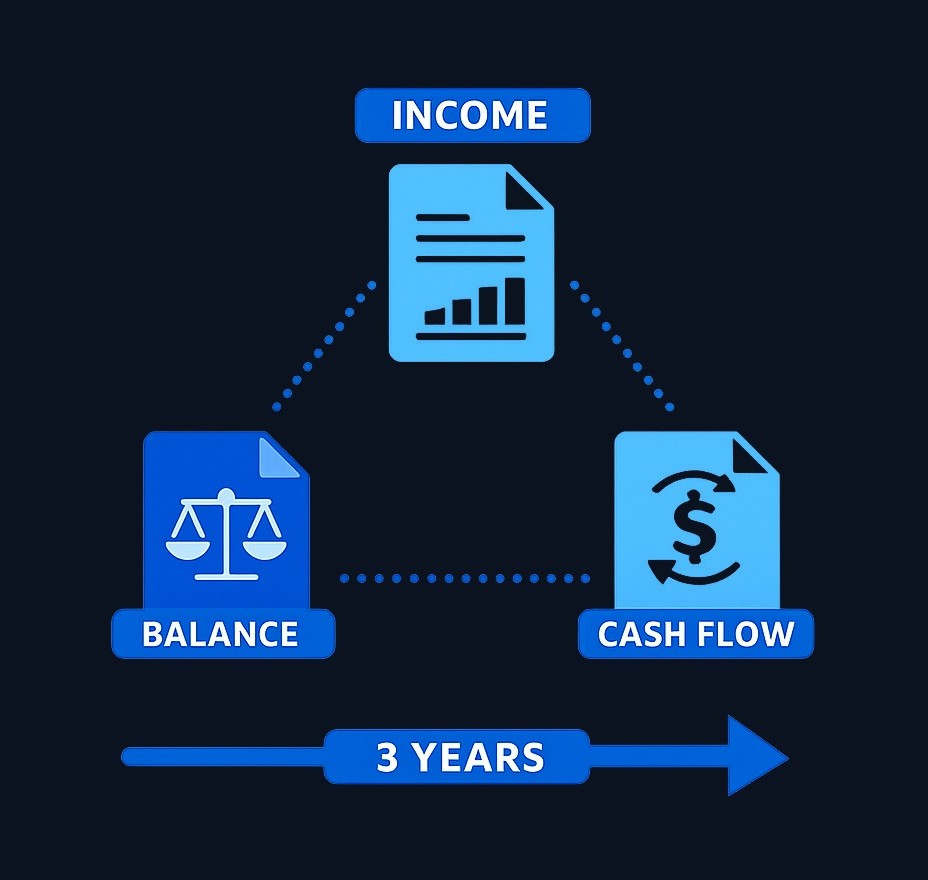
Three documents tell you nearly everything about a company's financial health. All are free — every public company publishes them.
The income statement shows whether the business makes money over a period: revenue at the top, costs subtracted layer by layer, profit at the bottom. Look for revenue that grows over several years and profit that grows with it. Revenue rising while profit shrinks is a warning worth investigating — costs are winning.
The balance sheet shows what the company owns and owes at a single date. The key beginner check is debt: a company carrying heavy debt relative to its assets and equity is fragile in downturns, whatever its income statement says.
The cash flow statement shows actual money moving in and out. It exists because accounting profit and real cash can differ — a company can report earnings while cash drains away. Healthy businesses generate real cash from operations, year after year.
Read all three together, across at least three years. One document alone — or one year alone — is a snapshot pretending to be a story. The trend is the truth.
Key Financial Ratios to Consider
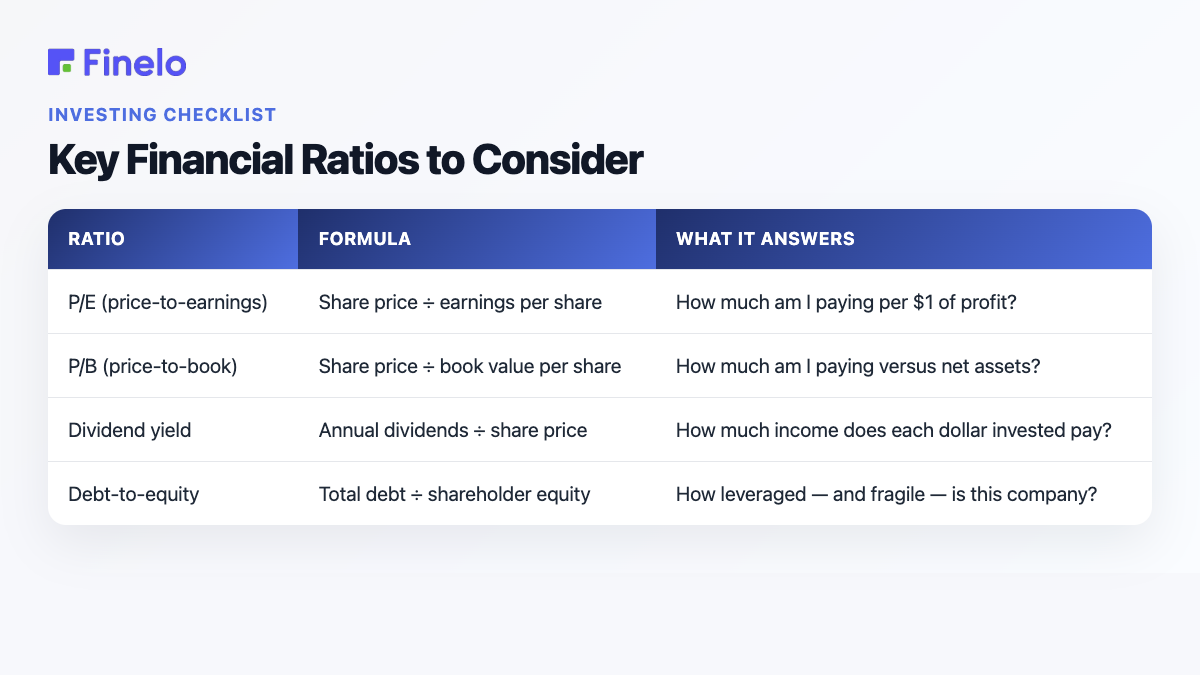
Ratios turn raw statements into comparable numbers. Four cover most beginner needs:
| Ratio | Formula | What it answers |
|---|---|---|
| P/E (price-to-earnings) | Share price ÷ earnings per share | How much am I paying per $1 of profit? |
| P/B (price-to-book) | Share price ÷ book value per share | How much am I paying versus net assets? |
| Dividend yield | Annual dividends ÷ share price | How much income does each dollar invested pay? |
| Debt-to-equity | Total debt ÷ shareholder equity | How leveraged — and fragile — is this company? |
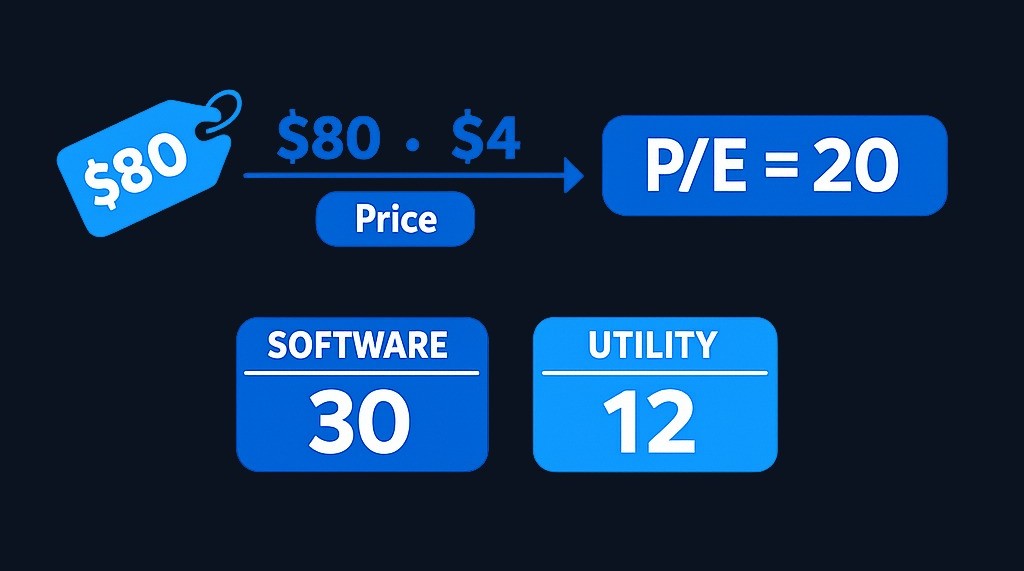
A worked example makes P/E concrete. A stock trades at $80, with earnings per share of $4. P/E = 20: you pay $20 for each dollar of annual profit. Whether 20 is expensive depends entirely on context — a fast-growing software firm might reasonably trade at 30, while a slow utility at 20 could be pricey. That's the cardinal rule of ratios: compare within the industry and against the company's own history, never in isolation.
Dividend yield works the same way: $2.40 in annual dividends on a $60 stock is a 4% yield. Attractive — unless the price recently collapsed, which inflates yield mechanically while signaling trouble.
And one caution that saves beginners real money: a low ratio isn't automatically a bargain. A P/E far below peers can mean the market expects earnings to fall. Ratios raise questions; they don't answer them alone.
Qualitative Factors in Stock Evaluation
Numbers describe the past. The qualitative layer is your judgment about the future, and the more you know about the company, its industry, and broader market trends, the better positioned you are.
Management quality. Read the CEO's shareholder letters from two or three years back, then check what actually happened. Consistent follow-through matters more than eloquent plans. Frequent executive turnover is a yellow flag.
Competitive position. Ask what protects this business: a trusted brand, high switching costs, network effects, cost advantages? A profitable company with no defenses is an invitation for competitors to eat its margins. Then ask the industry question — is the whole sector growing or shrinking? A great operator in a dying industry still swims against the current.
Your own understanding. Can you explain how the company makes money in two plain sentences? If not, skip it. You can't hold a business calmly through a rough quarter if you never understood it in the first place.
Ongoing attention. Evaluation doesn't end at purchase — after the filings and formulas, the final discipline is simply paying attention to company news, earnings reports, and industry shifts that change your original thesis.
Practice investing with Finelo
Build practical investing skills with guided lessons, simulator practice, and structured challenges.
Using Stock Screeners and Tools
You don't need expensive software. The free toolkit:
- Stock screeners — filters that surface stocks matching parameters you set, whether you're hunting established blue chips or smaller companies. Screen on the ratios above to build a shortlist worth deeper research.
- Company investor relations pages — the primary source: annual reports, quarterly results, and management presentations, straight from the company.
- Your brokerage's research tab — most brokers bundle analyst reports, financials, and charting at no extra cost.
- Financial news platforms — plentiful online tools exist to research companies, screen stocks, and model potential; use reputable outlets for context on industries and market conditions.
- Volatility measures — a stock's beta gauges how much turbulence a holding is likely to experience when the broader market gets rough. A beta above 1 historically swings harder than the market; below 1, gentler. It's a quick first read on risk.
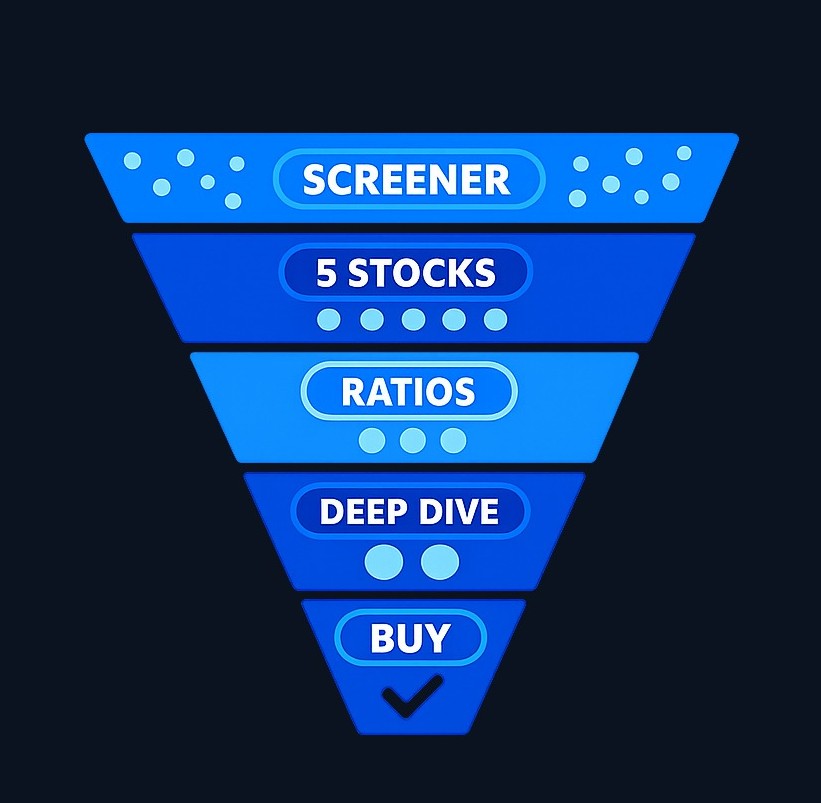
Workflow tip: use tools in a funnel. Screener → shortlist of five → financial statements and ratios → two survivors → qualitative deep-dive → decision. Each stage should eliminate candidates; research that never says "no" isn't research.
Case Studies: Two Stocks, Same Numbers, Different Verdicts
Consider two illustrative companies — composites, not real firms — that look like twins on the surface. Both trade at a P/E of 14. Both pay a 3% dividend.
Company A: the steady compounder. Revenue has grown modestly every year for a decade. Debt is low. Cash flow comfortably covers the dividend. Its P/E of 14 sits right at its own 10-year average, and management has hit its stated targets consistently. The evaluation verdict: fairly priced, financially sound, no red flags — a reasonable candidate for a diversified portfolio.
Company B: the value trap. Same P/E of 14 — but it traded at 22 a year ago, before the share price fell 35%. Revenue has declined two years running. Debt is triple Company A's level, and the dividend consumes nearly all cash flow. The "cheap" ratio reflects the market pricing in further decline. The verdict: the identical number means something entirely different — this is a business fighting for stability, not a bargain.
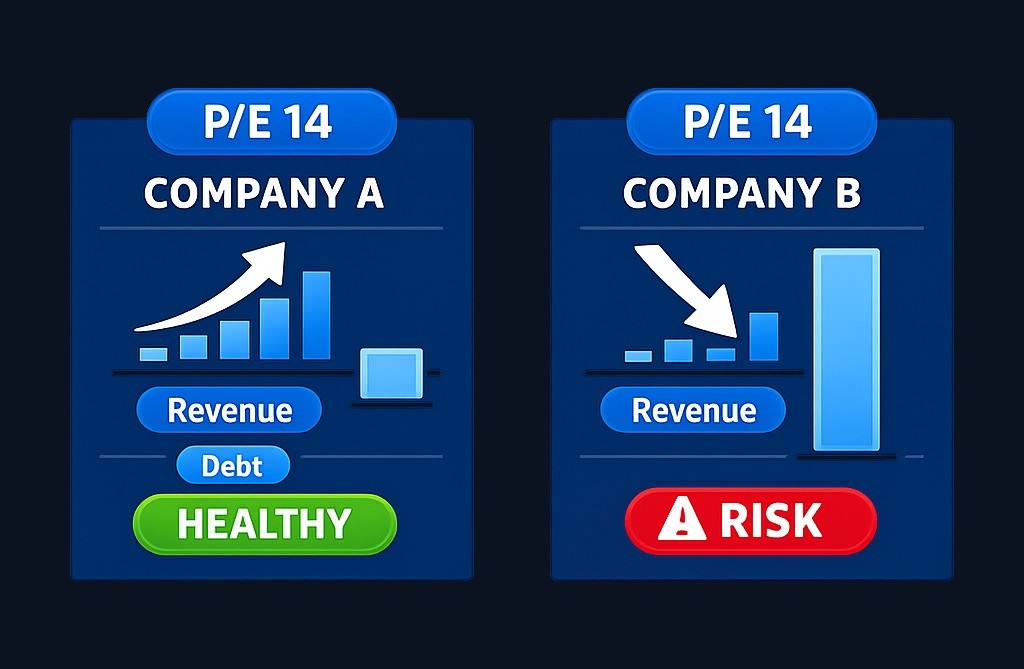
The lesson generalizes: ratios are the beginning of the question, and context is the answer. Two stocks with matching metrics can deserve opposite decisions once you read the statements behind the numbers and the story behind the statements. This is also why concentration is dangerous — owning only one stock means one company's failure can take your invested money with it. Even careful evaluation is sometimes wrong; diversification is the insurance.
Common Pitfalls in Stock Evaluation
- Falling for the story and skipping the filings. Exciting narratives are how expensive mistakes get marketed. Every thesis must survive contact with the financial statements.
- Reading ratios without context. A P/E means nothing until compared with industry peers and the company's own history. Cross-industry ratio comparisons mislead by design.
- Mistaking cheap for safe. Company B above is the standard trap: a falling price makes every ratio look attractive right up until the dividend is cut.
- Ignoring debt. Profit gets the attention; leverage decides who survives recessions. Check the balance sheet even when earnings look wonderful.
- Confirmation bias. Once you want to buy, you'll unconsciously collect agreeing opinions. Deliberately search for the bear case before purchasing — if you can't refute it, don't buy.
- Evaluating once, then never again. Companies drift from their theses. Re-check holdings against your original reasoning at least yearly, and after any major company news.
- Skipping diversification. However strong one evaluation looks, spreading holdings across sectors and risk levels is what keeps a single mistake survivable.
Conclusion and Next Steps
A complete stock evaluation runs: financial statements (three years, all three documents) → ratios in context (P/E, P/B, yield, debt) → qualitative judgment (management, moat, industry) → the bear case → position sizing within a diversified portfolio. Practice the full loop on a company you already know before applying it with real money — the routine, repeated identically each time, is what separates evaluation from guessing.
Markets involve risk, and no evaluation method guarantees results. This guide is educational, not personalized investment advice — verify suitability, costs, and risks for your own situation before buying any stock.
Frequently asked questions
What is the P/E ratio and why is it important?
It's the share price divided by earnings per share — the price you pay per dollar of annual profit. It matters because it makes companies of any size comparable, but it only becomes meaningful against industry peers and the stock's own history.
What's the difference between qualitative and quantitative analysis?
Quantitative analysis uses numbers: statements, ratios, growth rates. Qualitative analysis uses judgment: management quality, competitive position, industry direction. Strong evaluations need both — numbers confirm the past, judgment estimates the future.
How can I assess the risk of a particular stock?
Check three layers: financial risk (debt levels, cash flow stability), valuation risk (is the price assuming perfection?), and volatility — where beta indicates how sharply the stock tends to move with market [turbulence](https://www.sofi.com/learn/content/how-to-evaluate-stocks/). Then cap the position size so being wrong is affordable.
How often should I re-evaluate my stocks?
A full re-check yearly, plus a lighter review each earnings season. Re-evaluate immediately if something structural changes — new management, a big acquisition, or deterioration in the industry. Ready to build evaluation skills step by step? Finelo's Wealth Growth [Quiz](https://finelo.com/) matches you with an investing learning path that fits your current level.
InvestingBeginnerStock ResearchMarkets
Practice investing with Finelo
Build practical investing skills with guided lessons, simulator practice, and structured challenges.
About the author
Finelo Team
The Finelo Team creates practical investing and trading education designed to help beginners learn faster with structured challenges, simulator practice, and bite-sized lessons.
Keep reading — Related articles

Investing
Yield to Call vs Yield to Maturity: Assumptions and Bond Risks
Yield to call (YTC) estimates a bond's yield if the issuer redeems it on an eligible call date; yield to maturity (YTM) estimates yield if it remains outstanding to final maturity.
Finelo Team

Investing
Will My Employer Know If I Take a 401(k) Loan?
Who this page is for: readers new to 401(k) loans who want a practical, privacy‑focused explanation — what your employer can see, how to limit visibility, and the financial tradeoffs to weigh.
Finelo Team

Investing
What Medical Expenses Qualify for a 401(k) Hardship Withdrawal?
Before you decide, confirm three things with your plan administrator:
Finelo Team


