A balance sheet is a snapshot of a company's financial position at a single point in time. To read one, check three sections: assets (what it owns), liabilities (what it owes), and equity (what's left over for owners). The three must always balance: assets equal liabilities plus equity. From there, a few ratios tell you whether the company is financially sound.
How to Read a Balance Sheet: A Comprehensive Guide
A balance sheet is a snapshot of a company's financial position at a single point in time. To read one, check three sections: assets (what it owns), liabilities (what it owes), and equity (what's left over for owners)…
7 min read
Practice investing with Finelo
Build practical investing skills with guided lessons, simulator practice, and structured challenges.
Want to learn more?
Build practical investing skills with guided lessons, simulator practice, and structured challenges.
Explore FineloExplore Finelo's 28-day challenges
Turn learning into a daily habit with guided challenge paths.
This page is for anyone new to reading company financials — an investor, a job seeker checking an employer, or a small business owner reviewing their own numbers. Read the components section for vocabulary, then follow the step-by-step section to build your own reading habit.
Key Components of a Balance Sheet
Every balance sheet splits into the same three sections, in the same order.
Assets
Assets are everything the company owns. They split into two groups: current assets (cash, inventory, and anything convertible to cash within a year) and long-term assets (equipment, buildings, patents, and other holdings that take longer to convert). Common line items include:
- Cash and cash equivalents
- Accounts receivable — money customers owe the company
- Inventory
- Property, equipment, and buildings
- Intangible assets like patents or trademarks
Liabilities
Liabilities are everything the company owes. Like assets, they split into current liabilities (due within a year — accounts payable, short-term debt, wages payable) and long-term liabilities (bonds, long-term loans). A company drowning in liabilities relative to its assets is fragile, no matter how strong its sales look.
Equity
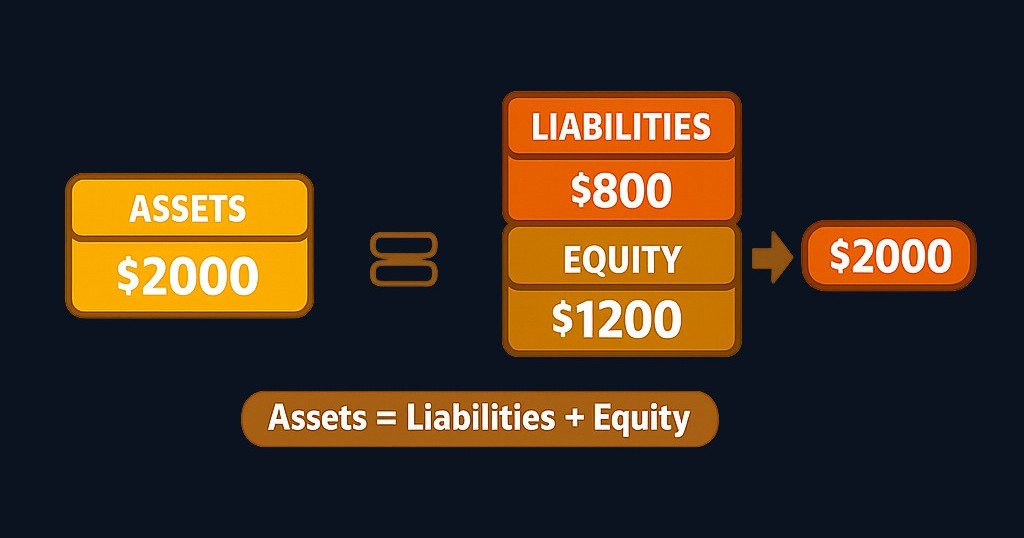
Equity is what's left over once liabilities are subtracted from assets — the owners' actual stake in the business. Balance sheets must always balance, with assets equal to liabilities plus equity. If that identity doesn't hold, something in the statement is wrong or incomplete.
Balance sheets are typically prepared on a set schedule, often once a quarter, which is why comparing several consecutive quarters — not just one — is what actually reveals a trend.
How to Analyze a Balance Sheet
Follow the same steps on any company's balance sheet.
Step 1: Confirm the Equation Holds
Check that assets equal liabilities plus equity. This is the foundation everything else rests on.
Step 2: Check Liquidity
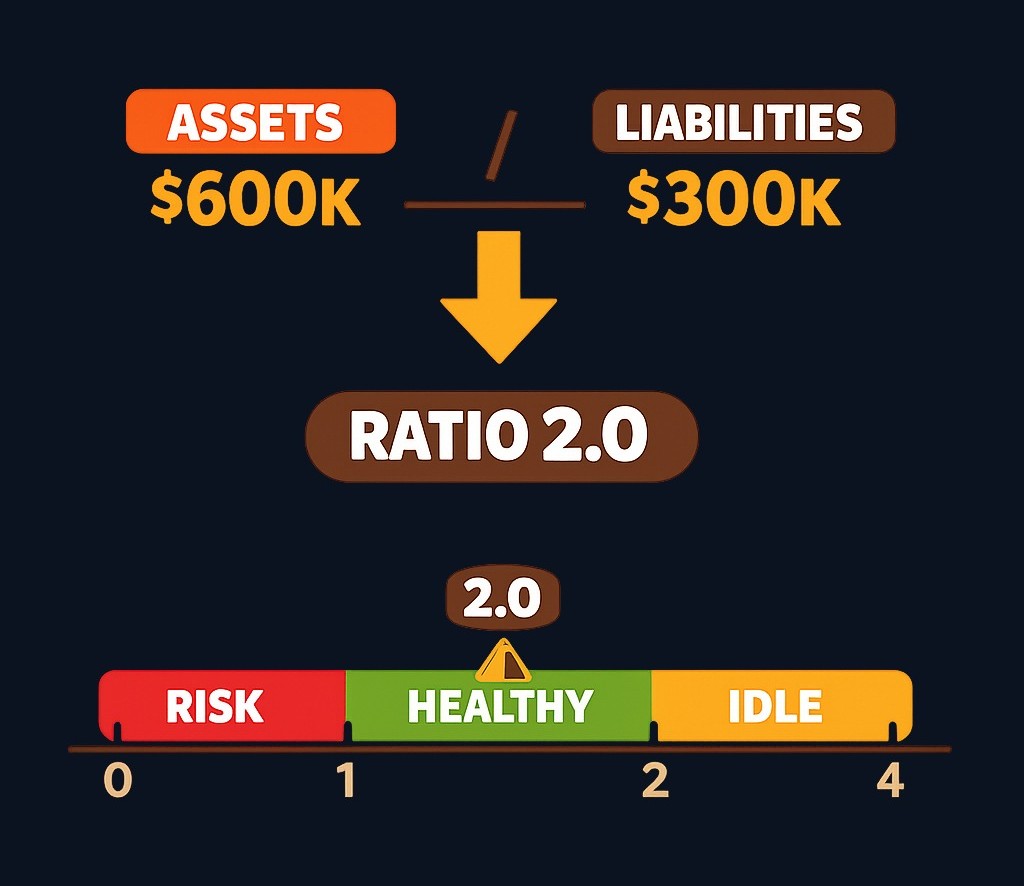
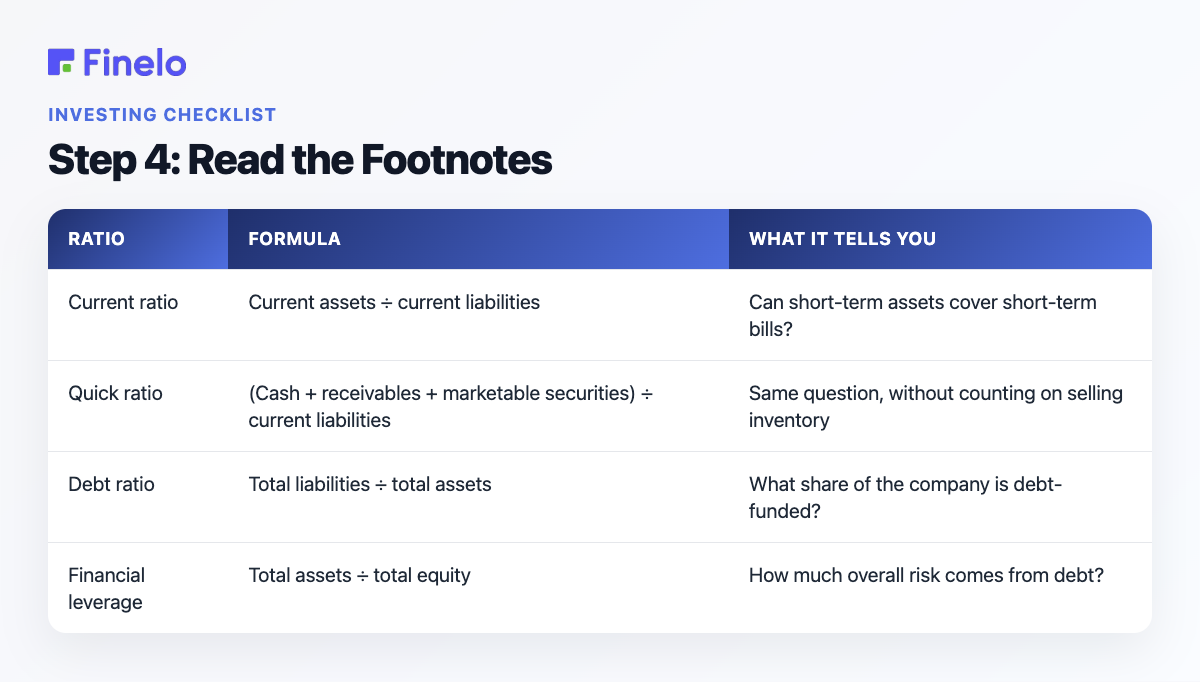
The current ratio — current assets divided by current liabilities — measures whether short-term assets cover short-term obligations. A range of 1.0 to 3.0 is generally read as healthy: below 1.0 means bills exceed short-term resources, and above 3.0 can mean cash sitting idle. The quick ratio is more conservative — it excludes inventory and prepaid expenses, answering a sharper question: could the company pay its bills without selling inventory first?
Step 3: Check Leverage
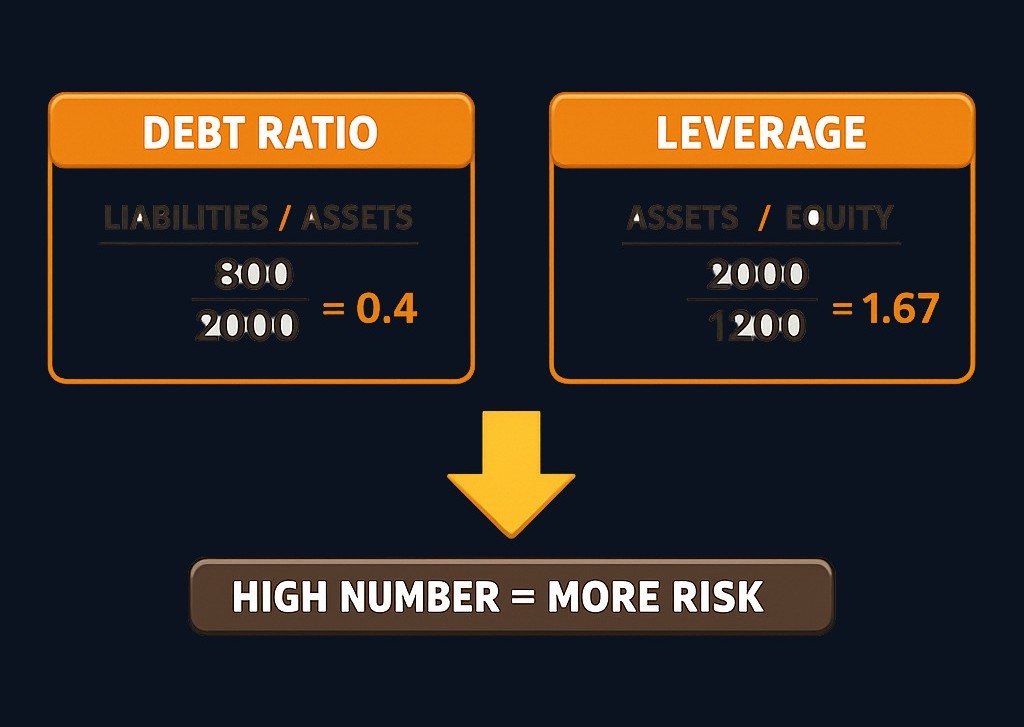
Two ratios show how much of the company runs on debt. The debt ratio (total liabilities divided by total assets) shows what share of the company is financed with debt. Financial leverage (total assets divided by total equity) measures overall financial risk from debt financing. Higher numbers on either mean more debt-funded risk.
Step 4: Read the Footnotes
The notes accompanying a balance sheet disclose accounting policies, tax details, and pension or stock-option obligations that never show up in the summary numbers. Skipping them means missing exactly the disclosures a company is required to make about its own risk.
Quick reference:
| Ratio | Formula | What it tells you |
|---|---|---|
| Current ratio | Current assets ÷ current liabilities | Can short-term assets cover short-term bills? |
| Quick ratio | (Cash + receivables + marketable securities) ÷ current liabilities | Same question, without counting on selling inventory |
| Debt ratio | Total liabilities ÷ total assets | What share of the company is debt-funded? |
| Financial leverage | Total assets ÷ total equity | How much overall risk comes from debt? |
Common Mistakes to Avoid
- Reading one balance sheet in isolation. A balance sheet is a snapshot at a single date. One quarter proves little. Compare several in a row to see a real trend.
- Ignoring the income statement and cash flow statement. A balance sheet shows position, not performance. Pair it with the other statements before judging a company.
- Treating a low current ratio as automatically bad. Some healthy, fast-turnover businesses run lean on purpose. Compare against the company's own history and its closest peers, not a fixed rule.
- Skipping the footnotes. The notes disclose pension, tax, and accounting-policy details that change how a top-line number should be read.
- Assuming more debt is always bad. Debt funds growth for many healthy companies. The question is whether the company can service it, not whether it exists at all.
- Comparing ratios across unrelated industries. A retailer and a software company carry very different normal debt and inventory levels. Compare within the same industry.
- Forgetting the balance sheet is a snapshot, not a forecast. It shows where a company stands today, not where it's headed. Combine it with trend data before drawing conclusions.
Practice investing with Finelo
Build practical investing skills with guided lessons, simulator practice, and structured challenges.
Real-World Case Studies
Two illustrative companies — composites built for this guide, not real firms — show how the same numbers can mean opposite things.
Company A: The Resilient Balance Sheet
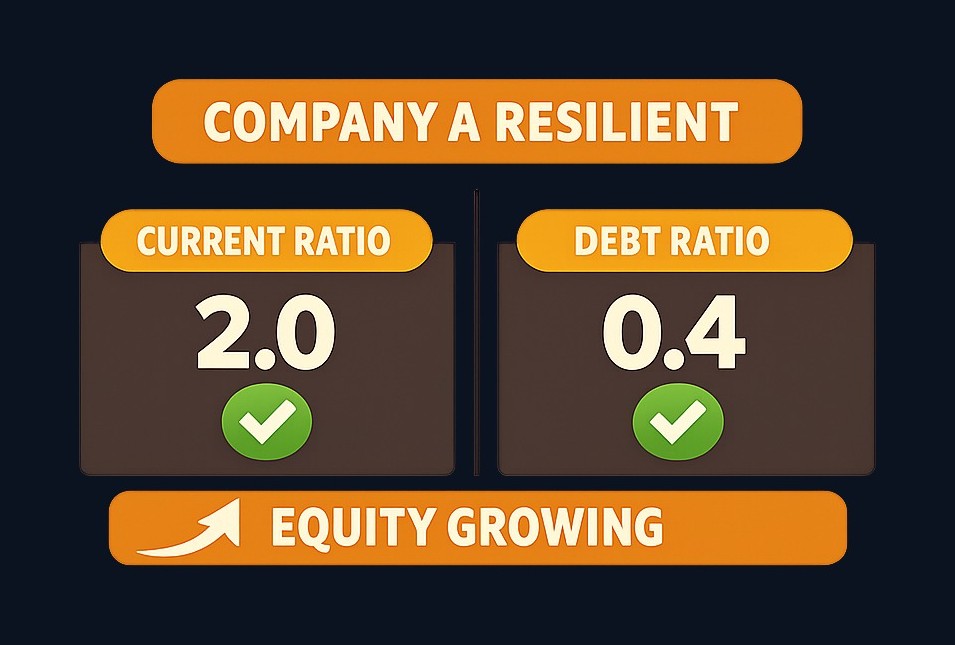
Current assets of $600,000 against current liabilities of $300,000 give a current ratio of 2.0, comfortably inside the healthy range. Total liabilities of $800,000 against total assets of $2,000,000 give a debt ratio of 0.4 — well under half the company is debt-funded. Equity has grown steadily for three straight years. The footnotes disclose only routine lease obligations. Verdict: a financially stable company, funded mainly by its own equity rather than debt.
Company B: The Fragile Balance Sheet
Current assets of $250,000 against current liabilities of $320,000 give a current ratio of 0.78 — short-term obligations already exceed short-term resources. Total liabilities of $1,700,000 against total assets of $2,000,000 give a debt ratio of 0.85 — the vast majority of the company is debt-funded. The footnotes reveal a pension shortfall and a recent covenant renegotiation with lenders. Verdict: a company under real financial strain, where the balance sheet alone — before even reading the footnotes — already signals trouble.
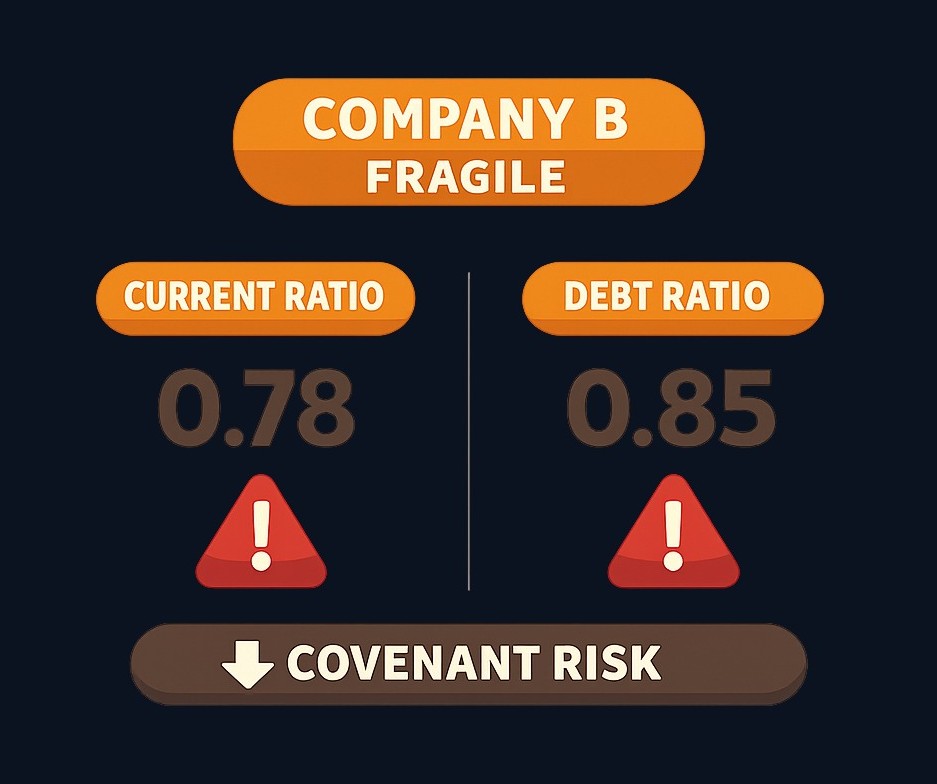
The lesson: identical-looking line items can carry very different meaning once you calculate the ratios and read the footnotes behind them.
Tools and Resources for Balance Sheet Analysis
You don't need paid software to analyze a balance sheet. The free toolkit:
- Your brokerage's research tab. Most mainstream brokerages bundle basic fundamentals and ratio history into the account you already have.
- A simple spreadsheet. The ratios above — current ratio, quick ratio, debt ratio, financial leverage — fit in one spreadsheet with a column per quarter, making a multi-period trend easy to see.
- Company investor relations pages. Annual reports and quarterly filings, published directly by the company, are the primary source for the actual numbers and footnotes.
- A small business accounting tool. If you're building your own balance sheet rather than reading someone else's, standard bookkeeping software will generate one automatically from your existing records.
Conclusion and Next Steps
Reading a balance sheet comes down to a short routine: confirm assets equal liabilities plus equity, check liquidity with the current and quick ratios, check leverage with the debt ratio and financial leverage, and read the footnotes before trusting any of the reported numbers. Compare several quarters, not just one, to separate a real trend from ordinary noise.
Your next step: pull up a company's most recent balance sheet and run it through these four steps yourself. Practice on a company you already understand before applying the same routine to one you're actually evaluating.
This guide is educational, not personalized financial advice. Every ratio and framework here is general, not a guarantee of any outcome — verify current figures and consult a qualified professional before making financial decisions. If you want a structured way to build this kind of analysis skill further, Finelo's Wealth Growth Quiz matches you with a learning path suited to your level.
Frequently asked questions
What is a balance sheet?
A balance sheet is a snapshot of a company's financial position at a specific point in [time](https://www.fidelity.com/learning-center/trading-investing/what-is-a-balance-sheet), showing what it owns, what it owes, and what's left for owners.
What is the balance sheet equation?
Assets equal liabilities plus [equity](https://www.fidelity.com/learning-center/trading-investing/what-is-a-balance-sheet). Every balance sheet is built around this identity — it's the check that confirms the statement is complete and internally consistent.
How often should a balance sheet be prepared?
Companies typically prepare one on a set schedule, often once per [quarter](https://www.fidelity.com/learning-center/trading-investing/what-is-a-balance-sheet). Comparing several consecutive quarters is what reveals a real trend, rather than a single snapshot.
What are common financial ratios derived from a balance sheet?
The most common are the current ratio and quick ratio for [liquidity](https://www.fidelity.com/learning-center/trading-investing/current-ratio), and the debt ratio and financial leverage ratio for how much of the company is [debt-funded](https://www.fidelity.com/learning-center/trading-investing/what-is-a-balance-sheet).
InvestingBeginnerFinancial StatementsMarkets
Practice investing with Finelo
Build practical investing skills with guided lessons, simulator practice, and structured challenges.
About the author
Finelo Team
The Finelo Team creates practical investing and trading education designed to help beginners learn faster with structured challenges, simulator practice, and bite-sized lessons.
Keep reading — Related articles
Investing
Yield to Call vs Yield to Maturity: Assumptions and Bond Risks
Yield to call (YTC) estimates a bond's yield if the issuer redeems it on an eligible call date; yield to maturity (YTM) estimates yield if it remains outstanding to final maturity.
Finelo Team
Investing
Will My Employer Know If I Take a 401(k) Loan?
Who this page is for: readers new to 401(k) loans who want a practical, privacy‑focused explanation — what your employer can see, how to limit visibility, and the financial tradeoffs to weigh.
Finelo Team

Investing
What Medical Expenses Qualify for a 401(k) Hardship Withdrawal?
Before you decide, confirm three things with your plan administrator:
Finelo Team


