To read an income statement, start at revenue, follow the costs and expenses, then look at the final profit or loss. The goal is to see how much money the business brought in, what it spent to earn that money, and whether its core operations are becoming stronger or weaker over time.
How to Read an Income Statement: A Complete Guide
To read an income statement, start at revenue, follow the costs and expenses, then look at the final profit or loss. The goal is to see how much money the business brought in, what it spent to earn that money, and…
10 min read
Practice investing with Finelo
Build practical investing skills with guided lessons, simulator practice, and structured challenges.
Want to learn more?
Build practical investing skills with guided lessons, simulator practice, and structured challenges.
Explore FineloExplore Finelo's 28-day challenges
Turn learning into a daily habit with guided challenge paths.
An income statement is useful because it turns business activity into a simple story: sales came in, costs went out, and the remaining result shows profit or loss for a period. Beginners should not read it as a single number. The real insight comes from the path between the top line and the bottom line.
Income Statements at a Glance
An income statement is a financial report that shows a company's revenue, expenses, and profit or loss over a specific period. You may also see it called a profit and loss statement, P&L, statement of operations, or statement of earnings. Those names can feel different, but they usually point to the same basic idea.
The income statement answers a practical question: did the business earn more than it spent during the period being reported? It does not show every part of financial health. It does not show all assets, debts, or cash movement. But it does show whether sales are turning into profit, where major costs sit, and how much room the business has after expenses.
For a beginner, the easiest way to read one is from top to bottom. Each line explains what happened before the next line appears. Revenue starts the story. Costs and expenses explain the pressure on that revenue. Net income gives the final result.
Key Components of an Income Statement
Most income statements follow a simple flow, even when the labels differ by company or industry.
| Line item | Plain-English meaning | What to ask |
|---|---|---|
| Revenue | Money earned from selling goods or services | Is sales activity growing, flat, or shrinking? |
| Cost of goods sold | Direct costs tied to producing or delivering what was sold | Is it costing more to produce each sale? |
| Gross profit | Revenue left after direct costs | Does the business have enough margin before overhead? |
| Operating expenses | Costs needed to run the business | Are overhead costs controlled or rising too quickly? |
| Operating income | Profit from core business operations | Is the main business working before financing and taxes? |
| Other income or expense | Items outside normal operations | Is profit being helped or hurt by unusual items? |
| Taxes | Tax expense for the period | How much profit remains after taxes? |
| Net income | Final profit or loss | Is the business profitable after all expenses? |
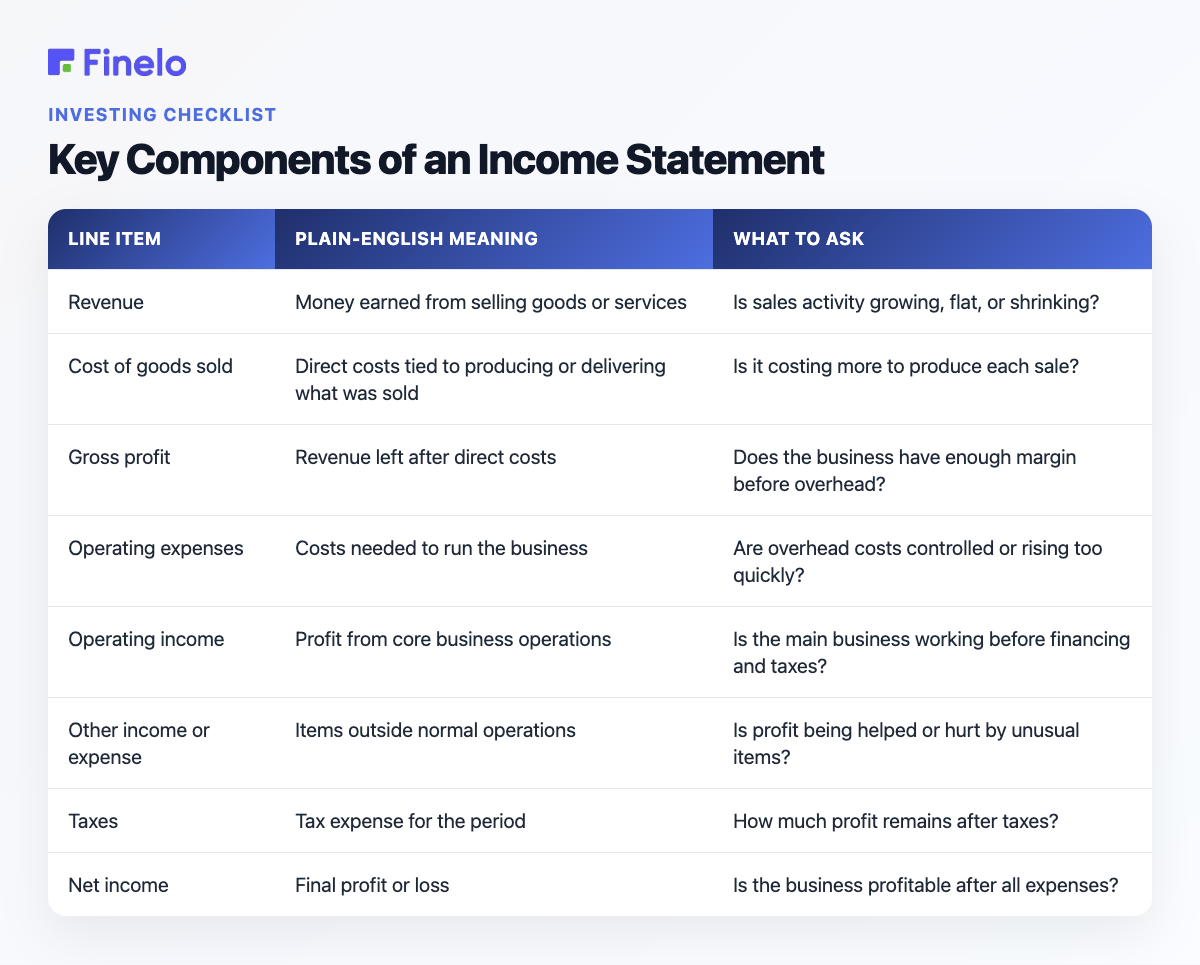
Revenue is often called the top line because it appears near the top. Net income is often called the bottom line because it appears near the bottom. A company can have rising revenue and still have weak net income if costs rise faster than sales.
Gross profit is one of the most useful early checkpoints. Imagine a small product business with sales of 100 and direct product costs of 60. Its gross profit is 40. That does not mean the owner keeps 40. Rent, salaries, software, marketing, interest, and taxes may still come later. Gross profit only shows what remains after the direct cost of the product or service.

Operating income comes after operating expenses. It is useful because it focuses on the core business before some outside factors. If operating income is improving, the basic business model may be getting stronger. If operating income is weakening while revenue grows, the business may be buying growth at a high cost.
Net income is the final result, but it should not be the only number you read. A healthy-looking bottom line can be helped by a one-time gain. A weak bottom line can be hurt by a temporary expense. Always ask what drove the result.
Single-Step vs. Multi-Step Income Statements
Income statements commonly appear in two formats: single-step and multi-step. Both can reach the same final net income. The difference is how much detail they show along the way.
A single-step income statement groups revenue together, groups expenses together, and subtracts total expenses from total revenue. It is simple and fast to read.
Sample single-step format:
| Category | Sample amount |
|---|---|
| Revenue | 100 |
| Other income | 5 |
| Total income | 105 |
| Expenses | 80 |
| Net income | 25 |
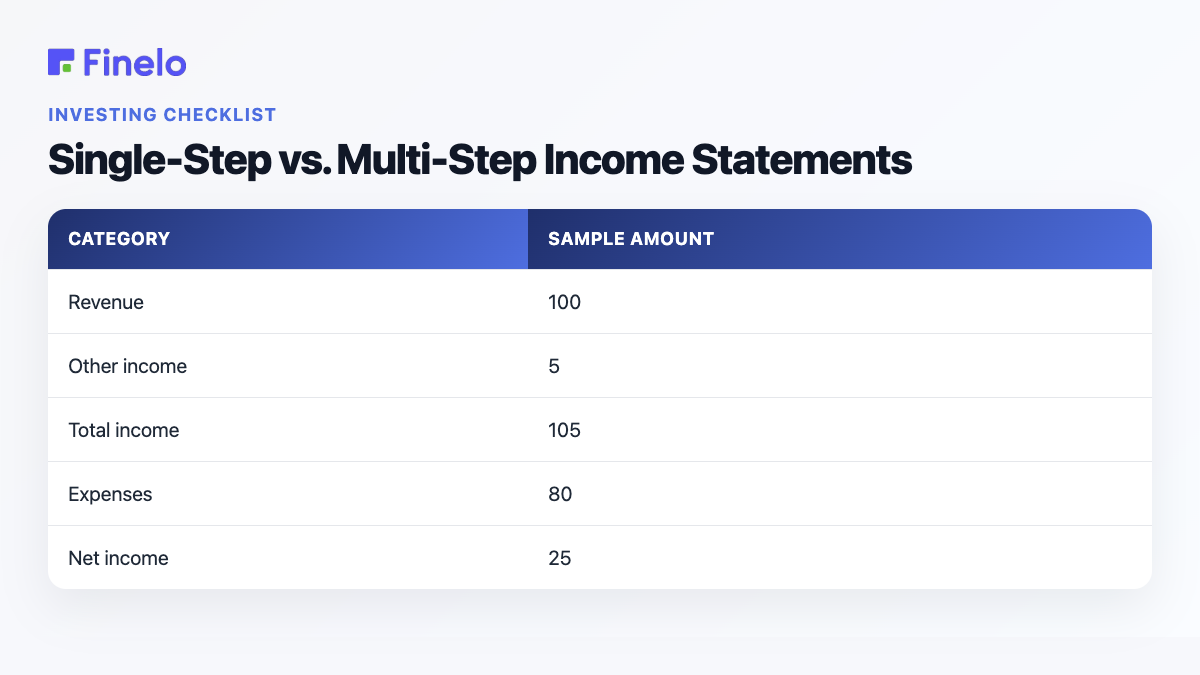
This format works well when you want a quick view. The drawback is that it hides some important layers. You can see the final profit, but you cannot easily tell how much profit came from the core business versus other sources.
A multi-step income statement breaks the business into stages. It usually shows gross profit, operating income, and net income separately. That makes it easier to see where the business is strong or weak.
Sample multi-step format:
| Category | Sample amount |
|---|---|
| Revenue | 100 |
| Cost of goods sold | 60 |
| Gross profit | 40 |
| Operating expenses | 20 |
| Operating income | 20 |
| Other income | 5 |
| Taxes and other costs | 0 |
| Net income | 25 |
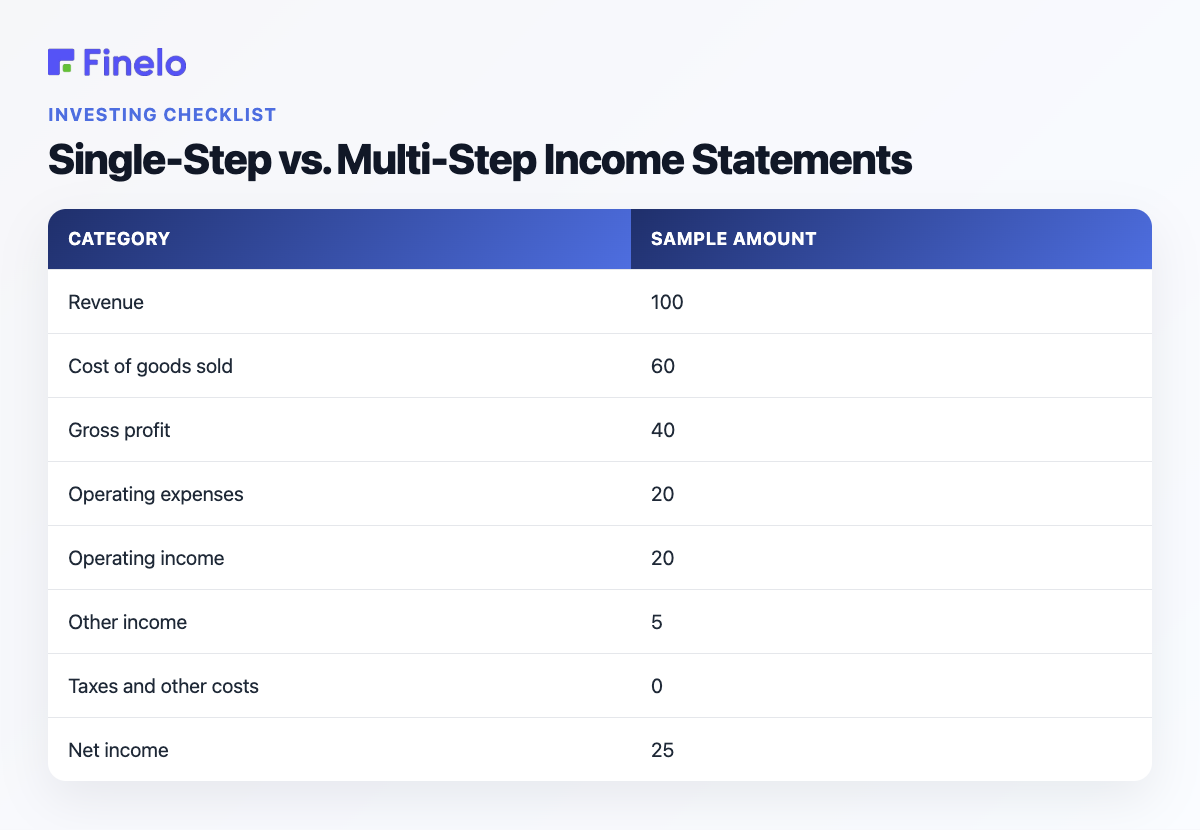
Notice that both examples end with net income of 25. But the multi-step version tells a richer story. It shows that the business had gross profit of 40, operating income of 20, and an extra 5 from outside the main operating result.
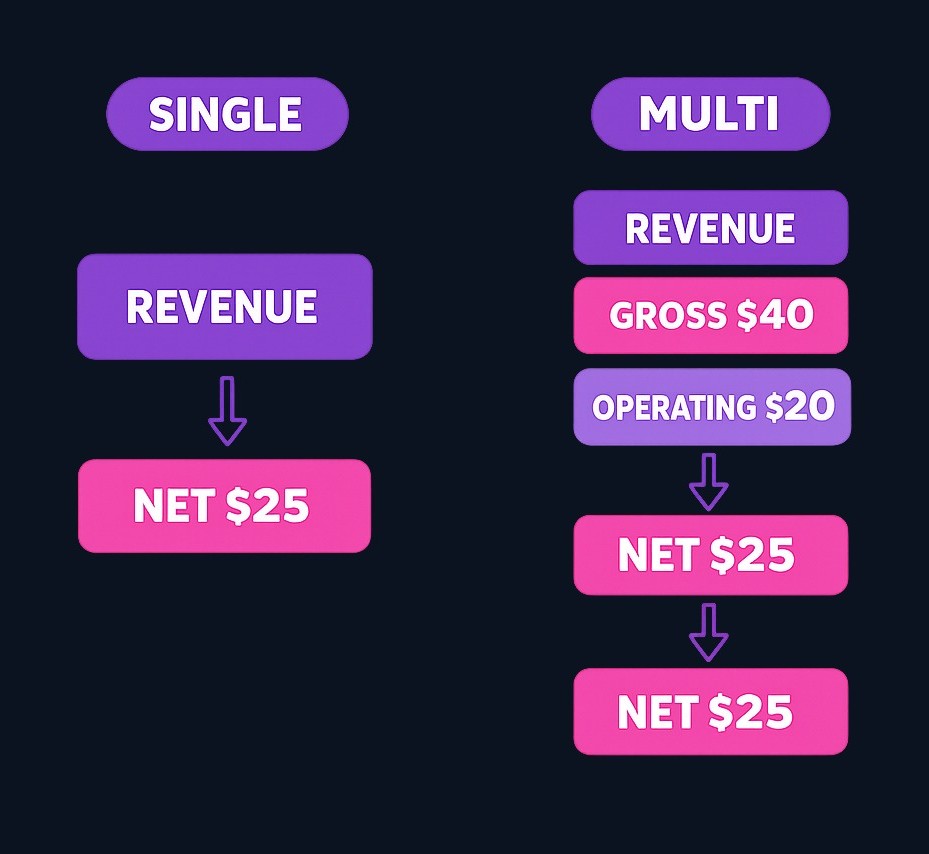
That detail matters. Suppose two businesses both report net income of 25. One earned it mostly from normal operations. The other earned it because of a one-time gain. The second company may look just as profitable at first glance, but the quality of the result is different.
Here is a simple comparison:
| Question | Single-step format | Multi-step format |
|---|---|---|
| Is it easy to read quickly? | Yes | Usually, but it has more layers |
| Does it show gross profit? | Often no | Yes |
| Does it separate operating results? | Usually limited | Yes |
| Is it useful for deeper analysis? | Basic | Stronger |
| Best beginner use | Quick profit check | Understanding how profit is built |
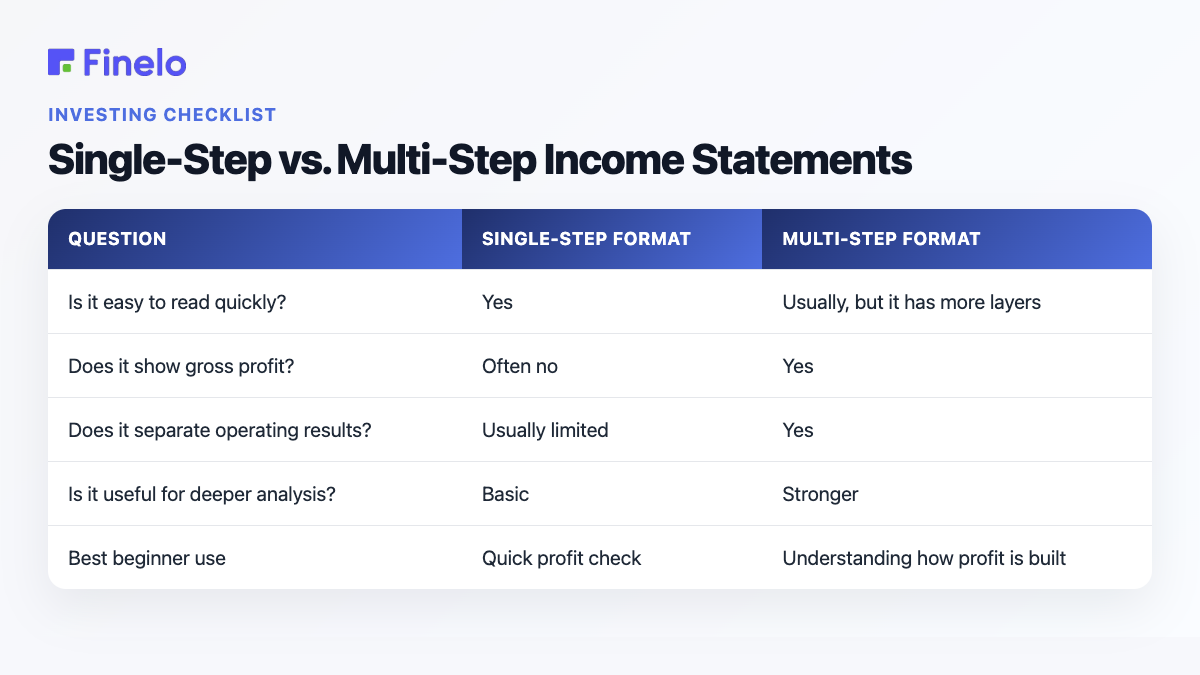
If you are new, learn both. Use the single-step format to understand the big idea. Use the multi-step format when you want to understand the engine behind the result.
How to Analyze an Income Statement
Reading an income statement is step one. Analyzing it means asking whether the numbers are improving, deteriorating, or changing in a way that needs explanation.
Start with vertical analysis. Vertical analysis means looking at each line as a share of revenue. If revenue is 100 and operating expenses are 25, operating expenses are 25% of revenue in that sample. This helps you compare businesses of different sizes or compare the same business across time.
Then use horizontal analysis. Horizontal analysis means comparing one period with another. You might compare this quarter with the prior quarter, or this year with last year. The key question is not only "did revenue rise?" but "did revenue rise faster than costs?"
Here is a beginner-friendly process:
- Check revenue direction. Is the top line rising, falling, or flat?
- Compare direct costs with revenue. Are costs growing faster than sales?
- Review gross profit. Is the business keeping enough after direct costs?
- Review operating expenses. Are overhead costs reasonable for the revenue level?
- Look at operating income. Is the core business profitable?
- Separate unusual items. Did one-time income or expense affect the result?
- Review net income. Is the final result consistent with the rest of the statement?
Now imagine a company with revenue rising from 100 to 120. At first, that looks positive. But if direct costs rise from 60 to 85, gross profit rises only from 40 to 35 in margin terms. The company sold more, but each sale became less profitable. That is the kind of insight an income statement can reveal.
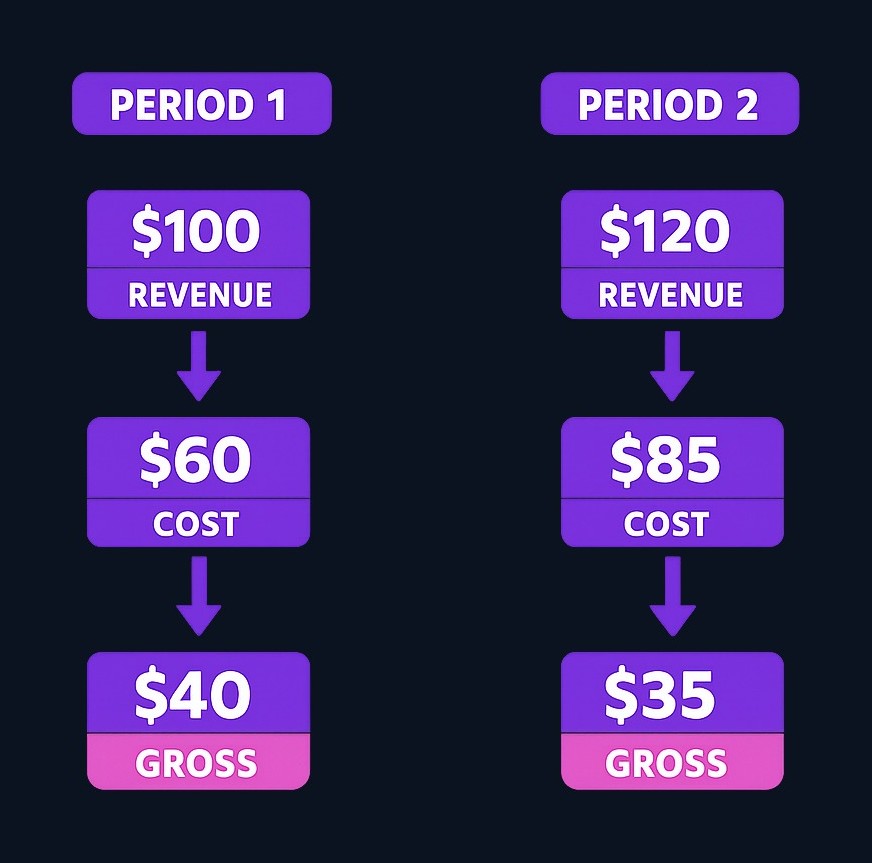
Margins help here. A margin shows a profit line as a percentage of revenue. Gross margin looks at gross profit divided by revenue. Operating margin looks at operating income divided by revenue. Net margin looks at net income divided by revenue. You do not need complicated math to start. You only need the habit of asking how much of each revenue dollar remains at each stage.
Also compare the income statement with the business model. A software company, a grocery store, and a construction firm can have very different cost structures. A "good" margin in one industry may be ordinary or weak in another. Beginners should avoid judging every company by the same yardstick.
Practice investing with Finelo
Build practical investing skills with guided lessons, simulator practice, and structured challenges.
Common Mistakes to Avoid
The most common mistake is reading only net income. Net income matters, but it is the end of the story, not the whole story. If you skip the lines above it, you miss how the result was created.
Another mistake is assuming revenue growth always means improvement. Growth can be valuable, but only if the business can turn that growth into healthy economics. If revenue rises while gross profit, operating income, or net income weakens, the business may need closer attention.
A third mistake is ignoring one-time items. Some income statements include unusual gains, restructuring costs, legal costs, asset sales, or other items that may not repeat. Those lines can distort the period. The beginner-friendly fix is to ask: would the result look similar without this item?
A fourth mistake is confusing profit with cash. The income statement shows profitability under accounting rules. It does not always show when cash entered or left the business. A company can report profit and still face cash pressure. That is why income statements work best when read alongside the balance sheet and cash flow statement.
A fifth mistake is treating expenses as automatically bad. Some expenses support future growth. Hiring, marketing, product development, and technology can be productive if they lead to stronger results later. The question is not "are expenses rising?" The better question is "are expenses rising for a reason, and is the business getting enough benefit?"
A sixth mistake is comparing companies without context. If one company sells physical products and another sells digital services, their direct costs may look very different. If one company is young and another is mature, their spending patterns may also differ. Analysis improves when you compare like with like.
Finally, avoid turning one income statement into a complete conclusion. One period can show a clue. Several periods show a pattern. If you want to understand a business, compare trends and ask what changed.
Real-World Style Case Studies
Consider a local retailer. Its revenue rises because it opens a new location. At first, the income statement looks encouraging. More sales are coming in. But operating expenses also rise because the business now pays more rent, wages, utilities, and local marketing. If operating income barely improves, the new location may be adding activity without adding much profit. The lesson: growth needs to be judged after the costs required to create it.
Now consider a subscription software business. Revenue is flat for a period, which may look disappointing. But support costs fall, marketing becomes more efficient, and operating expenses are better controlled. Operating income improves even without revenue growth. The lesson: a business can become stronger by managing costs and improving efficiency, not only by selling more.
Finally, imagine a manufacturer. Revenue is stable, but cost of goods sold rises because materials become more expensive. Gross profit falls. Management raises prices later, but customers respond slowly. The income statement shows pressure before the final bottom line fully explains it. The lesson: the middle of the statement often reveals problems earlier than net income alone.
These examples are simplified, but they mirror the way income statements help readers ask better questions. The point is not to make a buy or sell decision from one report. The point is to understand what kind of business story the numbers are telling.
How the Income Statement Connects to Other Reports
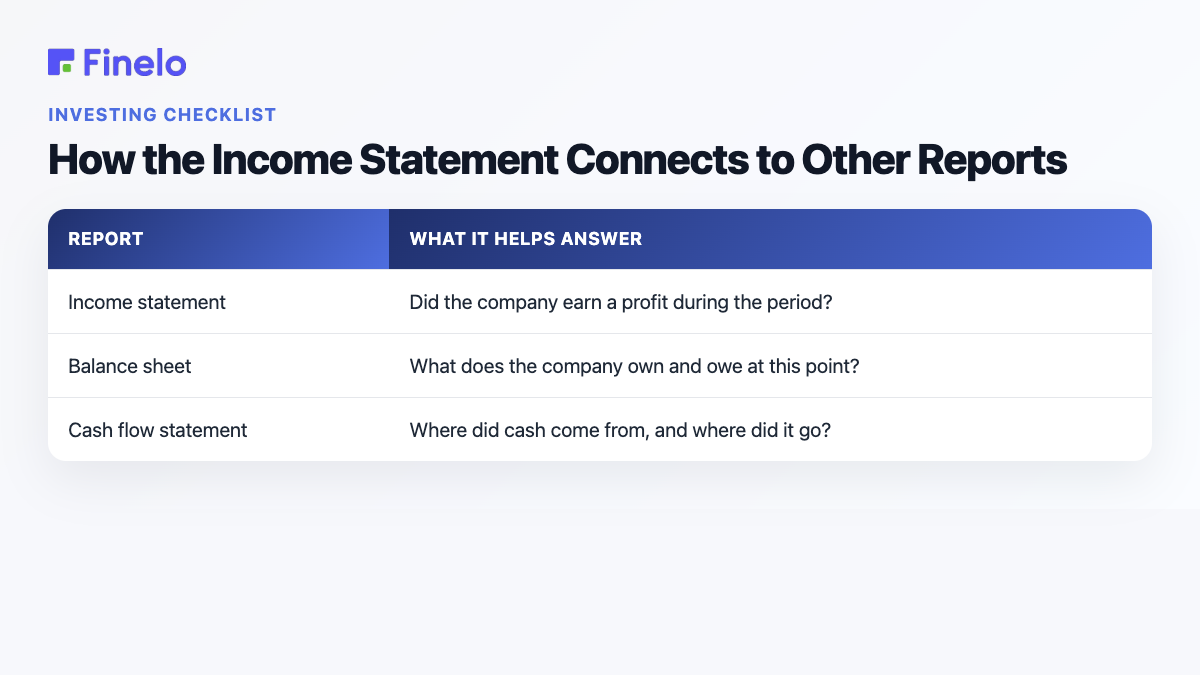
The income statement is powerful, but it is not meant to stand alone. It works with two other major reports: the balance sheet and the cash flow statement.
The balance sheet shows what a company owns and owes at a point in time. It helps you understand assets, liabilities, and equity. If the income statement shows profit, the balance sheet can help you see whether the company is also carrying heavy debt or building financial strength.
The cash flow statement shows how cash moved through the business. This matters because accounting profit and cash movement are not always identical. A company may record revenue before collecting cash, or record expenses before cash leaves. The cash flow statement helps answer whether the business is turning reported profit into actual cash.
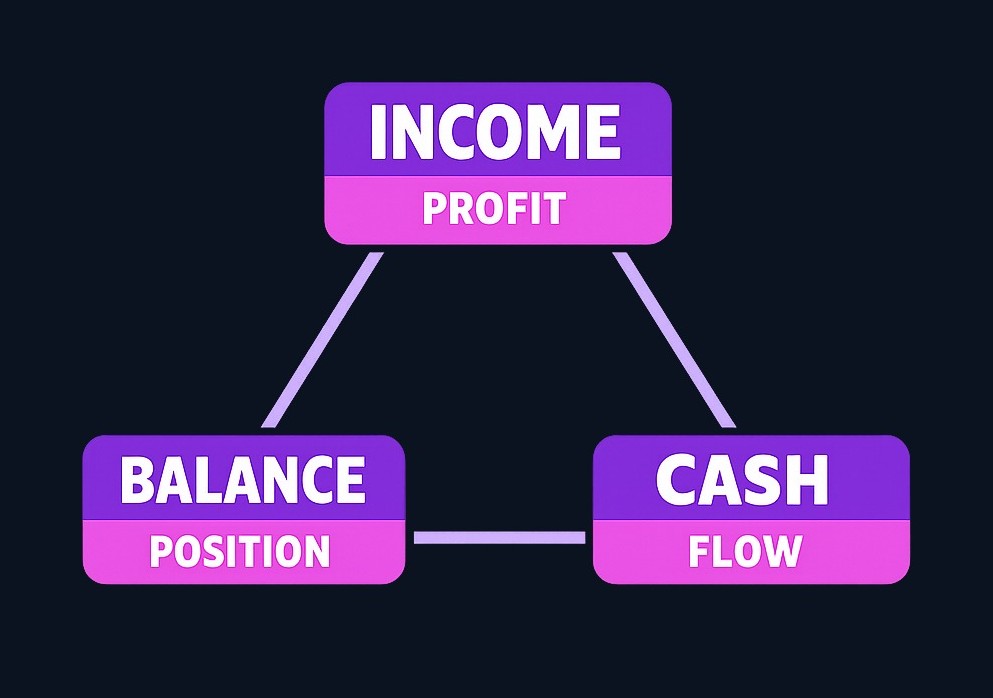
Think of the three reports this way:
| Report | What it helps answer |
|---|---|
| Income statement | Did the company earn a profit during the period? |
| Balance sheet | What does the company own and owe at this point? |
| Cash flow statement | Where did cash come from, and where did it go? |
For beginners, this is enough. Read the income statement first to understand profitability. Then use the other reports to check whether the profit story is supported by financial position and cash movement.
Conclusion and Next Steps
To read an income statement well, follow the flow: revenue, costs, expenses, operating income, and net income. Then compare the same lines over time. Do not stop at the bottom line. The real value is learning how the result was built.
Your next step is to practice with a simple worksheet. Take a sample business, list revenue, subtract direct costs, subtract operating expenses, and explain what changed. If you want structured market education before making real decisions, Finelo offers interactive lessons, quizzes, and simulations through its learning platform. Keep the goal educational: learn the statement, ask better questions, and avoid treating any single report as a complete financial decision.
Frequently asked questions
What is an income statement?
An income statement is a financial report that shows revenue, expenses, and profit or loss over a period. It helps readers understand whether a business earned more than it spent.
How do you read an income statement?
Read it from top to bottom. Start with revenue, subtract direct costs, review operating expenses, check operating income, then look at net income. After that, compare the same lines across multiple periods.
What are the main sections of an income statement?
The main sections are revenue, cost of goods sold, gross profit, operating expenses, operating income, other income or expenses, taxes, and net income. Some statements use fewer lines, while others show more detail.
How is an income statement different from a balance sheet?
An income statement covers business performance over a period. A balance sheet shows what the company owns and owes at a point in time. One explains profitability; the other explains financial position.
InvestingBeginnerFinancial StatementsMarkets
Practice investing with Finelo
Build practical investing skills with guided lessons, simulator practice, and structured challenges.
About the author
Finelo Team
The Finelo Team creates practical investing and trading education designed to help beginners learn faster with structured challenges, simulator practice, and bite-sized lessons.
Keep reading — Related articles

Investing
Yield to Call vs Yield to Maturity: Assumptions and Bond Risks
Yield to call (YTC) estimates a bond's yield if the issuer redeems it on an eligible call date; yield to maturity (YTM) estimates yield if it remains outstanding to final maturity.
Finelo Team

Investing
Will My Employer Know If I Take a 401(k) Loan?
Who this page is for: readers new to 401(k) loans who want a practical, privacy‑focused explanation — what your employer can see, how to limit visibility, and the financial tradeoffs to weigh.
Finelo Team

Investing
What Medical Expenses Qualify for a 401(k) Hardship Withdrawal?
Before you decide, confirm three things with your plan administrator:
Finelo Team


