Methodology note: Inventory turnover is COGS divided by average inventory for the same period. Beginning-and-ending average inventory is only an approximation; seasonal or fast-changing businesses may require monthly or quarterly averages. Do not use unsourced cross-industry ranges as “good” benchmarks—compare identical definitions with close peers and like periods.
Inventory Turnover Ratio: Formula, Interpretation, and Limitations
The inventory turnover ratio measures how many times a company sells and replaces its inventory over a period, calculated as cost of goods sold divided by average inventory. A ratio of 8 means the company cycled through…
7 min read
Practice investing with Finelo
Build practical investing skills with guided lessons, simulator practice, and structured challenges.
Want to learn more?
Build practical investing skills with guided lessons, simulator practice, and structured challenges.
Explore FineloExplore Finelo's 28-day challenges
Turn learning into a daily habit with guided challenge paths.
The inventory turnover ratio measures how many times a company sells and replaces its inventory over a period, calculated as cost of goods sold divided by average inventory. A ratio of 8 means the company cycled through its stock roughly eight times in a year, or about every 46 days. Investors use it to judge how efficiently a business converts shelved goods into sales; operators use it to spot bloated stockrooms before they become write-offs. This page is for investors and business-curious readers who want the formula, honest benchmarks by industry, and the traps that make the ratio lie. Read the worked example below, then apply it to one retailer you follow.
What the inventory turnover ratio tells you
Inventory is money sitting on a shelf. Until it sells, it ties up cash, occupies warehouse space, risks obsolescence, and quietly accrues carrying costs. The turnover ratio measures how quickly that frozen cash thaws back into revenue.
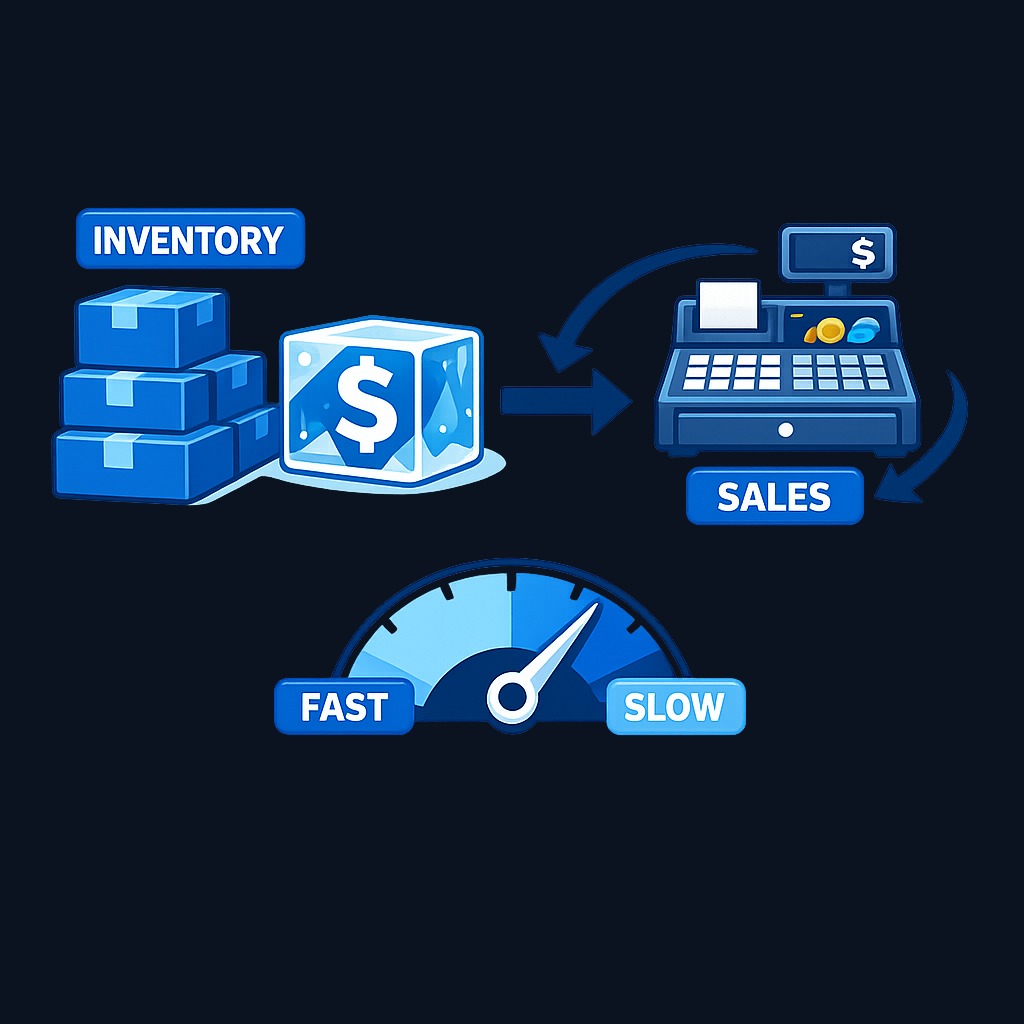
A high ratio generally signals strong demand, disciplined purchasing, or deliberately lean stocking. A low ratio suggests overbuying, fading demand, or product lines aging toward markdown. Neither reading is automatic, which is why the number needs industry context and a trend line before it means anything. The ratio also converts neatly into days: divide 365 by the turnover figure to get days inventory outstanding, the average shelf life of a dollar of stock.
How to calculate inventory turnover
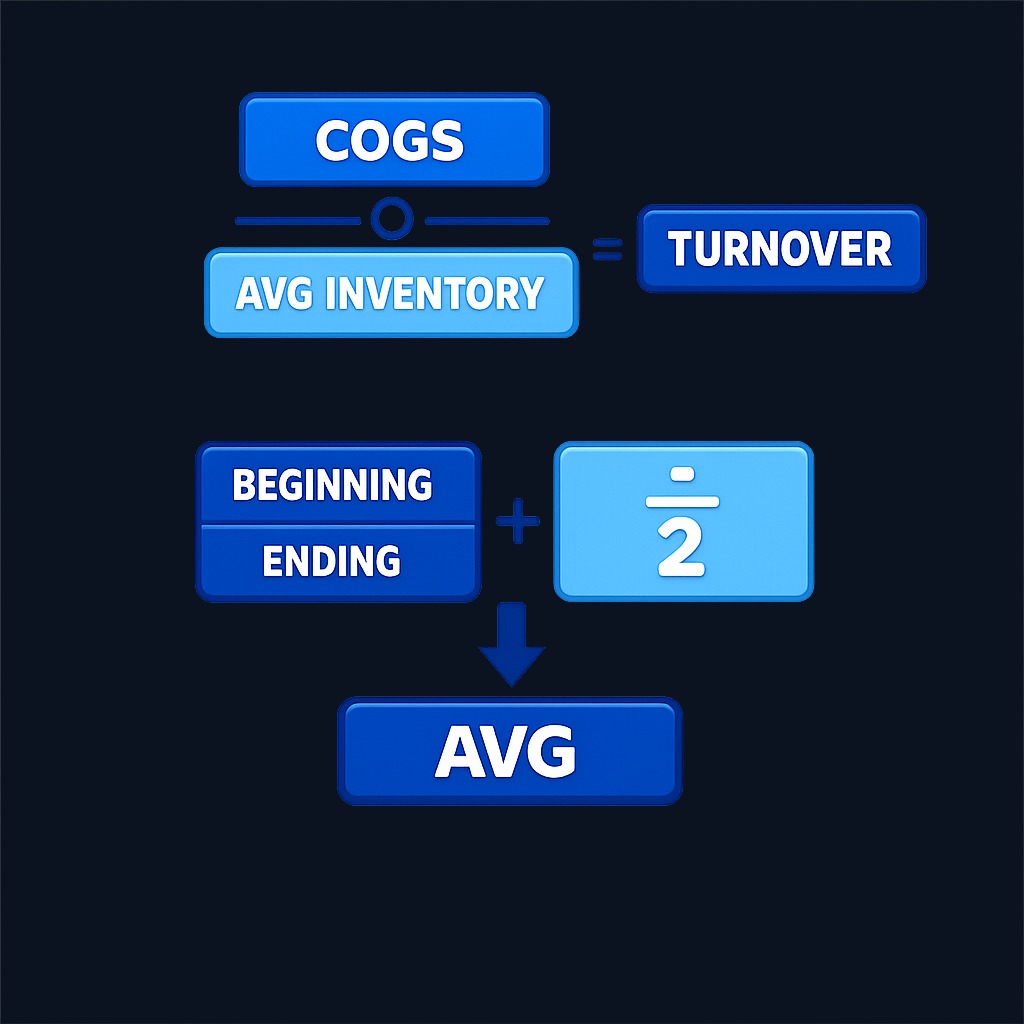
Inventory turnover = cost of goods sold ÷ average inventory
Average inventory = (beginning inventory + ending inventory) ÷ 2
Use cost of goods sold rather than revenue, because inventory is carried at cost; mixing a cost-based denominator with a price-based numerator inflates the ratio with markup. Both inputs come from public filings: COGS from the income statement, inventory from the balance sheet. You can pull either from a company's annual report in the SEC's EDGAR database.
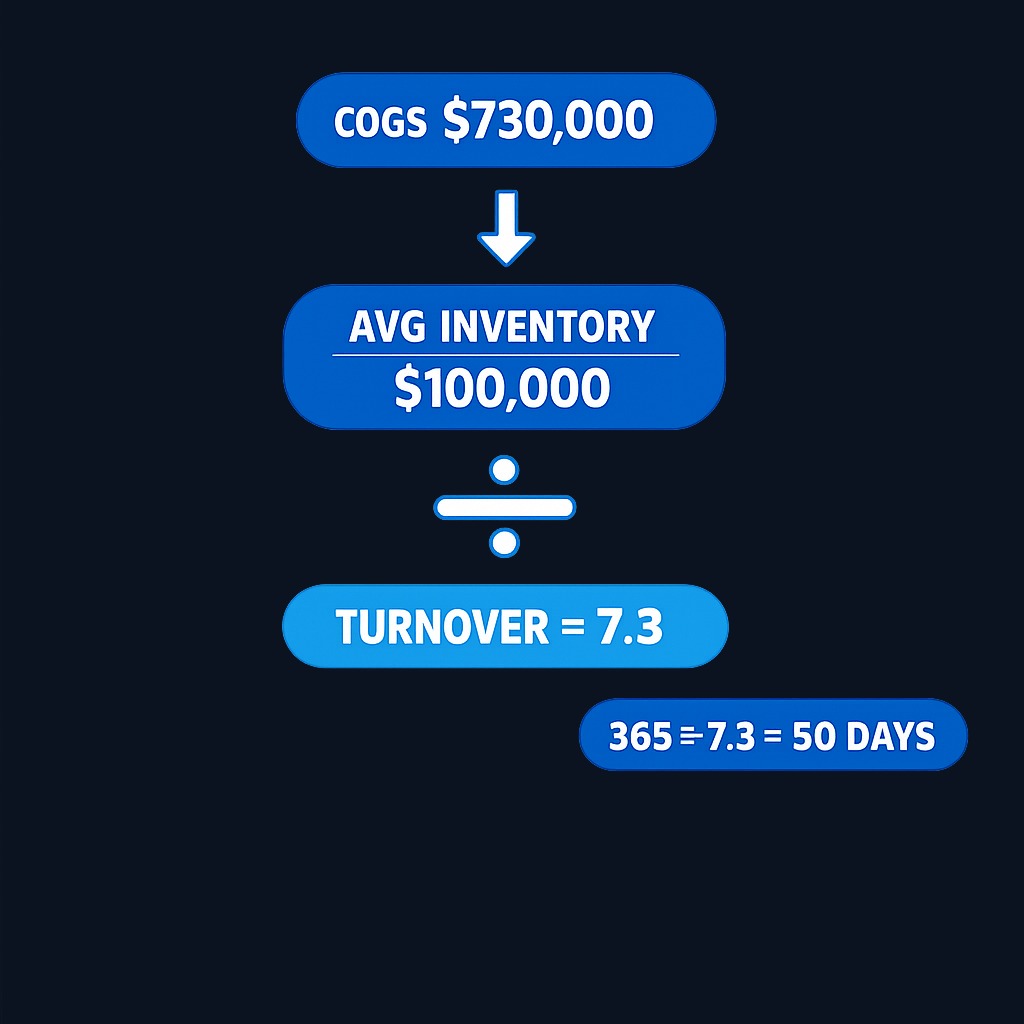
A worked example:
| Line item | Amount |
|---|---|
| Cost of goods sold (year) | $730 million |
| Inventory, start of year | $95 million |
| Inventory, end of year | $105 million |
| Average inventory | $100 million |
| Inventory turnover | 7.3× |
| Days inventory outstanding | 365 ÷ 7.3 = 50 days |
The company turns its stock 7.3 times a year, holding the average item for 50 days. Averaging beginning and ending inventory smooths seasonal distortion, though for highly seasonal retailers a quarterly average is more honest than a two-point one.
What is a good inventory turnover ratio?
There is no universal range by sector. Select close peers with similar products, geography, channel, and accounting; calculate turnover from the same periods and inventory averaging method; then read it with gross margin, write-downs, stockouts, revenue growth, and purchasing commentary. A falling ratio can signal weaker demand or planned inventory investment, while a rising ratio can reflect better sell-through, discounting, or understocking.

Factors that move the ratio
- Demand strength. Hot products leave shelves fast; stale assortments linger.
- Purchasing discipline. Bulk discounts tempt managers into overbuying, trading a lower unit cost for slower turns.
- Product mix. Perishables force high turnover; durable and luxury goods naturally turn slowly.
- Seasonality. Holiday build-ups depress the ratio temporarily; measuring across a full cycle corrects it.
- Supply chain strategy. Just-in-time systems raise turnover but increase vulnerability to disruption; safety stock does the reverse.
- Pricing and promotion. Markdowns accelerate turns at the expense of margin, which is why turnover should be read next to gross margin, never alone.
How companies improve inventory turnover
Operators attack the ratio from both ends. On the demand side: sharper forecasting, faster markdown cadence for slow movers, and assortments rebalanced toward proven sellers. On the supply side: smaller and more frequent orders, better supplier lead times, and SKU rationalization that cuts the long tail of rarely sold items. The elegant improvements raise turnover while holding margin steady. The crude ones, panic discounting or refusing to stock enough to meet demand, technically raise the ratio while damaging the business. When analyzing a company, ask which kind of improvement you are looking at; stockouts dressed up as efficiency show up later as lost customers.
Practice investing with Finelo
Build practical investing skills with guided lessons, simulator practice, and structured challenges.
Common mistakes when calculating or reading the ratio
- Using revenue instead of COGS. Markup inflates the ratio and breaks comparability between companies with different pricing power.
- Using ending inventory alone. A single snapshot date, especially fiscal year end after holiday selldown, can flatter the number badly.
- Ignoring accounting method. FIFO and LIFO firms report different inventory values in inflationary periods, so cross-company comparisons need a footnote check.
- Reading high as automatically good. Turnover achieved through chronic understocking sacrifices sales; the ratio cannot see the customers who left empty-handed.
- Skipping the trend. One period tells you a level; three to five periods tell you a story.
What to know before deciding
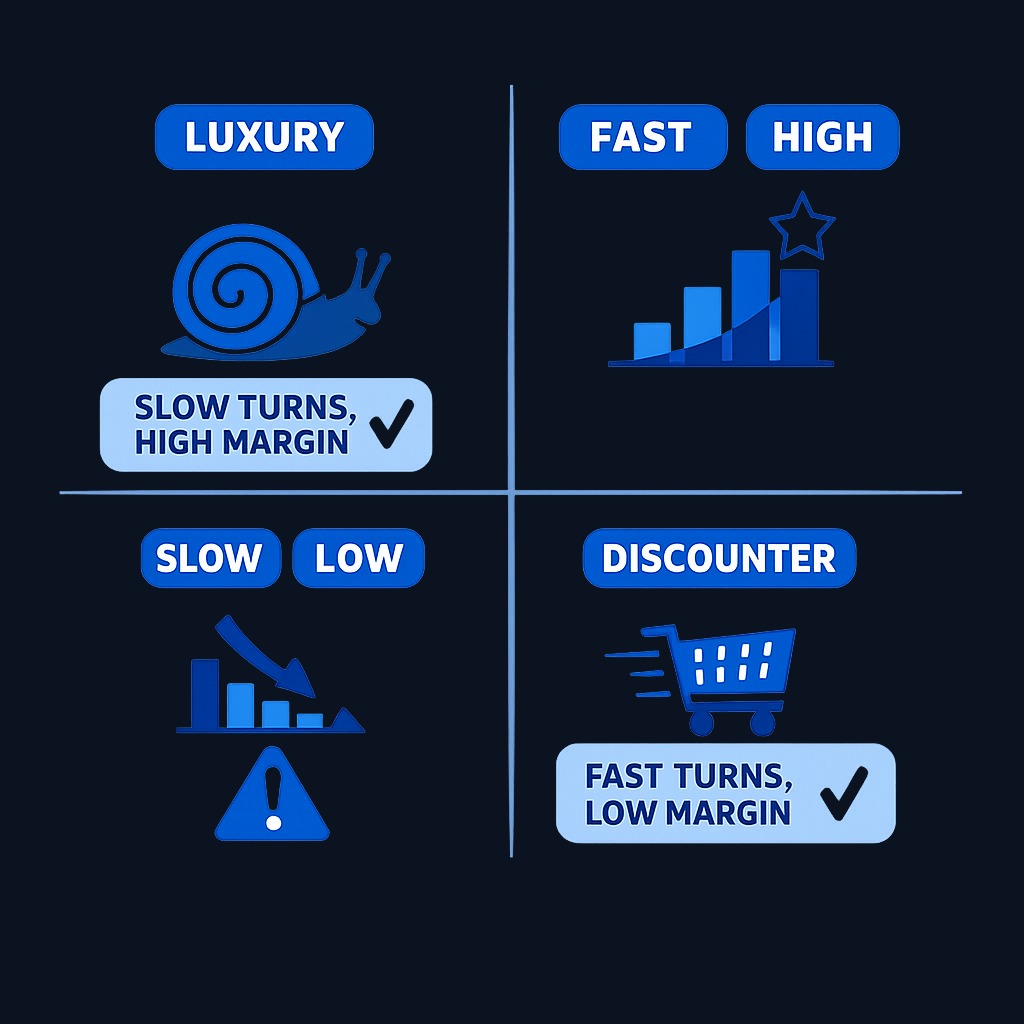
For investors, inventory turnover is a quality lens rather than a buy signal. It pairs naturally with gross margin, because the margin-versus-turns tradeoff defines most retail business models: luxury runs slow turns at fat margins, discounters run fast turns at thin ones. Both can work; trouble appears when a company drifts toward slow turns and thin margins simultaneously. Check the footnotes for inventory write-downs, which are management's admission that past purchasing outran demand. And for any company where inventory is a major asset, watch the ratio quarterly; deterioration there often precedes earnings disappointments by several quarters.
Decision framework: applying the ratio
| Your goal | How to use inventory turnover |
|---|---|
| Screening retailers or manufacturers | Compare turnover against direct peers over 3+ years |
| Spotting early trouble | Watch for falling turnover paired with rising inventory balances |
| Judging a business model | Read turnover together with gross margin to see the model's logic |
| Analyzing a turnaround story | Look for turns recovering without margin collapse |
FAQ
What does an inventory turnover ratio of 5 mean?
The company sold and replaced its full inventory about five times during the period, holding the average item roughly 73 days. Whether that is healthy depends entirely on the industry.
Is a higher inventory turnover ratio always better?
No. Very high turnover can indicate understocking, which loses sales, or heavy discounting, which destroys margin. The best reading is a stable, industry-appropriate ratio alongside steady gross margins.
Why use cost of goods sold instead of sales in the formula?
Inventory sits on the balance sheet at cost. Dividing a price-based sales figure by a cost-based inventory figure adds markup to the numerator and overstates true physical turnover.
How often should inventory turnover be measured?
Public-company investors typically track it quarterly and annually. Operators watch it monthly, and fast-moving retailers monitor category-level turns weekly.
Conclusion and next steps
The inventory turnover ratio compresses a company's demand, purchasing discipline, and product freshness into one number: how fast stock becomes sales. Compute it with COGS over average inventory, convert it to days for intuition, benchmark it inside the industry, and read it beside gross margin and the inventory line's own growth. Used that way, it flags both efficient compounders and slow-motion markdown disasters early. Next step: pull the last three annual filings of a retailer you know from EDGAR, compute the ratio for each year, and explain the trend in one sentence. If you can do that, you understand the metric.
InvestingFundamental AnalysisFinancial StatementsBeginner
Practice investing with Finelo
Build practical investing skills with guided lessons, simulator practice, and structured challenges.
About the author
Finelo Team
The Finelo Team creates practical investing and trading education designed to help beginners learn faster with structured challenges, simulator practice, and bite-sized lessons.
Keep reading — Related articles

Investing
Tax-gain harvesting vs. tax-loss harvesting
Compare realizing investment gains with realizing losses, including holding periods, wash sales, offsets, and portfolio tradeoffs.
Finelo Team

Investing
Stable value fund vs. money market fund
Compare investment structure, contract protections, transfer restrictions, net yields, and access inside a retirement account.
Finelo Team

Investing
Single-life vs. joint-life annuity
Compare income for one lifetime with continued payments to a survivor, using equal premiums and matching guarantee terms.
Finelo Team


