Methodology note: CAGR is valid for one beginning value and one ending value with no intervening external cash flows. IRR solves for a periodic rate from equally spaced cash flows; spreadsheet IRR assumes equal spacing, while XIRR uses actual dates. For accounts with contributions or withdrawals, do not compute a naive CAGR from total contributions and ending value. State the dates, sign convention, and annualization method.
IRR vs CAGR: A Comprehensive Comparison for Investors

The short answer: CAGR (compound annual growth rate) measures the smoothed yearly growth of a single investment from a starting value to an ending value, while IRR (internal rate of return) measures the annualized return…
8 min read
Practice investing with Finelo
Build practical investing skills with guided lessons, simulator practice, and structured challenges.
Want to learn more?
Build practical investing skills with guided lessons, simulator practice, and structured challenges.
Explore FineloExplore Finelo's 28-day challenges
Turn learning into a daily habit with guided challenge paths.
The short answer: CAGR (compound annual growth rate) measures the smoothed yearly growth of a single investment from a starting value to an ending value, while IRR (internal rate of return) measures the annualized return of a series of cash flows, accounting for when every deposit and withdrawal happened. Use CAGR for a lump sum you left alone; use IRR whenever money moved in or out along the way. This page is for investors and finance students deciding which metric fits their situation. Work through the definitions, the comparison table, and the worked numbers below, then practice the calculations on your own portfolio history using the lessons in the Finelo app.
Searches for "irr vs cagr" spike around performance reviews for a reason: the two metrics can give very different answers for the same account, and neither is wrong. They answer different questions.
What is CAGR?
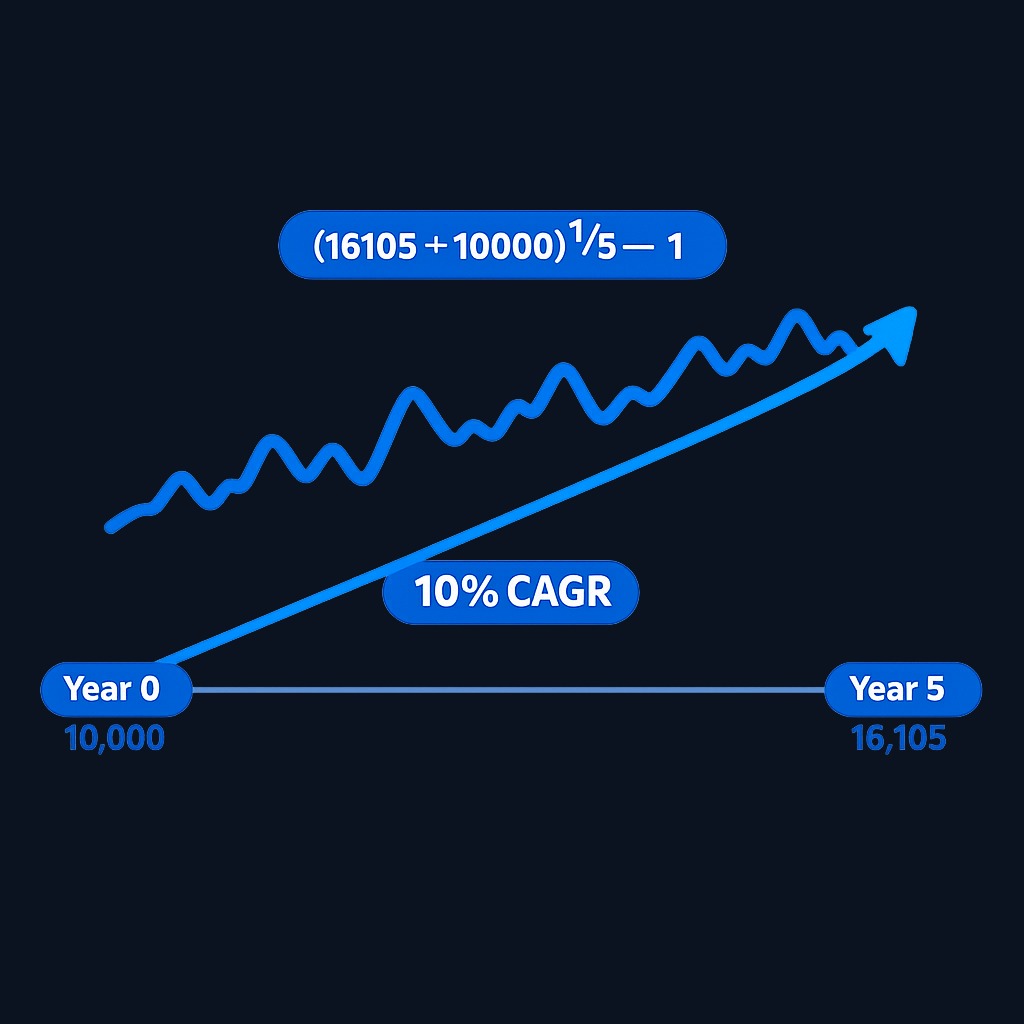
Compound annual growth rate answers one question: at what constant yearly rate would a starting amount have to compound to reach its ending amount over a given number of years? The formula is (ending value ÷ beginning value)^(1 ÷ years) − 1.
If $10,000 grows to $16,105 over five years, CAGR is (16,105 ÷ 10,000)^(1/5) − 1 = 10% per year, even if the actual path was lumpy. CAGR smooths volatility into a single clean rate, which makes it ideal for comparing funds, stocks, or business revenue lines over the same period. What CAGR cannot see is cash flow timing: it assumes one deposit at the start and one measurement at the end. Add or withdraw money mid-stream and CAGR quietly stops describing your experience. It also hides drawdowns entirely, so pair it with a risk measure like volatility when judging an investment.
What is IRR?
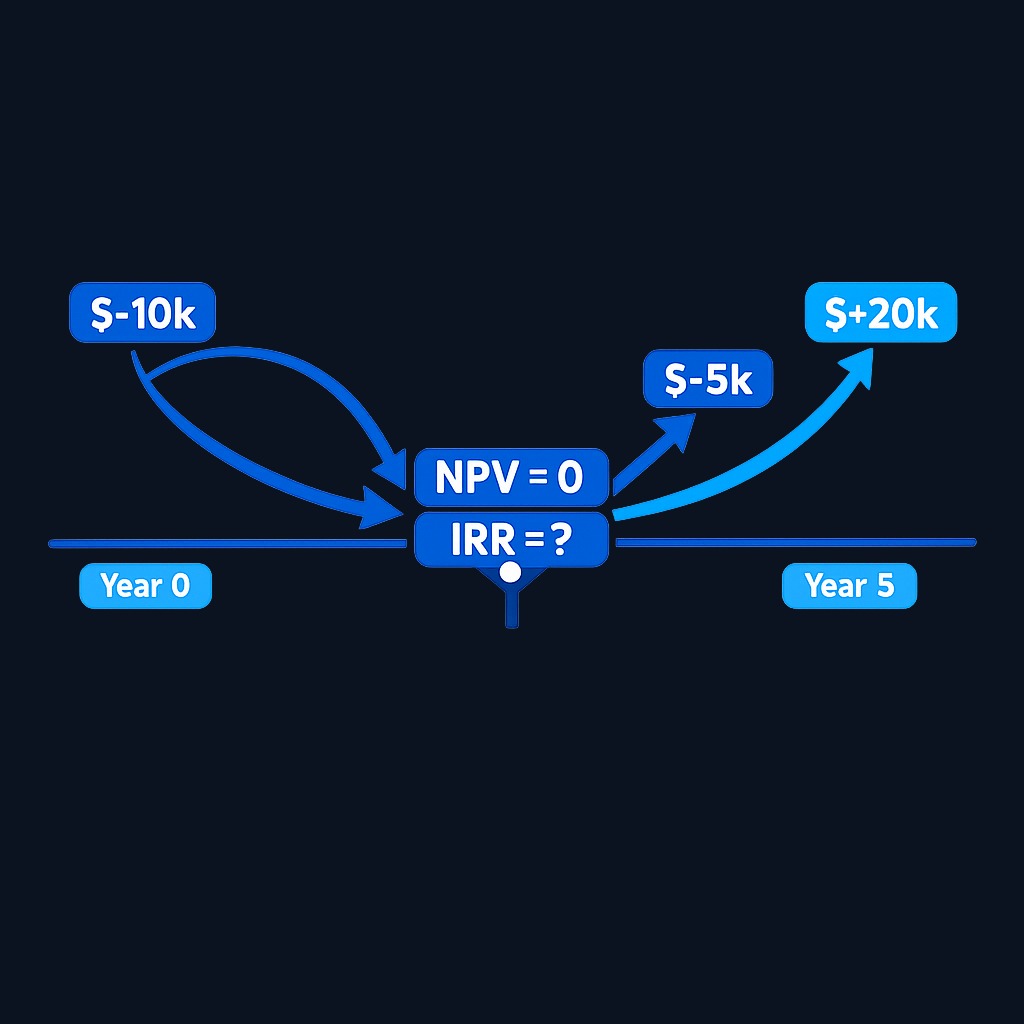
Internal rate of return answers a harder question: given every cash flow in and out of an investment, each on its actual date, what single discount rate makes the net present value of all those flows equal zero? That rate is the IRR.
Because it weights each dollar by how long it was actually invested, IRR is the standard tool for private equity, real estate deals, and any account with ongoing contributions. It is also called a money-weighted return for exactly that reason. There is no clean algebraic formula; IRR is found iteratively, which is why analysts lean on spreadsheet functions (IRR for regular intervals, XIRR for dated flows) rather than hand math. IRR has quirks: it assumes interim proceeds are reinvested at the IRR itself, and a project whose flows flip sign more than once can produce multiple mathematically valid IRRs. For most personal portfolios those edge cases are rare, but they matter in deal analysis.
Key differences between IRR and CAGR
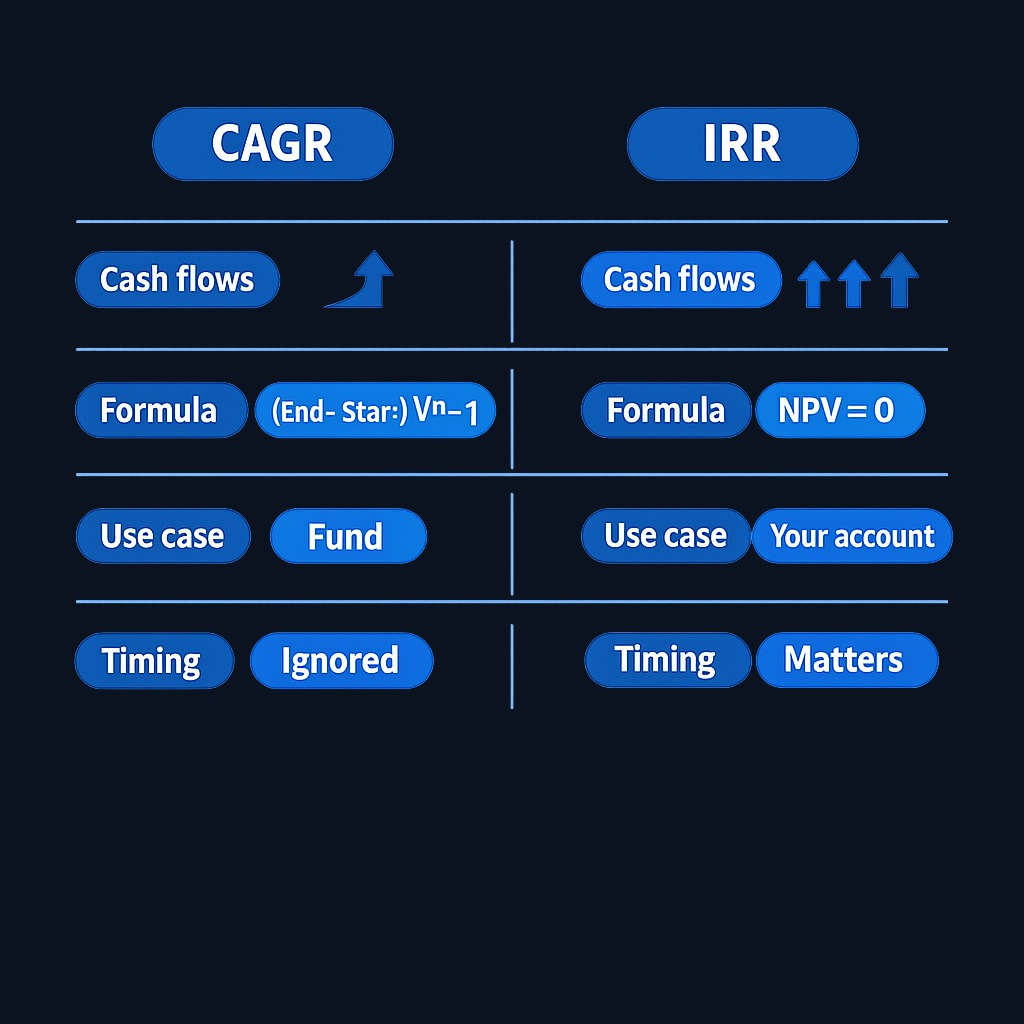
| Criterion | CAGR | IRR |
|---|---|---|
| What it measures | Smoothed growth of one lump sum | Annualized return of dated cash flows |
| Cash flow timing | Ignored | Central to the calculation |
| Formula | Closed-form: (end ÷ start)^(1/n) − 1 | Iterative: rate where NPV = 0 |
| Also known as | Time-weighted style growth rate | Money-weighted return |
| Best for | Comparing funds, indexes, revenue growth | Private deals, accounts with deposits/withdrawals |
| Distorted by | Mid-period contributions | Reinvestment assumption, sign-flip cash flows |
| Tools needed | Any calculator | Spreadsheet IRR/XIRR or financial calculator |
When to use CAGR vs IRR
- Comparing two funds or stocks over the same window: CAGR. It strips out timing and shows pure growth, which is the fair comparison.
- Judging your own account with monthly contributions: IRR. Your deposits arrived over time, and IRR credits each dollar only for the months it was actually at work.
- Evaluating a rental property or private deal with irregular flows: IRR, since purchase costs, rents, refinances, and the sale all land on different dates.
- Reporting business growth (revenue, users): CAGR, the convention in filings and pitch decks.
- Checking whether your timing added value: compare both. An IRR below the same asset's CAGR means your contributions were poorly timed; an IRR above it means timing helped.
Worked example: same account, two different answers
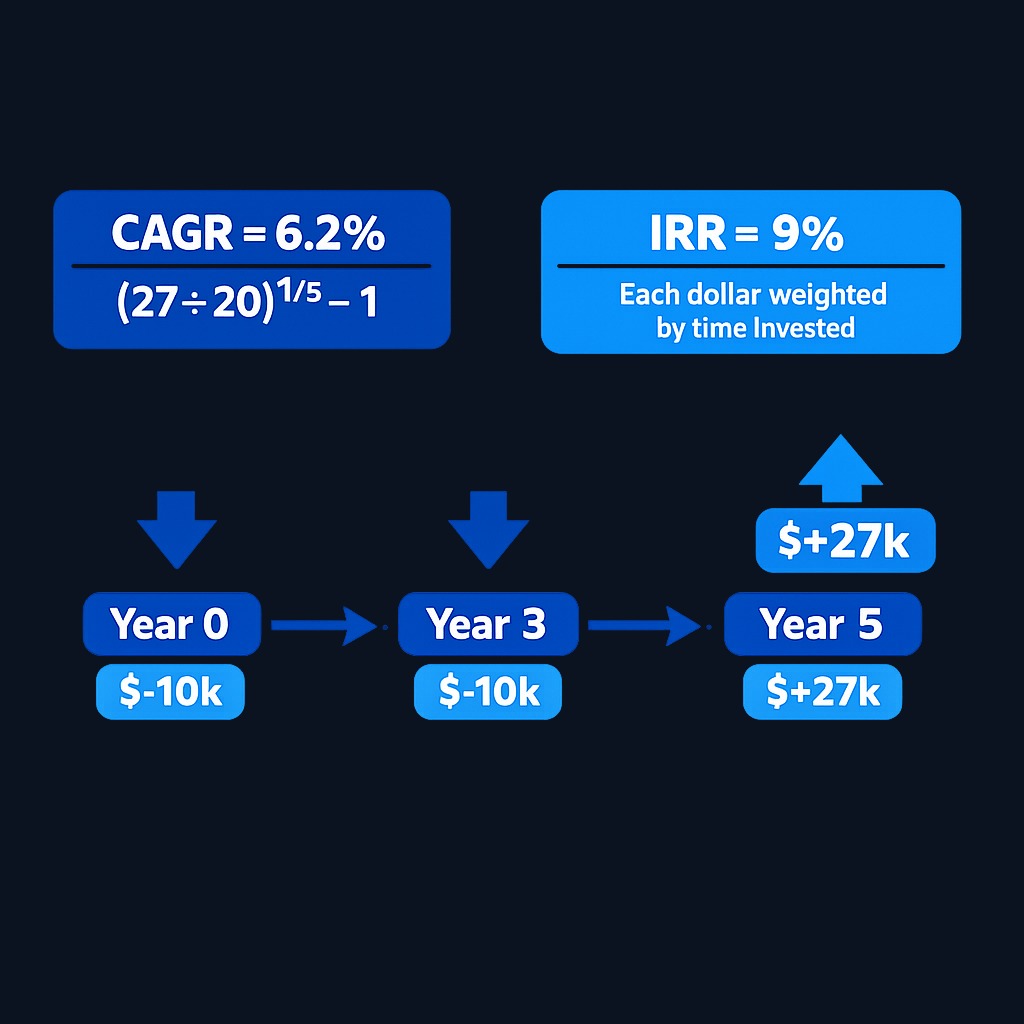
You invest $10,000 on January 1 of year one. At the start of year four, you add another $10,000. At the end of year five, the account is worth $27,000.
- CAGR treats it as one lump sum: total contributions were $20,000 and the ending value is $27,000, so a naive CAGR over five years is (27,000 ÷ 20,000)^(1/5) − 1 ≈ 6.2%. That understates reality, because the second $10,000 only worked for two years.
- IRR respects the dates: solving for the rate that discounts −10,000 (year 0), −10,000 (year 3), and +27,000 (year 5) to zero gives an IRR of roughly 9% per year. Each dollar is judged only for the time it was invested.
Same account, same ending balance, a gap of nearly three percentage points. Neither number lies; the CAGR describes a lump sum that never existed, while the IRR describes what your money actually did. Rebuild this example in a spreadsheet with XIRR and your own dates once, and you will never confuse the two again.
Practice investing with Finelo
Build practical investing skills with guided lessons, simulator practice, and structured challenges.
Common misconceptions
- "IRR is just a fancier CAGR." For a single deposit with no other flows, IRR and CAGR are equal. They diverge the moment cash moves mid-period.
- "Higher IRR always means the better investment." A short deal can post a huge IRR on tiny dollars. Check the holding period and the cash multiple alongside it.
- "CAGR shows what I earned." Only if you never added or withdrew money. Otherwise it describes the asset, not your outcome.
- "Average annual return and CAGR are the same." An arithmetic average of yearly returns overstates compound growth whenever returns vary; CAGR is the geometric, compounding-aware figure. Fee and expense drag compounds the same way, so always check whether a quoted growth rate is gross or net of costs.
What to know before deciding
Both metrics are backward-looking and say nothing about risk. Two funds with identical CAGRs can have different drawdowns; two deals with identical IRRs can differ in leverage and liquidity. State whether results are gross or net of fees and tax. Tax effects are investor- and transaction-specific, so do not assume a generic pre-tax IRR converts directly into one after-tax result.
Decision framework: picking the right return metric
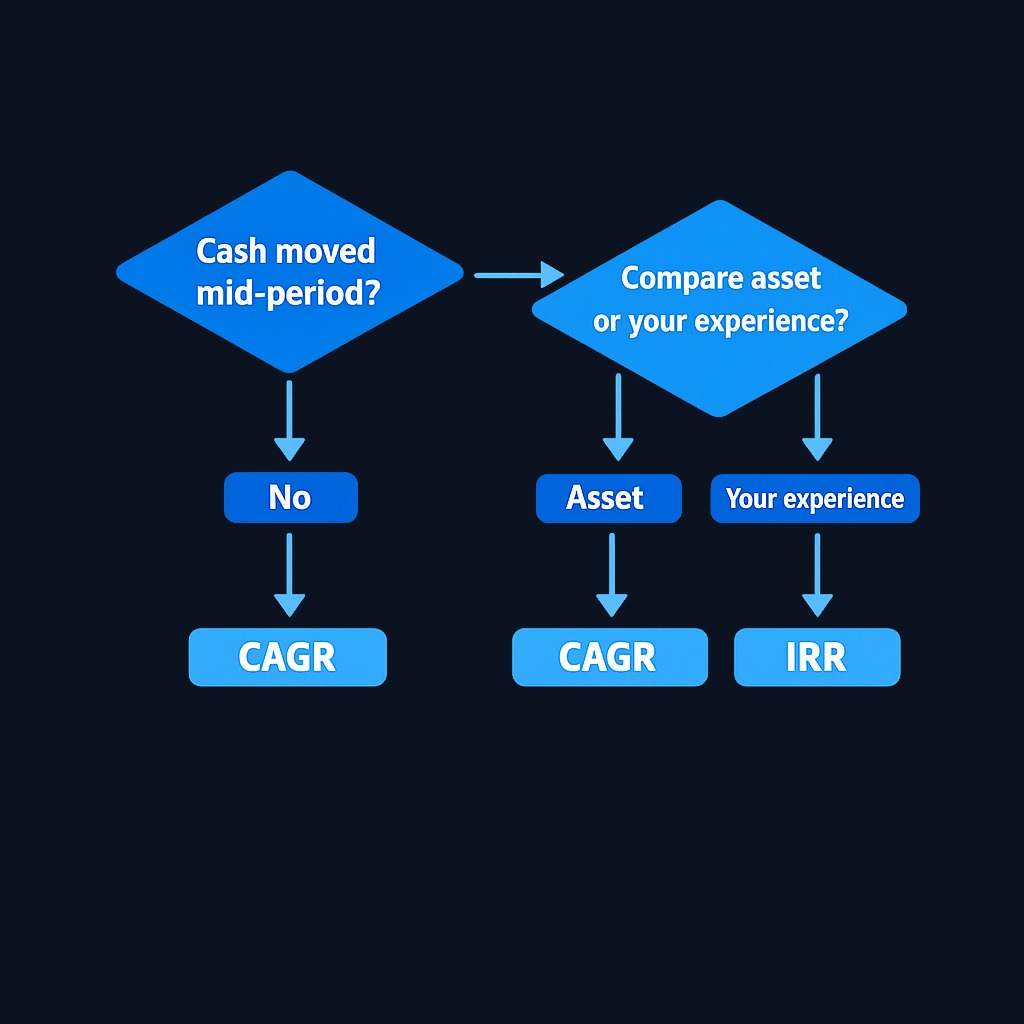
- Did money move in or out after the start? No: CAGR is sufficient. Yes: IRR (or XIRR with exact dates).
- Are you comparing yourself or the asset? The asset: CAGR. Your personal experience: IRR.
- Do you need to communicate it? Match your audience's convention: filings and fund fact sheets use CAGR-style figures; deal memos use IRR plus a cash multiple.
- Do the flows flip sign repeatedly? Consider supplementing IRR with NPV at a chosen discount rate to avoid multiple-IRR ambiguity.
FAQ
What is the difference between IRR and CAGR?
CAGR is the constant yearly rate that turns a starting value into an ending value; it ignores interim cash flows. IRR is the discount rate that sets the net present value of all dated cash flows to zero, so contribution and withdrawal timing directly changes it.
When should I use IRR instead of CAGR?
Use IRR whenever cash moved after the initial investment: recurring deposits, partial sales, rental income, capital calls, or refinances. IRR credits each dollar only for the time it was invested, which CAGR cannot do.
How do I calculate IRR and CAGR?
CAGR: (ending value ÷ beginning value)^(1 ÷ years) − 1. IRR: list every cash flow with its date (outflows negative, inflows positive) and use a spreadsheet's IRR or XIRR function; there is no closed-form formula.
What are the advantages of using IRR?
IRR reflects real timing, handles irregular cash flows, and lets you compare projects with different contribution schedules on one annualized scale. Its main caveats are the reinvestment assumption and possible multiple solutions when cash flows change sign more than once.
Conclusion and next steps
CAGR describes a beginning-to-ending asset path without external cash flows; IRR or XIRR can incorporate the investor's dated cash flows. For an account with contributions, compute the asset or strategy's time-weighted return separately if available—do not force a CAGR onto the account. The gap between time-weighted and money-weighted results reflects cash-flow timing and scale, not necessarily investor skill.
InvestingFundamental AnalysisBeginner
Practice investing with Finelo
Build practical investing skills with guided lessons, simulator practice, and structured challenges.
About the author
Finelo Team
The Finelo Team creates practical investing and trading education designed to help beginners learn faster with structured challenges, simulator practice, and bite-sized lessons.
Keep reading — Related articles

Investing
Tax-gain harvesting vs. tax-loss harvesting
Compare realizing investment gains with realizing losses, including holding periods, wash sales, offsets, and portfolio tradeoffs.
Finelo Team

Investing
Stable value fund vs. money market fund
Compare investment structure, contract protections, transfer restrictions, net yields, and access inside a retirement account.
Finelo Team

Investing
Single-life vs. joint-life annuity
Compare income for one lifetime with continued payments to a survivor, using equal premiums and matching guarantee terms.
Finelo Team


