This article assumes the reader knows net margin = net income ÷ revenue. Its distinct purpose is to reconcile a change in net margin from operating performance through financing, taxes, noncontrolling interests, discontinued operations, and unusual items.
Net Margin Bridge: Explaining Tax, Interest, and One-Off Changes

This article assumes the reader knows net margin = net income ÷ revenue. Its distinct purpose is to reconcile a change in net margin from operating performance through financing, taxes, noncontrolling interests,…
9 min read
Practice investing with Finelo
Build practical investing skills with guided lessons, simulator practice, and structured challenges.
Want to learn more?
Build practical investing skills with guided lessons, simulator practice, and structured challenges.
Explore FineloExplore Finelo's 28-day challenges
Turn learning into a daily habit with guided challenge paths.
Build the bridge from operating margin to net margin
Start with operating margin, then reconcile net interest expense, other income or expense, pretax unusual items, the effective tax rate, discontinued operations, and income attributable to noncontrolling interests or preferred claims. Use both percentage points and dollars so a small denominator does not exaggerate the story.
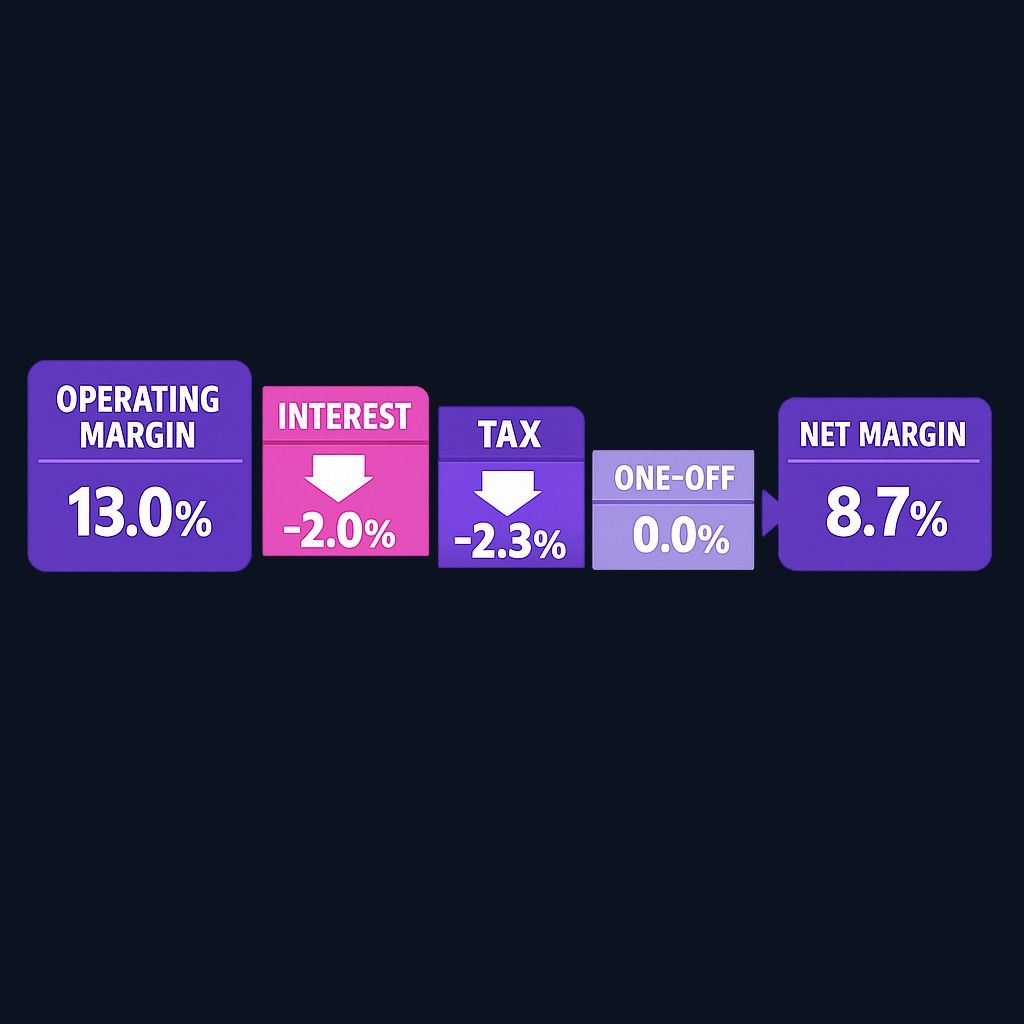
Separate recurring economics from presentation choices, but do not delete inconvenient costs merely because management calls them adjusted. Stock compensation, restructuring, acquisition costs, litigation, FX, asset-sale gains, and tax valuation allowances require a documented policy applied consistently across periods. Tie the adjusted result back to GAAP or IFRS net income and disclose every difference.
A higher net margin can come from better operations, lower interest, a tax benefit, an asset-sale gain, or fewer minority claims; those drivers have different durability. Compare like periods and inspect cash conversion, share dilution, debt, and tax disclosures before attributing the change to business quality.
Net profit margin is the percentage of revenue a company keeps as profit after every expense is paid: it equals net income divided by revenue, multiplied by 100. If a business earns $50,000 of net income on $1,000,000 of revenue, its net profit margin is 5%. This page is for investing students and beginner stock analysts who want to read profitability the way professionals do. You will find the formula, a worked example from a realistic income statement, comparisons with gross and operating margin, and a decision framework for using the ratio in stock research. To practice on real companies afterward, the guided lessons in the Finelo app are a good next step.
How to calculate net profit margin
The formula is simple:
Net profit margin = (Net income ÷ Total revenue) × 100
Net income is the famous bottom line of the income statement: revenue minus cost of goods sold, operating expenses, interest, and taxes. Revenue is the top line. Both figures come straight from a company's income statement, which public companies file quarterly and annually; you can pull any US-listed company's statements free from the SEC's EDGAR database. A margin can be negative when the company loses money, and it can swing sharply in a single quarter due to one-time items, which is why analysts usually look at several periods at once.
Why net profit margin matters
Net profit margin converts raw profit into a comparable efficiency score. A million dollars of net income is spectacular for a small business and alarming for a giant retailer, but a 12% margin means the same thing at any size: twelve cents of every revenue dollar survived all costs. That makes the ratio useful for three jobs. It tracks a single company's discipline over time, it compares competitors within an industry, and it signals pricing power, because a company that sustains fat margins usually sells something customers cannot easily replace. Margins also cushion downturns: a business earning 2 cents per dollar has far less room for error than one earning 20 when revenue dips or costs spike.
Factors that affect net profit margin
- Industry economics. Grocery chains routinely run low-single-digit margins on huge volume, while software firms can exceed 20% because each extra sale costs little to deliver. Margins only make sense against industry peers.
- Cost structure. Heavy fixed costs magnify swings: when revenue rises, margin expands quickly, and when it falls, margin collapses just as fast.
- Pricing power and competition. Discounting to defend market share compresses the margin even when sales grow.
- Interest and taxes. Because net income sits below interest expense and tax, a debt-heavy balance sheet or a changed tax rate moves the margin with no change in operations.
- One-time items. Asset sales, write-downs, and legal settlements can inflate or crush a single period's margin, which is why one quarter never tells the story.
Net profit margin vs other profit margins
| Margin | Formula | What it captures | Blind spots |
|---|---|---|---|
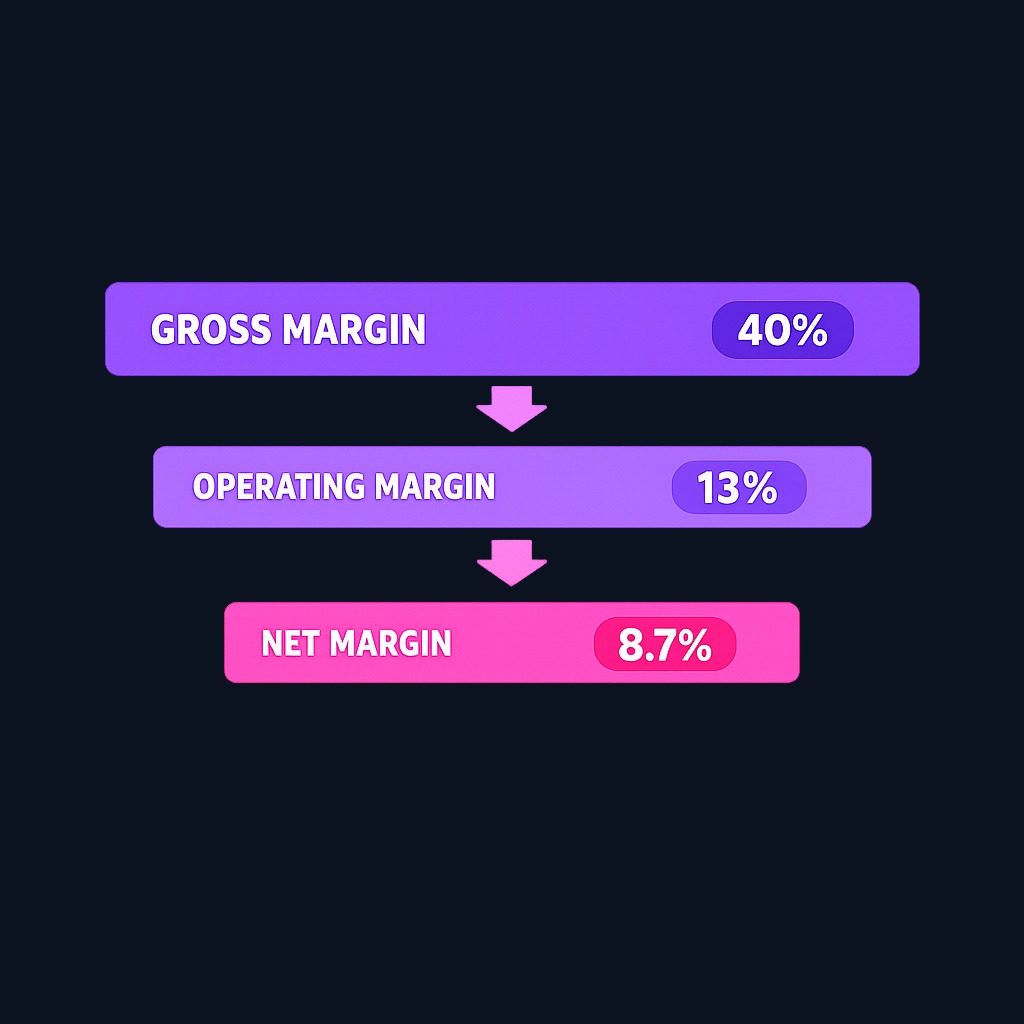
| Gross margin | (Revenue − COGS) ÷ Revenue | Production and pricing efficiency | Ignores overhead, interest, tax |
| Operating margin | Operating income ÷ Revenue | Core business efficiency including overhead | Ignores financing and tax effects |
| Net profit margin | Net income ÷ Revenue | Everything: the true bottom line | Distorted by one-time and non-operating items |
The three margins form a waterfall. Comparing them locates the problem: strong gross margin with weak net margin points to bloated overhead, heavy debt service, or unusual charges rather than a bad product.
Practice investing with Finelo
Build practical investing skills with guided lessons, simulator practice, and structured challenges.
Worked example: from income statement to margin
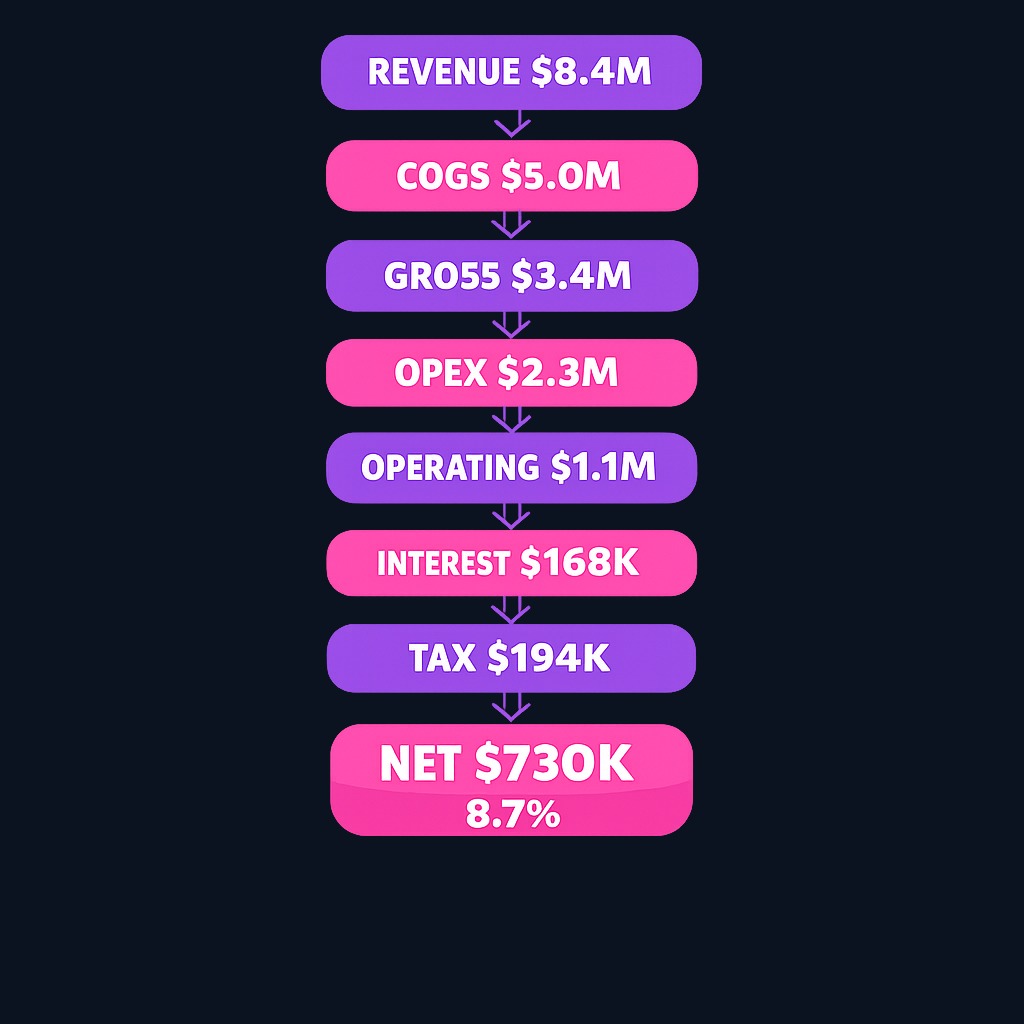
Take a fictional retailer, Meridian Outfitters, for its fiscal year:
- Revenue: $8,400,000
- Cost of goods sold: $5,040,000 → gross profit $3,360,000 (gross margin 40.0%)
- Operating expenses: $2,268,000 → operating income $1,092,000 (operating margin 13.0%)
- Interest expense: $168,000
- Taxes: $194,000
- Net income: $1,092,000 − 168,000 − 194,000 = $730,000
Net profit margin = 730,000 ÷ 8,400,000 × 100 = 8.7%.
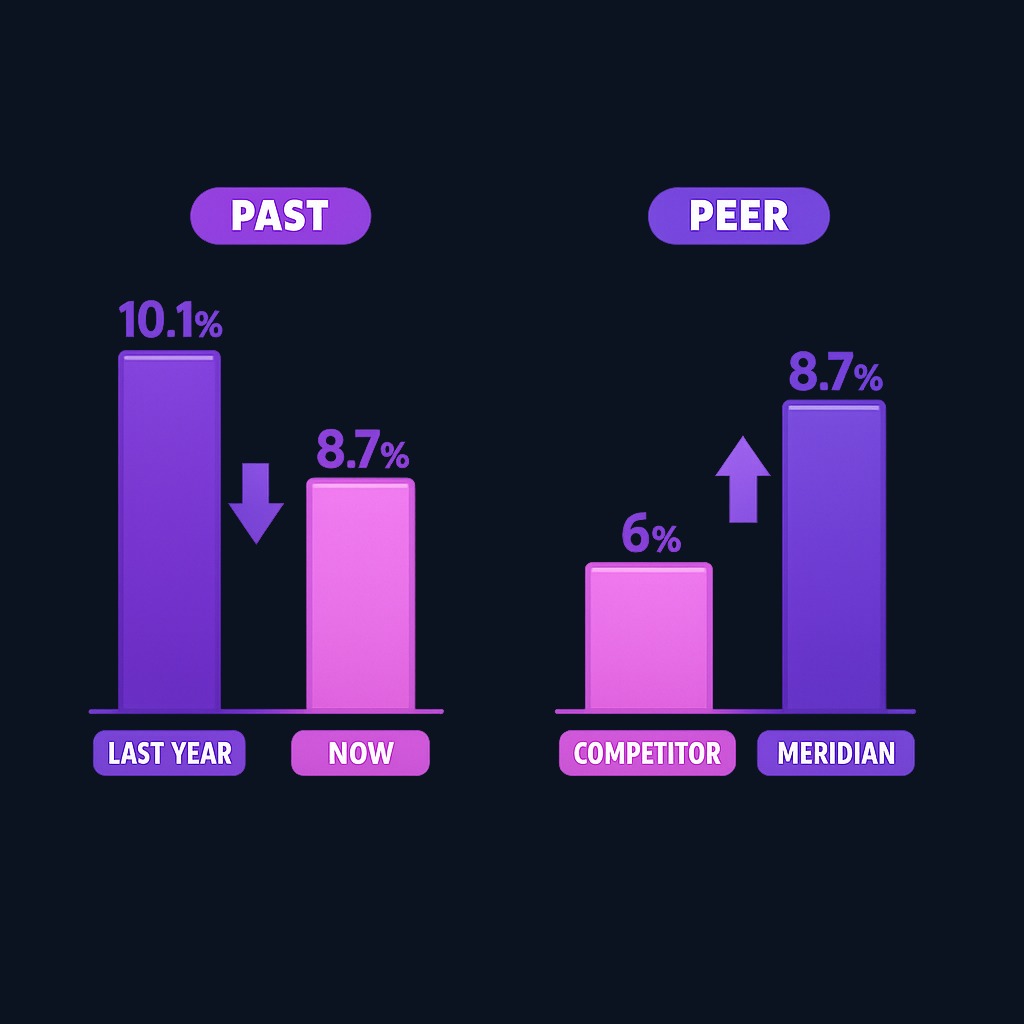
Now the comparison work begins. If Meridian posted 10.1% last year, the drop demands an explanation: the statements show interest expense doubled after a new warehouse loan. If the closest competitor runs 6%, Meridian still operates more efficiently than its peer despite the decline. One ratio, two directions of insight: against its own history and against its industry.
Strategies companies use to improve net profit margin
Businesses attack the ratio from both ends. On the revenue side: raising prices where demand allows, shifting the mix toward higher-margin products or services, and dropping chronically unprofitable customers or lines. On the cost side: renegotiating supplier contracts, automating repetitive work, trimming overhead, refinancing expensive debt, and managing tax efficiently. For an investor, the interesting question is which lever produced a margin improvement, because price-driven gains signal strength while pure cost-cutting eventually hits a floor.
What to know before deciding
Net profit margin is a starting point, not a verdict. Keep three cautions in mind before acting on it.
It is not cash flow
Net income includes non-cash items like depreciation and can diverge sharply from the cash a business actually generates. A healthy margin with weak operating cash flow deserves a closer look.
Common misconceptions
A higher margin is not automatically better if it comes from underinvestment; slashing marketing and research inflates this year's margin at the expense of future growth. Nor is a "good" margin a universal number: 3% can be excellent in food retail and terrible in software. Finally, margin is not markup; margin divides profit by revenue, while markup divides it by cost, so the same transaction produces two different percentages.
One period proves little
Seasonality, write-offs, and tax quirks make single quarters noisy. Three to five years of margins reveal the trend that one year hides.
Decision framework: using net profit margin in stock analysis
- Compute or look up the margin for the last 3-5 years. A stable or rising line beats a flashy single year.
- Benchmark against 2-3 direct competitors. Persistent above-peer margins hint at a durable advantage; persistent below-peer margins demand a reason to believe in a turnaround.
- Trace big changes to their source. Read the income statement to see whether the move came from operations, financing, taxes, or one-time items.
- Cross-check with gross and operating margin. The waterfall tells you where efficiency is won or lost.
- Confirm with cash flow. Margins that never convert to cash are accounting stories, not businesses.
Diversifying your analysis this way protects you from the classic beginner error of buying a stock on one impressive number, and it pairs naturally with portfolio basics like diversification and honest risk tolerance.
FAQ
What is a good net profit margin?
It depends on the industry. Low-margin, high-volume sectors like grocery retail often live below 5%, while software and pharmaceutical companies can sustain 15-25% or more. Judge a company against its direct peers and its own history rather than a universal benchmark.
How is net profit margin different from gross profit margin?
Gross margin subtracts only the cost of goods sold, showing production efficiency. Net profit margin subtracts everything, including overhead, interest, and taxes, showing what finally remains for shareholders. A company can have a strong gross margin and still lose money at the net line.
Can net profit margin be negative?
Yes. Whenever total expenses exceed revenue, net income is negative and so is the margin. Persistent negative margins burn cash, though young growth companies sometimes run them deliberately while scaling.
Does a rising net profit margin always mean a healthier company?
Not always. Margins can rise temporarily from one-time gains, aggressive cost cuts, or underinvestment. Check whether the improvement came from durable pricing power or operating efficiency before treating it as good news.
Conclusion and next steps
Net profit margin distills an entire income statement into one comparable number: the share of each revenue dollar that survives every cost. Calculate it across several years, benchmark it against peers, and trace any big move to its cause in the statements. Used this way, the ratio quickly separates efficient operators from fragile ones. The best way to make the skill stick is repetition on real filings: pull two competitors' income statements from EDGAR, run the waterfall from gross to operating to net margin, and write down what differs.
InvestingFundamental AnalysisFinancial StatementsBeginner
Practice investing with Finelo
Build practical investing skills with guided lessons, simulator practice, and structured challenges.
About the author
Finelo Team
The Finelo Team creates practical investing and trading education designed to help beginners learn faster with structured challenges, simulator practice, and bite-sized lessons.
Keep reading — Related articles

Investing
Tax-gain harvesting vs. tax-loss harvesting
Compare realizing investment gains with realizing losses, including holding periods, wash sales, offsets, and portfolio tradeoffs.
Finelo Team

Investing
Stable value fund vs. money market fund
Compare investment structure, contract protections, transfer restrictions, net yields, and access inside a retirement account.
Finelo Team

Investing
Single-life vs. joint-life annuity
Compare income for one lifetime with continued payments to a survivor, using equal premiums and matching guarantee terms.
Finelo Team


