Methodology note: A correlation estimate is incomplete without the return frequency, lookback window, currency, price/total-return choice, and data source. Portfolio volatility depends on weights, each asset's volatility, and all covariances—not correlation alone. Historical linear correlation can change sharply in stress and does not capture nonlinear dependence, liquidity, or tail risk. There are no universal 0.5 or 0.8 cutoffs.
Portfolio Correlation: What It Is and How to Use It

Portfolio correlation measures how the assets in your portfolio move in relation to each other, on a scale from +1 (they move together) to −1 (they move opposite). It is the math behind diversification: combining assets…
8 min read
Practice investing with Finelo
Build practical investing skills with guided lessons, simulator practice, and structured challenges.
Want to learn more?
Build practical investing skills with guided lessons, simulator practice, and structured challenges.
Explore FineloExplore Finelo's 28-day challenges
Turn learning into a daily habit with guided challenge paths.
Portfolio correlation measures how the assets in your portfolio move in relation to each other, on a scale from +1 (they move together) to −1 (they move opposite). It is the math behind diversification: combining assets with low or negative correlation smooths a portfolio's swings, while combining highly correlated assets just repeats the same bet. This page is for investors who want to understand whether their holdings truly diversify each other or only appear to. You will learn the scale, the calculation, real asset examples, and the common traps. Read it, then check the correlation between your two largest holdings before you add anything new.
What is portfolio correlation?
Correlation is a statistical relationship between two return series over a chosen time period. The correlation coefficient compresses that relationship into one number:
- +1.0 - perfect positive correlation; the assets move in lockstep.
- 0 - no linear relationship; each asset moves on its own drivers.
- −1.0 - perfect negative correlation; one rises when the other falls.

Real financial assets rarely stay at the extremes, and estimates change with sample choice and regime. Any numerical example must state the securities, currency, total-return data, frequency, and dates; do not reuse a past stock-bond estimate as a permanent assumption.
Portfolio correlation extends the idea beyond pairs. A full correlation matrix shows the coefficient for every pair of holdings, revealing whether your portfolio is a collection of independent bets or one bet wearing different names.
Why portfolio correlation matters
Diversification only works when assets do not fall together. Ten stocks from the same sector can feel diversified, yet if their pairwise correlations run near 0.9, the portfolio behaves like one large position. The whole benefit of diversification comes from combining return streams that respond to different forces.
Low correlation reduces portfolio volatility without necessarily reducing expected return. When one asset zigs while another zags, the combined equity curve is smoother than either alone. Smoother matters practically: shallower drawdowns are easier to sit through, which keeps investors from abandoning plans at the worst moment.
Correlation also shapes rebalancing. When assets move differently, rebalancing forces you to trim what ran up and buy what lagged. With highly correlated holdings there is nothing meaningful to rebalance, because everything moved together.
How to calculate portfolio correlation
The correlation coefficient between two assets is their covariance divided by the product of their standard deviations. In practice nobody computes it by hand: spreadsheet functions like CORREL, portfolio trackers, and broker tools do it from historical returns.
What you choose matters more than the arithmetic:
- Pick a return frequency. Daily returns capture short-term behavior; monthly returns better reflect what a long-term investor experiences.
- Pick a lookback period. A 3-year window and a 10-year window can tell different stories about the same pair.
- Compute returns, not prices. Correlation of raw price levels is misleading; always use percentage changes.
- Build the matrix. For each pair of holdings, compute the coefficient and look for clusters of high values.
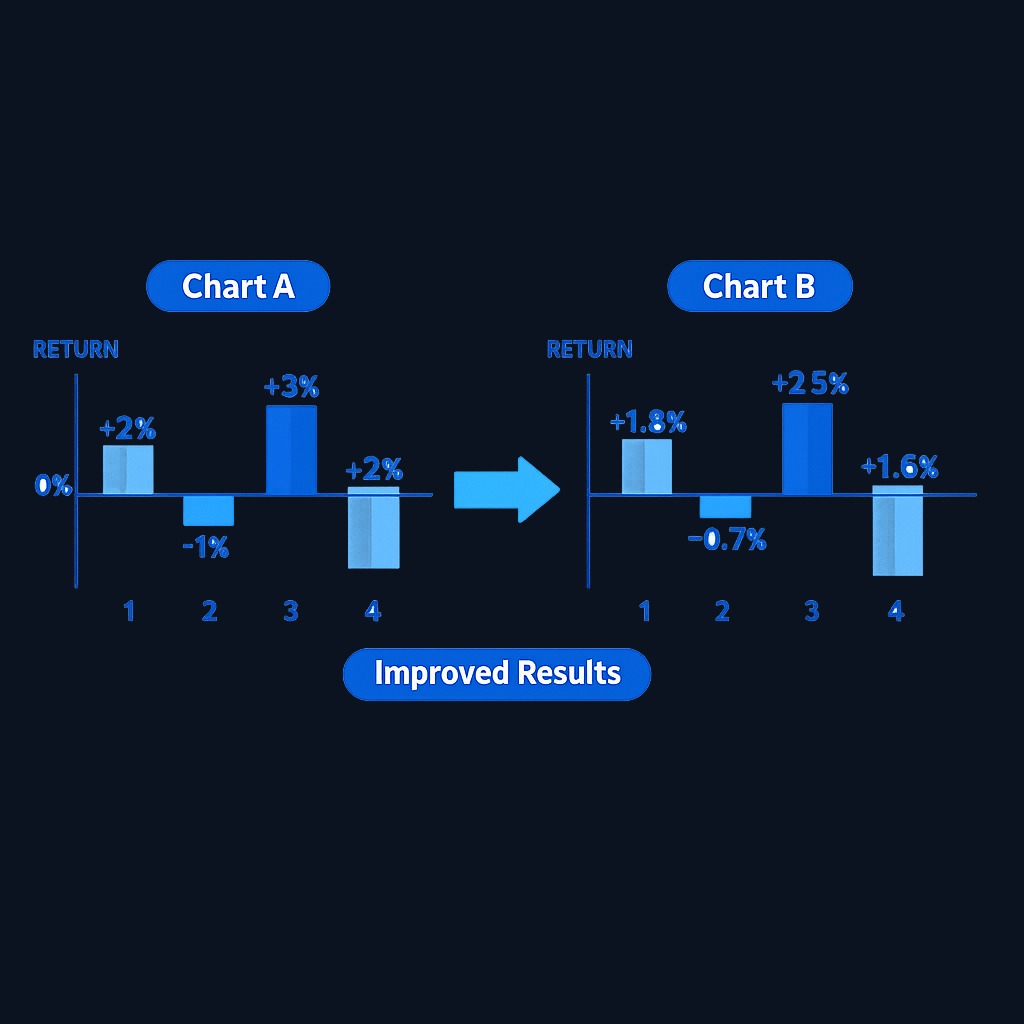
A simple example: suppose Asset A and Asset B each returned the following over four periods. A: +2%, −1%, +3%, −2%. B: +1.8%, −0.7%, +2.5%, −1.6%. The two series rise and fall together in every period, and the computed correlation lands near +0.99. Adding B to a portfolio of A changes almost nothing except position size.
| Pair | Typical historical relationship |
|---|---|
| Two stocks in one sector | Often positive, but calculate it for the named securities and period |
| Broad stock index vs investment-grade bonds | Low, regime-dependent; sometimes negative |
| Stocks vs gold | Low on average, unstable in crises |
| Stocks vs cash | Near zero |
| Two broad global stock indexes | High positive, rising during global selloffs |
Yields that drive the bond side of these relationships are published in the Federal Reserve's H.15 selected interest rates release, a useful reference when you study how rate moves ripple into both stocks and bonds.
Examples and how market conditions change correlation
Assets that tend to move together
Stocks within the same industry share customers, costs, and cycles. Regional bank shares, for example, respond to the same rate and credit forces. Index funds tracking overlapping markets are even more extreme; holding three S&P 500 funds from different providers is one position, not three.
Assets that tend to move independently
Government bonds, commodities, real assets, and stocks respond to different primary drivers: rate expectations, supply shocks, inflation, and earnings respectively. Their pairwise correlations are historically lower, which is why classic balanced portfolios mix them.

The crisis caveat
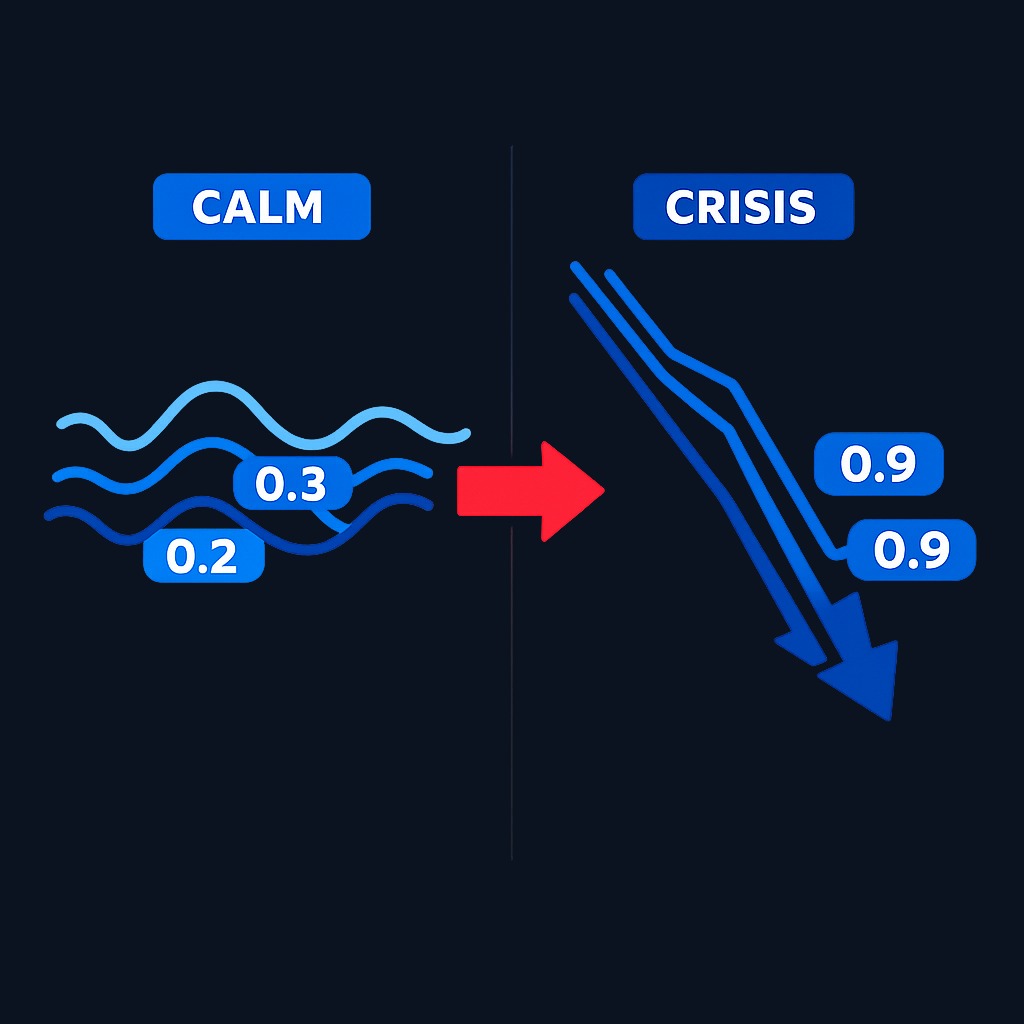
Correlations are not stable. In calm markets, many pairs look pleasantly independent. In sharp selloffs, correlations across risk assets tend to rise toward 1 as investors sell everything at once, exactly when you want diversification most. Bonds and stocks can also flip from negatively correlated to positively correlated in inflation-driven regimes. Any risk plan built on a single historical correlation number is fragile; test how the portfolio would behave if the coefficients climbed sharply.
Common mistakes
- Confusing correlation with causation, or assuming a past coefficient is a law of nature.
- Measuring over one convenient period and ignoring how the number drifts.
- Diversifying by asset names rather than by return drivers.
- Ignoring currency effects that quietly link international holdings.
- Treating near-zero correlation as protection against every crisis.
Practice investing with Finelo
Build practical investing skills with guided lessons, simulator practice, and structured challenges.
What to know before deciding
Correlation is a backward-looking, linear summary of a messy relationship. Two assets can share a low coefficient yet crash together in a tail event, because correlation understates dependence in extremes. The number also says nothing about which asset earns a return; a perfectly uncorrelated asset with no expected return just dilutes the portfolio. Use correlation as one input alongside expected return, volatility, and your own horizon. This is educational context for building a sturdier allocation, not a formula that guarantees smooth results.
Decision framework: applying correlation to your portfolio
- Auditing an existing portfolio? Build rolling correlation and covariance matrices with documented inputs, then inspect weights, volatilities, concentrations, and stress periods.
- Adding a new holding? Check its correlation to your largest position first; a lower coefficient adds more diversification per dollar.
- Preparing for stress? Assume risk-asset correlations rise in a selloff and keep a truly defensive sleeve, such as high-grade bonds or cash.
- Comparing two similar funds? If their correlation is near 1, pick one on cost and simplicity rather than holding both.
- Long horizon, simple plan? A few broad, cheaply weighted asset classes with structurally different drivers beat a pile of overlapping products.
FAQ
What is a good correlation for diversification?
Lower pairwise correlation can reduce modeled variance when weights and volatilities are held constant, but there is no 0.5 cutoff and lower is not automatically better. Expected return, drawdowns, liquidity, nonlinear exposure, and correlation changes also matter.
Can portfolio correlation be negative?
Yes. A coefficient below zero means the assets have tended to move in opposite directions over the measured period. Negative correlation is valuable but rare among return-producing assets, and it is rarely stable across regimes.
How often should I check my portfolio's correlations?
A yearly review is enough for most long-term investors, plus a fresh look after big regime changes such as an inflation spike or a rate cycle turn. Correlations drift, so treat old matrices as expired.
Does high correlation mean I should sell a holding?
Not automatically. It means the holding adds little diversification. You might still keep it for expected return, but recognize that it concentrates rather than spreads your risk.
Conclusion and next steps
Portfolio correlation turns "don't put all your eggs in one basket" into something you can measure. Compute the matrix for your current holdings, find the clusters that secretly move together, and favor new additions that respond to different forces than what you already own. Then re-check the numbers periodically, because relationships between markets are rented, never owned.
InvestingFundamental AnalysisBeginner
Practice investing with Finelo
Build practical investing skills with guided lessons, simulator practice, and structured challenges.
About the author
Finelo Team
The Finelo Team creates practical investing and trading education designed to help beginners learn faster with structured challenges, simulator practice, and bite-sized lessons.
Keep reading — Related articles

Investing
Tax-gain harvesting vs. tax-loss harvesting
Compare realizing investment gains with realizing losses, including holding periods, wash sales, offsets, and portfolio tradeoffs.
Finelo Team

Investing
Stable value fund vs. money market fund
Compare investment structure, contract protections, transfer restrictions, net yields, and access inside a retirement account.
Finelo Team

Investing
Single-life vs. joint-life annuity
Compare income for one lifetime with continued payments to a survivor, using equal premiums and matching guarantee terms.
Finelo Team


