The price to cash flow ratio compares a company's market value to the cash its operations generate. You calculate it by dividing the share price by operating cash flow per share, or equivalently, market capitalization by total operating cash flow. A ratio of 10 means investors pay ten dollars for every dollar of annual operating cash flow.
Price to Cash Flow Ratio: Definition, Calculation, and Importance

The price to cash flow ratio compares a company's market value to the cash its operations generate. You calculate it by dividing the share price by operating cash flow per share, or equivalently, market capitalization…
8 min read
Practice investing with Finelo
Build practical investing skills with guided lessons, simulator practice, and structured challenges.
Want to learn more?
Build practical investing skills with guided lessons, simulator practice, and structured challenges.
Explore FineloExplore Finelo's 28-day challenges
Turn learning into a daily habit with guided challenge paths.
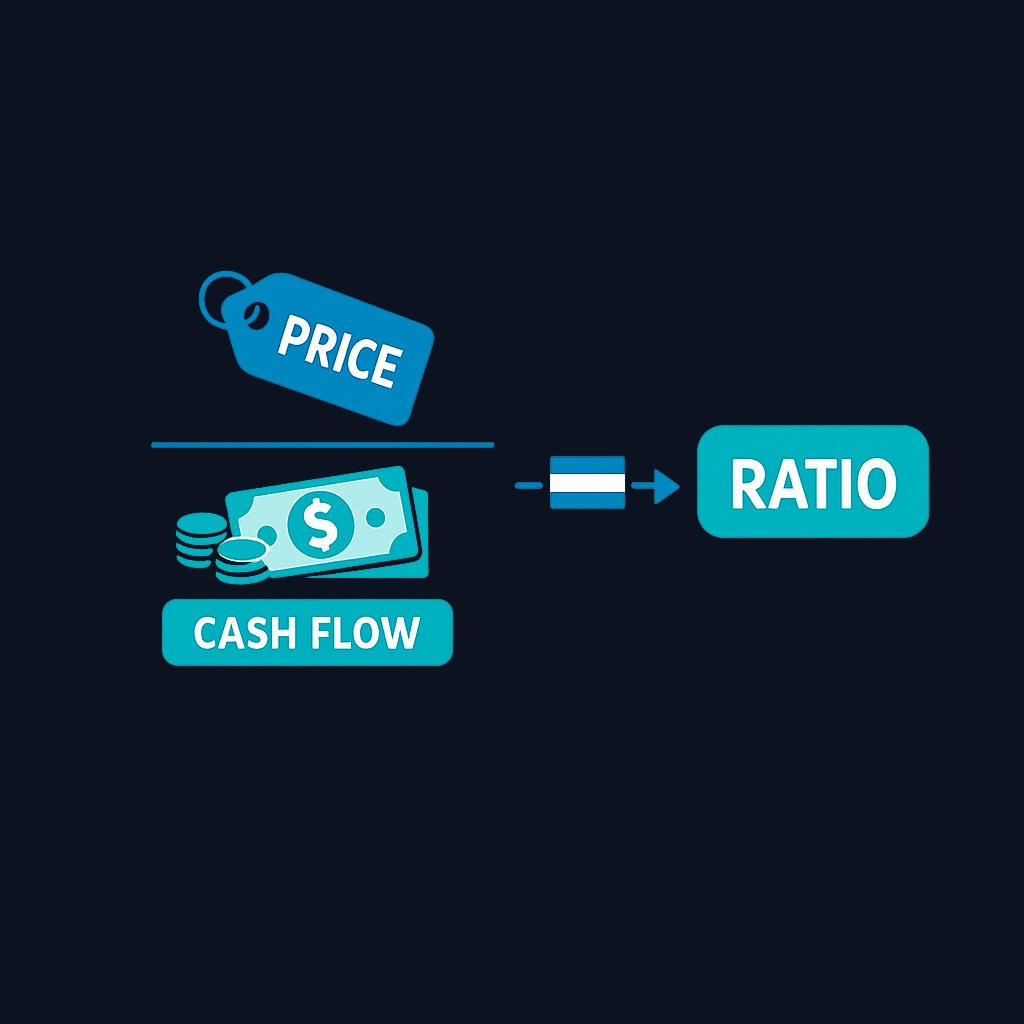
Investors use this ratio because cash is harder to manipulate than reported earnings. This guide is for investors comparing valuation tools: it covers the calculation, interpretation, comparisons with related metrics, real applications, and the traps. Educational content only, not financial advice; verify any company's figures in its official filings.
How to calculate the price to cash flow ratio
Two equivalent forms:
P/CF = share price ÷ operating cash flow per share
P/CF = market capitalization ÷ operating cash flow
Operating cash flow comes straight from the cash flow statement in a company's filings. It measures the cash the core business produced, after real-world timing of payments, but before investments in equipment and before financing moves.
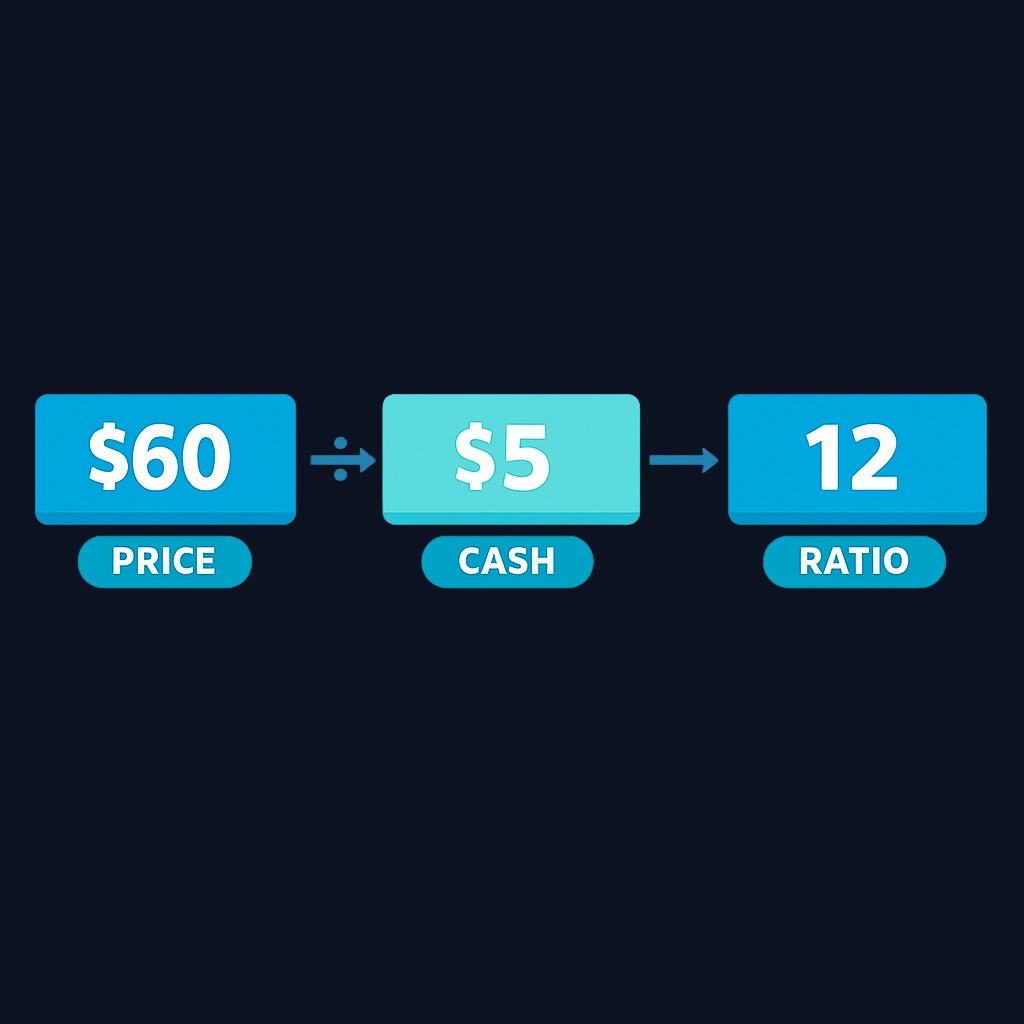
A worked example: a company's stock trades at $60, and last year it generated $5 of operating cash flow per share. P/CF = 60 ÷ 5 = 12. Investors are paying twelve times the company's annual operating cash generation.
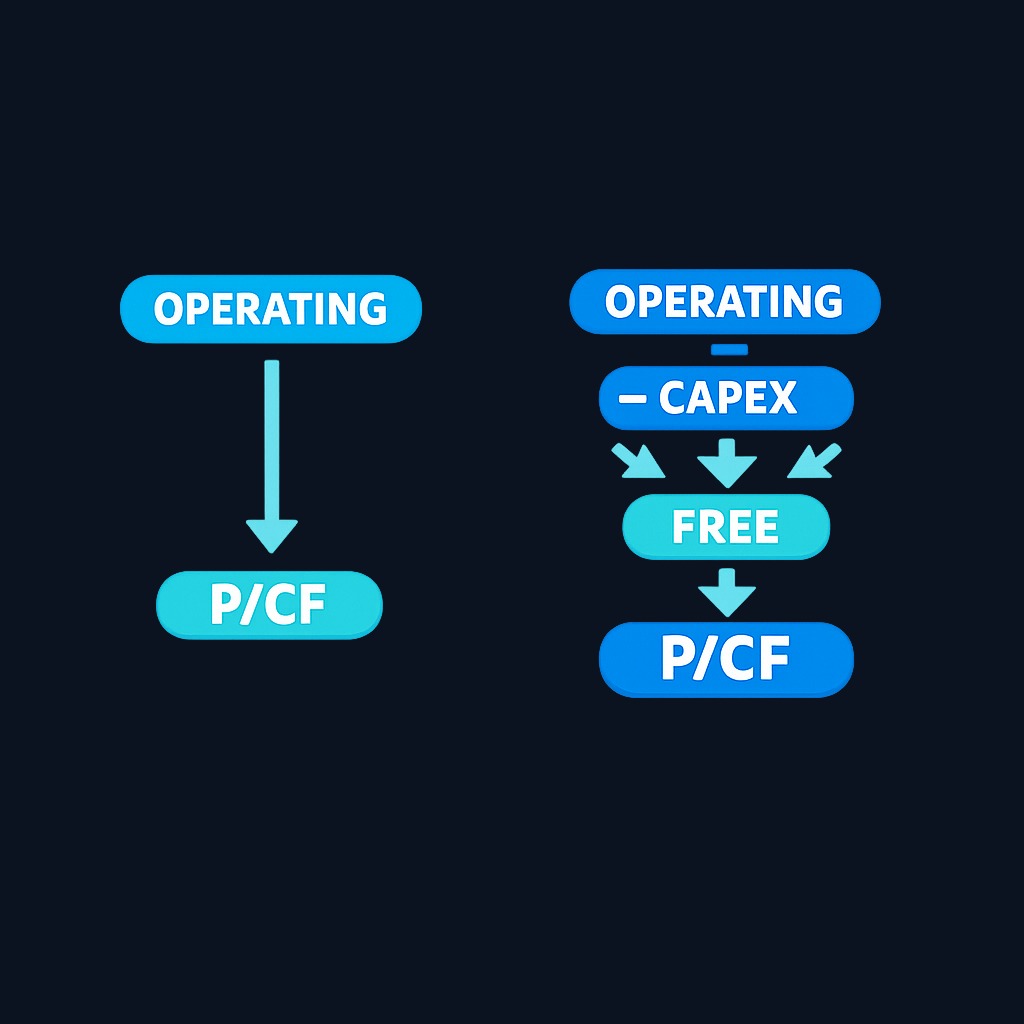
Some analysts substitute free cash flow, which subtracts capital spending from operating cash flow, producing the stricter price to free cash flow ratio. Free cash flow represents money genuinely available to shareholders after keeping the business running, so its ratio runs higher but tells a more conservative story. Whichever version you use, apply it consistently across every company you compare.
What is included in operating cash flow
Knowing what is included in the denominator keeps the ratio honest. Operating cash flow starts from net income and adds back non-cash charges such as depreciation and amortization. It then adjusts for working-capital movements: cash collected from customers, cash paid to suppliers, inventory changes, and similar operating flows.
Not included: spending on equipment and acquisitions, which appears in investing activities, and dividends, buybacks, and borrowing, which appear in financing activities. Interest and tax treatment can vary between accounting standards, so two companies may classify similar payments differently. When comparing across borders or data providers, confirm the definitions match before trusting the comparison.
Interpreting the price to cash flow ratio
Lower ratios mean you pay less per dollar of cash generation; higher ratios mean the market expects growth. As loose orientation, single-digit P/CF ratios often attract value-oriented interest, low teens sit near broad-market norms in many periods, and higher readings price in substantial expansion. These bands drift with interest rates and market mood, so anchor any reading in comparisons:
- Against industry peers. Capital-light software businesses convert revenue to cash differently than machinery-heavy manufacturers; cross-industry comparisons mostly measure business models.
- Against the company's own history. A stock trading far below its usual P/CF range invites investigation, in both directions: bargain or newly broken business.
- Against growth. Faster cash flow growth justifies richer multiples. A P/CF of 20 with rapid, durable growth can be cheaper in substance than a P/CF of 8 attached to shrinking cash flows.
The ratio's strongest feature is its resistance to accounting cosmetics. Depreciation choices, one-time provisions, and other non-cash items move earnings without moving operating cash. When earnings-based valuations look suspiciously flattering, the cash-based ratio serves as the cross-examination.
Value and comparison notes: P/CF vs other metrics
P/CF vs P/E. The most important comparison. P/E uses net income, which absorbs every accounting judgment; P/CF uses cash, which absorbs almost none. When the two ratios disagree sharply about the same company, earnings and cash have diverged, and finding out why is often the most valuable research question available. Persistent profits without cash generation is a classic warning pattern.

P/CF vs price to free cash flow. Operating cash flow ignores the capital spending a business needs to sustain itself. For capital-hungry companies, P/CF can look comfortable while free cash flow is negative. The free cash flow version is stricter and better for judging what owners can actually extract.
P/CF vs P/B. Price to book compares valuation against balance-sheet equity rather than cash generation, and suits asset-driven businesses like banks. P/CF suits operating businesses whose value lies in the cash their activities produce.
P/CF vs EV/EBITDA. Enterprise-value multiples include debt in the price and use a proxy for pre-investment cash generation. They are the standard for comparing companies with different debt loads, at the cost of extra computation. P/CF is the simpler equity-side lens.
No single ratio settles a valuation. The habit that works is triangulation: when P/CF, an earnings multiple, and an enterprise multiple all point the same direction, the conclusion deserves more trust.
Real-world applications
Screening. Ranking an industry by P/CF surfaces companies whose cash generation is cheap relative to peers, a starting list for deeper research rather than a buy list.
Auditing earnings quality. Comparing P/E and P/CF across a portfolio flags holdings whose reported profits lack cash behind them. Widening gaps between the two ratios over several years often precede unpleasant surprises.
Valuing cyclical and heavy-depreciation businesses. Companies with large depreciation charges can show weak earnings while producing strong cash. P/CF captures their economics more fairly than P/E, which is why it is popular for industrials, energy, and telecom analysis.
Cross-checking a thesis. Before buying a stock because it looks cheap on earnings, check the cash version. A bargain confirmed by cash flow is a sturdier bargain.
Practice investing with Finelo
Build practical investing skills with guided lessons, simulator practice, and structured challenges.
Plans, billing, and limits to verify in your data sources
Most investors pull P/CF figures from screeners, broker research tabs, or market data platforms rather than computing them by hand. Before relying on any tool, verify three things. First, what the plan includes: some free tiers show only trailing-twelve-month figures, while paid plans add historical ranges and industry comparisons. Second, the billing terms and usage limits of any subscription you sign up for, including how many companies, exports, or API calls the tier allows. Third, and most important, the definition behind the number: whether the platform uses operating cash flow or free cash flow, and whether the period is the last fiscal year or a rolling twelve months. Two platforms can display different "P/CF" values for the same stock on the same day for exactly these reasons. Verify current plan details and limits on any provider's official site before paying, and spot-check a few values against the company's own filings.
Common misconceptions
"Low P/CF means undervalued." Sometimes it means the market correctly expects cash flows to shrink. Cheapness is a question the ratio raises, not a conclusion it delivers.
"Cash flow cannot be manipulated." It is harder to distort than earnings, not impossible. Companies can time payments to suppliers and collections from customers to dress up a period's operating cash flow. Multi-year views dilute the tricks.
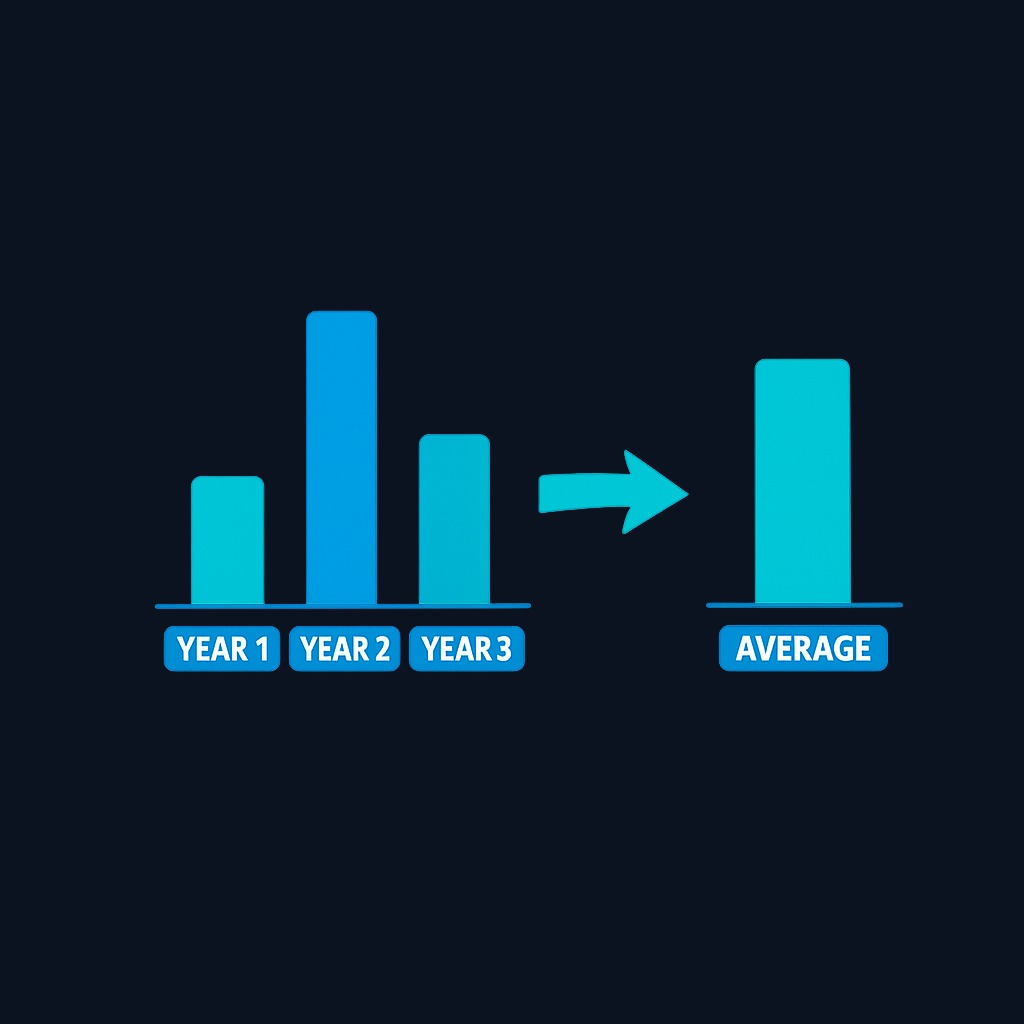
"One year of cash flow is enough." Working-capital swings make single-year cash flow lumpy, especially for growing or seasonal businesses. Average several years for a fair denominator.
"The ratio works for every company." Businesses with negative operating cash flow produce meaningless ratios, and financial companies' cash flows follow different logic entirely. Know where the tool does not apply.
What to know before deciding
Before acting on any P/CF reading, verify the inputs in the company's official cash flow statement, available through the SEC's EDGAR database for US-listed companies. Confirm which cash flow definition your data source uses, average several years if the business is lumpy, and compare only within the industry. Then ask the two questions the ratio cannot answer: is this cash generation sustainable, and what will management do with the cash? A cheap multiple on decaying cash flows is a trap; a fair multiple on growing, well-allocated cash flows has quietly built many fortunes.
Decision framework: putting P/CF to work
- Compute both versions. Operating P/CF for comparability, free cash flow P/CF for strictness.
- Compare three ways. Industry peers, the company's own five-year range, and the growth rate of cash flows.
- Cross-examine earnings. If P/E and P/CF disagree sharply, investigate the gap before trusting either.
- Check durability. Ask what protects the cash stream: contracts, switching costs, brands, or nothing.
- Follow the allocation. Cash flowing to sensible reinvestment, debt reduction, or shareholder returns earns the multiple; cash flowing to empire-building does not.
Conclusion and next steps
The price to cash flow ratio prices a company against the cash its operations actually produce: share price over cash flow per share. It resists accounting cosmetics, shines on capital-heavy and cyclical businesses, and pairs naturally with P/E as a lie detector for earnings. Read it against peers, history, and growth, prefer multi-year averages, and let disagreements between cash and earnings guide your research.
Next steps: compute P/CF and P/E for three companies in one industry, note where the two ratios disagree, and investigate the widest gap. That exercise teaches earnings quality faster than any definition. For structured lessons on valuation ratios like price to cash flow, Finelo offers step-by-step investing education for beginners.
Frequently asked questions
What is a good price to cash flow ratio?
There is no universal threshold. Single-digit ratios often mark value territory and low teens sit near historical market norms, but the honest benchmark is the company's industry and its own history, adjusted for how fast cash flows are growing.
Why use price to cash flow instead of P/E?
Because cash resists accounting judgment better than earnings. Depreciation methods and one-off charges can swing net income without touching operating cash. P/CF is the standard cross-check when earnings quality is in doubt.
What is the difference between P/CF and price to free cash flow?
P/CF uses operating cash flow; the free cash flow version also subtracts capital spending. Free cash flow is the money truly available to owners, so its ratio is stricter, especially for capital-intensive businesses.
Can the price to cash flow ratio be negative?
If operating cash flow is negative, the ratio loses meaning rather than turning usefully negative. In that case, analyze why the business consumes cash and how long it can fund itself instead of forcing a multiple onto it.
pricecashflowratiodefinitioncalculation
Practice investing with Finelo
Build practical investing skills with guided lessons, simulator practice, and structured challenges.
About the author
Finelo Team
The Finelo Team creates practical investing and trading education designed to help beginners learn faster with structured challenges, simulator practice, and bite-sized lessons.
Keep reading — Related articles

Investing
Tax-gain harvesting vs. tax-loss harvesting
Compare realizing investment gains with realizing losses, including holding periods, wash sales, offsets, and portfolio tradeoffs.
Finelo Team

Investing
Stable value fund vs. money market fund
Compare investment structure, contract protections, transfer restrictions, net yields, and access inside a retirement account.
Finelo Team

Investing
Single-life vs. joint-life annuity
Compare income for one lifetime with continued payments to a survivor, using equal premiums and matching guarantee terms.
Finelo Team


