Methodology note: For a period's net income, use average total assets over the same period rather than only the ending balance. CFA Institute's financial-ratio list uses net income divided by average total assets. There is no universal 5% or 10% “good” threshold; asset age, write-downs, leases, goodwill, off-balance-sheet assets, leverage, and industry economics affect comparisons.
Return on Assets (ROA): Formula, Interpretation, and Limitations

Return on assets compares period net income with average total assets over the same period. A company earning $50 million on $1 billion of average assets has a 5% ROA. The ratio is an accounting return measure, not proof…
7 min read
Practice investing with Finelo
Build practical investing skills with guided lessons, simulator practice, and structured challenges.
Want to learn more?
Build practical investing skills with guided lessons, simulator practice, and structured challenges.
Explore FineloExplore Finelo's 28-day challenges
Turn learning into a daily habit with guided challenge paths.
Return on assets compares period net income with average total assets over the same period. A company earning $50 million on $1 billion of average assets has a 5% ROA. The ratio is an accounting return measure, not proof of management skill or a forecast of shareholder returns; peer definitions and asset accounting matter.
What return on assets tells you
Total assets are the complete toolkit a company works with: factories, software, inventory, receivables, cash. ROA grades how productively that toolkit is used. Two companies can report identical profits while one employs half the assets to do it; ROA exposes the difference instantly and crowns the leaner operator.
Because the ratio is size-neutral, it lets you compare a $2 billion regional firm against a $200 billion giant on equal terms. It is also a discipline check on growth: a company that doubles its asset base should roughly double its profit, and a falling ROA during expansion means new assets are earning less than the old ones, a subtle but serious warning.
How to calculate return on assets
ROA = (net income ÷ total assets) × 100
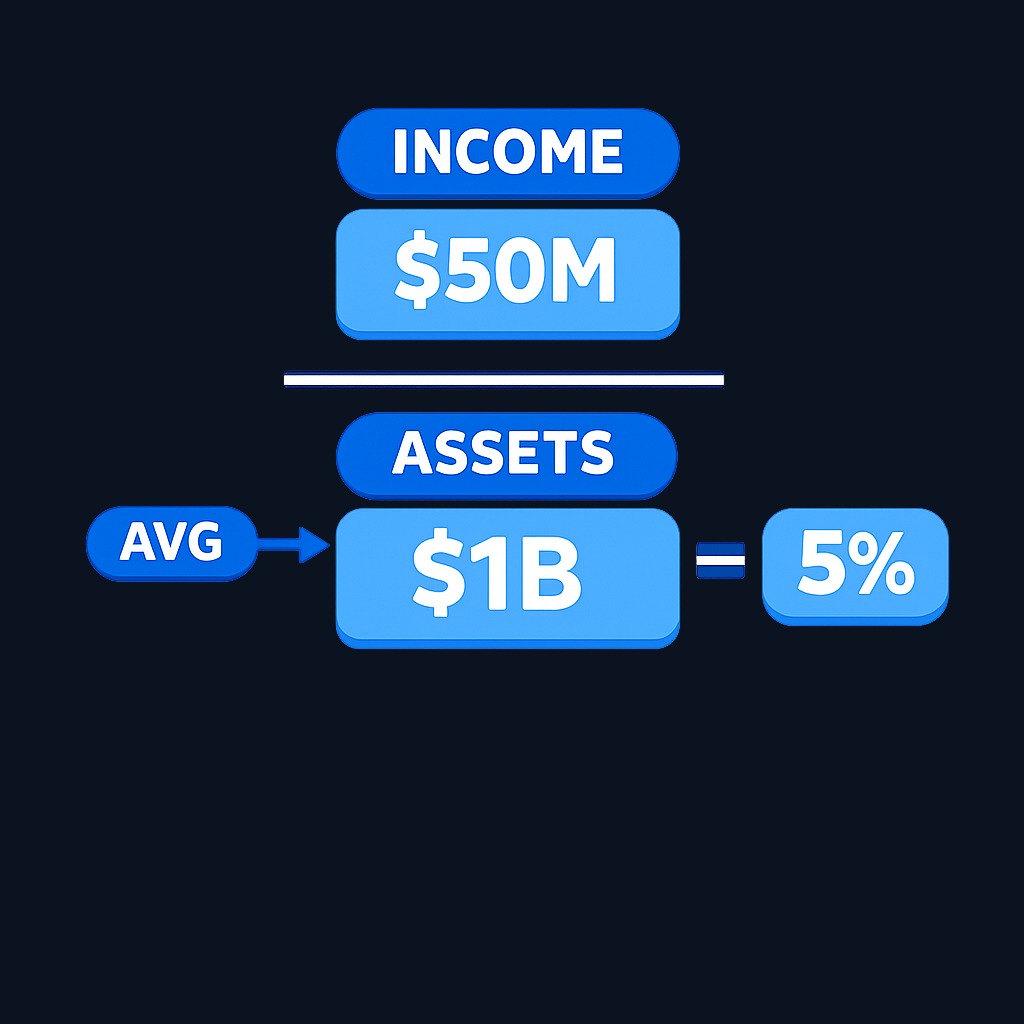
Net income comes from the income statement; total assets come from the balance sheet. Because income accrues over a year while assets are a point-in-time snapshot, many analysts use average total assets, the mean of beginning and ending balances, for a cleaner match. Both figures sit in any public company's annual filing, freely available through the SEC's EDGAR database.
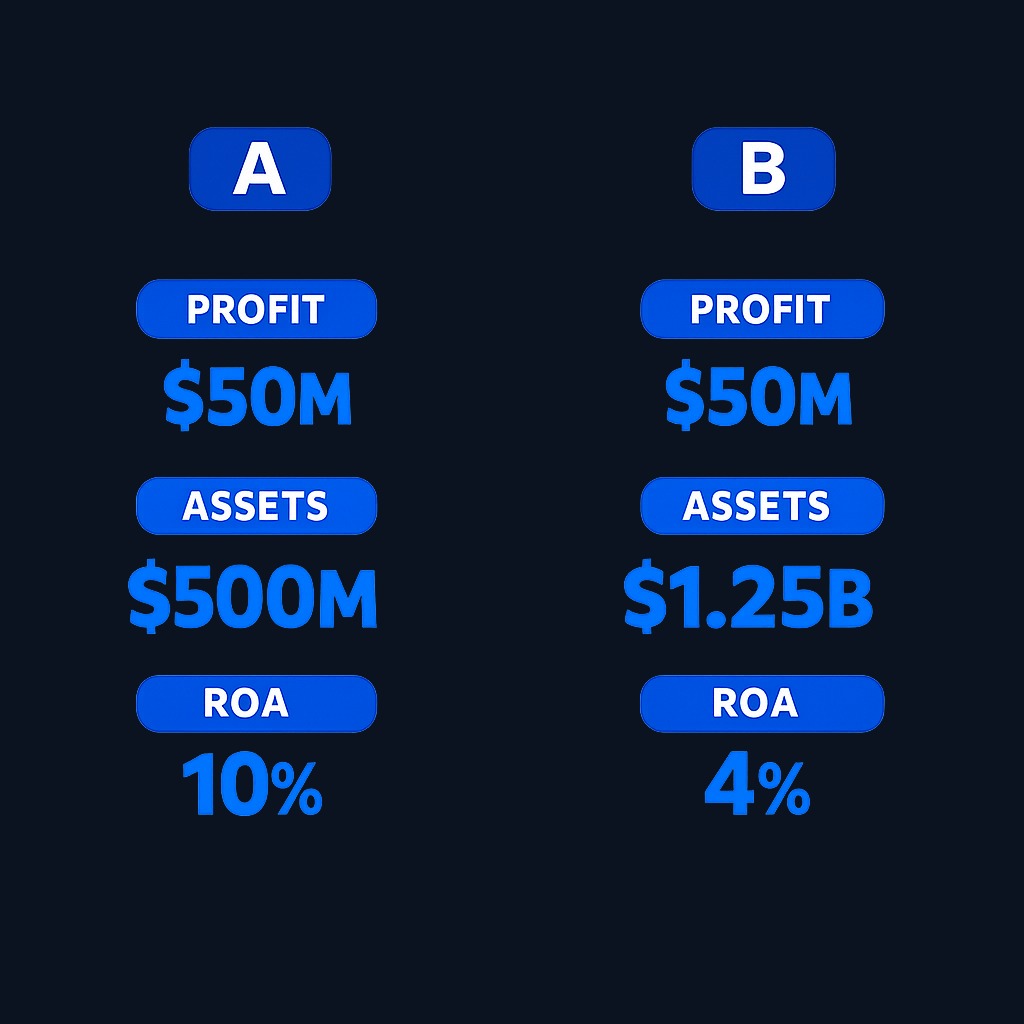
A worked example:
| Line item | Company A | Company B |
|---|---|---|
| Net income | $80 million | $80 million |
| Total assets | $800 million | $2,000 million |
| ROA | 10% | 4% |
Identical profits, very different efficiency. Company A generates the same earnings with 40% of the resources, which usually signals a structurally better business or sharper management, and it leaves more room to compound.
Why ROA matters for investors
- It normalizes for size. Profit dollars flatter big companies; ROA levels the field.
- It reveals management skill. Assets are what executives were given to work with; ROA is their report card.
- It flags capital intensity. Chronically low ROA industries need constant reinvestment just to stand still, which caps long-run shareholder returns.
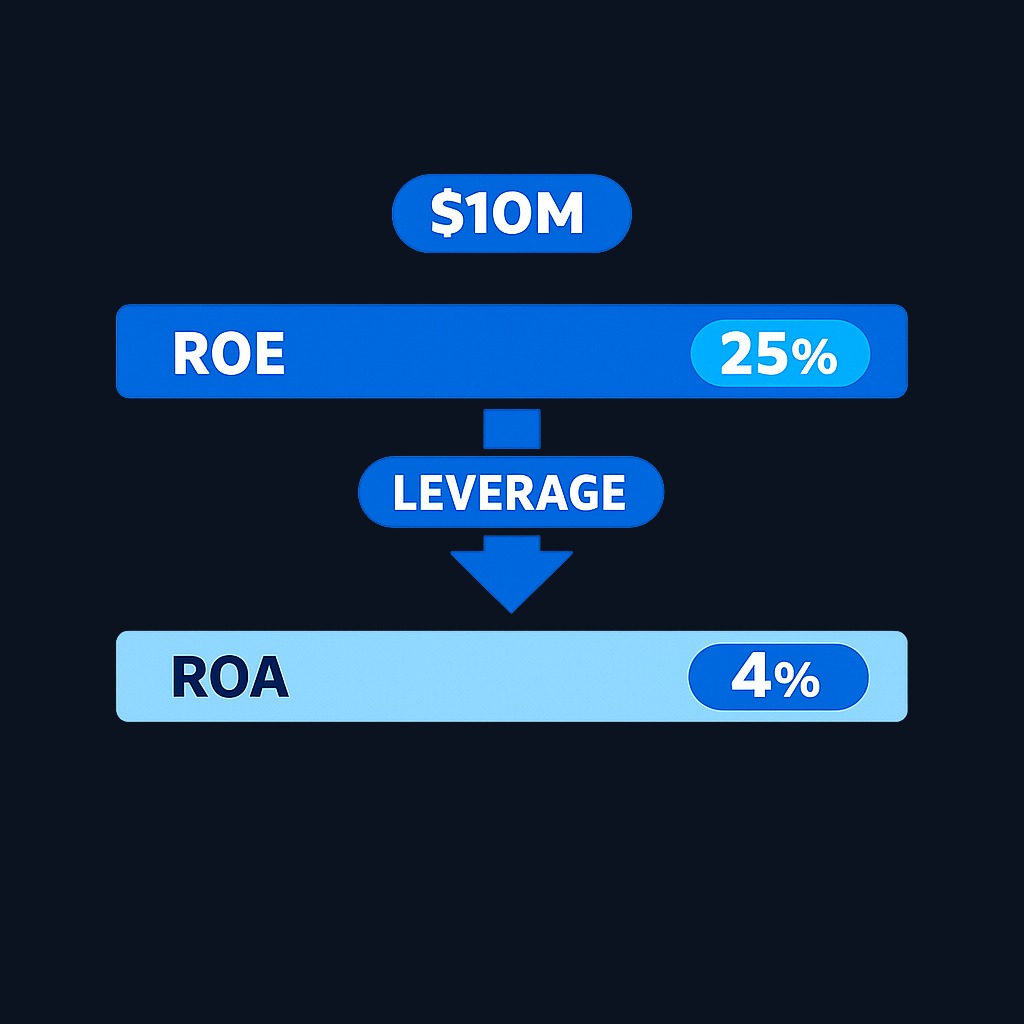
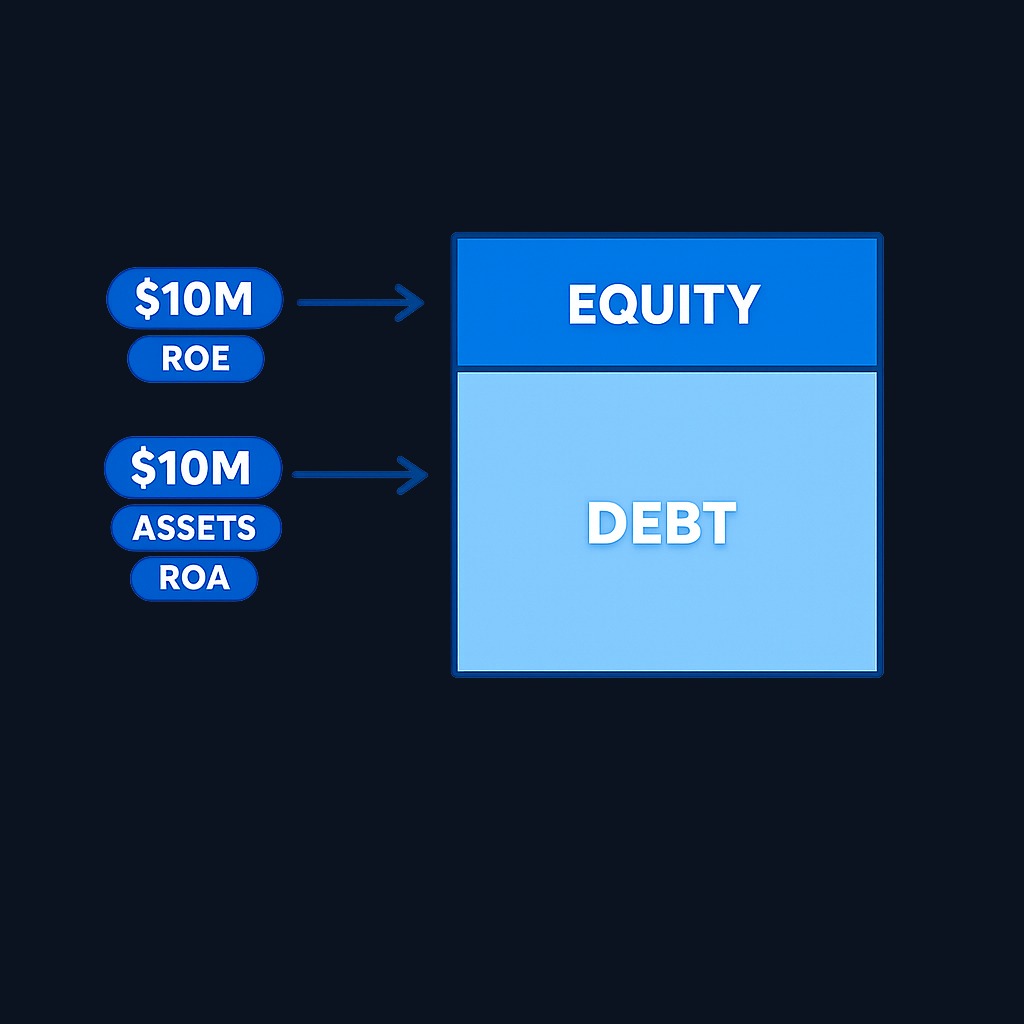
- It complements ROE. Return on equity can be inflated by borrowing; ROA cannot, because debt-funded assets stay in the denominator. A wide gap between ROE and ROA is a leverage signal worth investigating.
- It tracks trajectory. A rising ROA across five years means each new dollar of assets is pulling more weight, the quiet signature of a strengthening business.
Peer comparison without universal ROA cutoffs
Asset intensity and accounting differ too widely for a fixed sector table. Build a close peer set, use average assets and matching periods, and explain goodwill, acquisitions, asset age, impairments, leases, securitizations, and off-balance-sheet exposures. Banks require additional capital, credit-quality, and net-interest measures; a single ROA cannot establish safety or quality.
Common misconceptions about ROA
- "Higher is always better." Extremely high ROA can reflect underinvestment, aging assets fully depreciated on the books, or a windfall year. Durability matters more than a single spike.
- "ROA and ROE are interchangeable." ROE divides by shareholders' equity and rises with leverage; ROA divides by all assets and does not. Reading them together tells you how much of the equity return is borrowed.
- "Negative ROA means a doomed company." Young companies investing ahead of revenue often run negative ROA deliberately. The question is the path toward positive, not the current sign.
- "Book assets equal real assets." Brands, engineering culture, and network effects barely appear on balance sheets, so asset-light companies can show flattering ROA partly because accounting undercounts what they use.
- "One year is enough." Asset sales, write-downs, and tax one-offs distort single periods. Average three to five years before judging.
Practice investing with Finelo
Build practical investing skills with guided lessons, simulator practice, and structured challenges.
How to use ROA in practice
Three practical applications. First, peer ranking: line up an industry's players by five-year average ROA and investigate why the leader leads; the answer is usually pricing power, scale, or operating discipline you can verify elsewhere. Second, trend following within one company: pair ROA with revenue growth, and treat rising ROA during expansion as evidence that growth is profitable rather than bought. Third, cross-checking ROE: when a company boasts a 25% ROE but shows a 4% ROA, the spread is leverage, and leverage cuts both ways in downturns. For asset-heavy candidates, add debt maturities from the footnotes to see how fragile the financing of those assets is.
What to know before deciding
ROA is a comparison tool, not a verdict machine. It works best inside a small set of checks: growth to show demand, margins to show pricing, cash conversion to show earnings quality, and debt to show risk. Verify inputs in original filings rather than screeners, since data providers sometimes use differing asset averages. Most importantly, respect industry context; the ratio's whole value comes from comparing like with like over multiple years.
Decision framework: applying ROA to your analysis
| Your goal | How to apply ROA |
|---|---|
| Comparing two competitors | Use 5-year average ROA within the same industry |
| Judging growth quality | Watch whether ROA holds or rises as assets expand |
| Screening for quality | Filter for consistently top-quartile ROA versus peers |
| Assessing leverage risk | Compare ROA against ROE and investigate wide gaps |
FAQ
What is a good return on assets?
There is no universal 5% or 10% threshold. Compare consistently calculated multi-period ROA with close peers and adjust the interpretation for asset age, acquisitions, goodwill, leases, and industry economics.
What is the difference between ROA and ROE?
ROA divides profit by total assets; ROE divides it by shareholders' equity. Debt widens the gap between them, so the pair together reveals how much of the return depends on leverage.
Can ROA be negative?
Yes, whenever net income is negative. For early-stage companies that can be planned investment; for mature ones it warrants a close look at what broke.
Why do banks have such low ROA?
Banking runs on massive balance sheets and thin interest spreads. Near 1% ROA on an enormous asset base, multiplied by leverage, still produces respectable returns on equity.
Conclusion and next steps
Return on assets distills efficiency into one portable number: profit per dollar of resources. Calculate it from the filings, average it across years, benchmark it inside the industry, and read it beside ROE to see what leverage is hiding. Companies that hold top-tier ROA through full cycles are usually doing something structurally right. Your next step: pick three competitors in one industry, pull their filings from EDGAR, compute five-year average ROA for each, and rank them. The ranking, and your explanation of it, is real analysis.
InvestingFundamental AnalysisFinancial StatementsBeginner
Practice investing with Finelo
Build practical investing skills with guided lessons, simulator practice, and structured challenges.
About the author
Finelo Team
The Finelo Team creates practical investing and trading education designed to help beginners learn faster with structured challenges, simulator practice, and bite-sized lessons.
Keep reading — Related articles

Investing
Tax-gain harvesting vs. tax-loss harvesting
Compare realizing investment gains with realizing losses, including holding periods, wash sales, offsets, and portfolio tradeoffs.
Finelo Team

Investing
Stable value fund vs. money market fund
Compare investment structure, contract protections, transfer restrictions, net yields, and access inside a retirement account.
Finelo Team

Investing
Single-life vs. joint-life annuity
Compare income for one lifetime with continued payments to a survivor, using equal premiums and matching guarantee terms.
Finelo Team


