
RSI divergence is when price and the RSI move in opposite directions. The RSI, or Relative Strength Index, is a momentum indicator that tracks how forceful recent price moves have been. When price pushes to a new high or low but the RSI refuses to follow and prints a shallower extreme, the momentum behind the move is fading even as price keeps going. It is read as an early warning that a trend may be weakening, and depending on the type, may reverse or continue after a pause.
What Is RSI Divergence? How to Read It on a Chart
RSI divergence is when price and the RSI momentum indicator move in opposite directions. Learn the four types — regular and hidden, bullish and bearish — how to spot them, how reliable they are, and the mistakes beginners make.
10 min read
Practice trading with Finelo
Practice in a simulator, learn with bite-sized lessons, and build confidence before risking real money.
Want to learn more?
Practice in a simulator, learn with bite-sized lessons, and build confidence before risking real money.
Explore FineloExplore Finelo's 28-day challenges
Turn learning into a daily habit with guided challenge paths.
On its own it is a clue about momentum, not a timing tool, and it is famous for one uncomfortable habit: it can persist while price keeps trending, so acting too early is a known way to fight a trend and lose.
This guide is for beginners who want the version with the caveats attached: a quick RSI primer, the four divergence types in one table, how bullish and bearish setups differ, an honest look at reliability, and the mistakes that trip people up.
Divergence tells you momentum is fading. It does not tell you when, or whether, price will care.
A Quick RSI Primer
More precisely, the RSI is a momentum oscillator that plots on a scale from 0 to 100, usually in a panel beneath the price chart. The standard setting is a 14-period RSI — the default on most platforms and the one to learn on first. When people search for an "RSI divergence indicator" they usually mean this tool plus the reading, and some platforms bundle automated divergence detection that still needs the same context and confirmation you would apply by eye.
Two zones get the most attention: above 70 is traditionally overbought, below 30 oversold. Both are widely misunderstood. An overbought RSI does not mean price must fall, and in a strong trend the RSI can sit in either zone for a long stretch. For divergence, the exact value matters far less than the shape of the swing highs and lows, because divergence compares the direction of price swings to RSI swings, not a magic number.
How Divergence Forms: Price Versus Momentum
Every divergence compares two swing points. Find two swing lows (or two swing highs) on price, read the RSI at those same two moments, and compare direction. The disagreement is the whole signal: if price grinds to a lower low but the RSI at that second low is higher than at the first, momentum did not confirm the new low, because fewer sellers pushed price down this time. The same logic runs in reverse for highs.
Here is an illustrative RSI divergence example: In a downtrend, price falls from a low of 100 to a lower low of 96, while the RSI at those lows reads 25 then 32. Price made a lower low but RSI made a higher low — a regular bullish divergence.
Two cautions come with it. Matching the swing points is the part most beginners get wrong, calling divergence on instinct rather than lining up the same two swings on both. And it is somewhat subjective: two people can draw the swings differently and disagree about whether it is even there, which is why context and a checklist beat eyeballing.
The Four RSI Divergence Types
Most beginner articles teach two types, regular bullish and regular bearish. The complete framework has four: two hinting at reversal, two at continuation. This table is the quick reference people are really after when they search for an RSI divergence cheat sheet.
| Type | Price does | RSI does | Appears | Hints at |
|---|---|---|---|---|
| Regular bullish | Lower low | Higher low | End of a downtrend | Possible upside reversal |
| Regular bearish | Higher high | Lower high | End of an uptrend | Possible downside reversal |
| Hidden bullish | Higher low | Lower low | Pullback within an uptrend | Uptrend continuation |
| Hidden bearish | Lower high | Higher high | Bounce within a downtrend | Downtrend continuation |
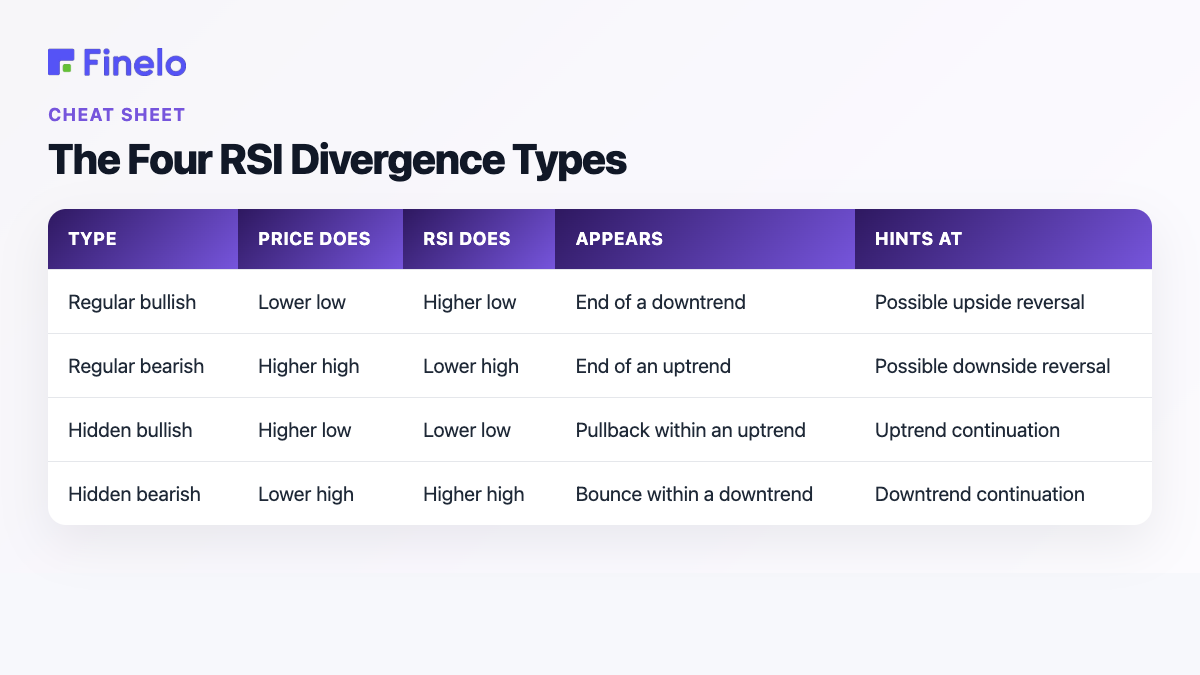
The single most useful thing to memorize sits in that table: regular divergence hints at reversal; hidden divergence hints at continuation. Everything else is which direction and where it shows up.
Notice the trap built into the bullish rows. Regular bullish needs price to make a lower low, while hidden bullish needs a higher low. Same word, opposite construction, opposite meaning. Reading hidden RSI divergence as the regular kind, or the reverse, is the classic beginner error — which is why the trend context in the fourth column matters as much as the shape.
A regular bullish divergence means the most at the tail end of a genuine downtrend, near support or a prior swing low, while a regular bearish divergence reads more convincingly at the top of a real uptrend, near resistance. The same divergence in the middle of a choppy range is far weaker, because there is no established trend for it to warn against.
Context: Trend, Timeframe, and Confirmation
Divergence is context-dependent, and three things decide whether a reading is worth anything.
Trend and location come first: regular divergence belongs at trend extremes and hidden divergence inside pullbacks, so a reading only carries weight where its type belongs, and one at a level price has respected before is stronger than one in open space.
Timeframe is second, and matters more than beginners expect: the lower the timeframe, the more the RSI whipsaws and the more meaningless divergences appear and vanish. Higher timeframes such as the daily produce fewer but cleaner signals, while a one-minute chart manufactures divergence almost continuously.
Confirmation is third — the practical answer to divergence's biggest weakness. Because the signal can persist while price keeps trending, most traders wait for price itself to agree, through a candlestick signal, a small pattern, or a break of a short-term level in the divergence's direction. Waiting costs some of the move, but filters out a large share of divergences that looked convincing and led nowhere.
A divergence without confirmation is a hypothesis. Confirmation is the market agreeing to test it.
Practice trading with Finelo
Practice in a simulator, learn with bite-sized lessons, and build confidence before risking real money.
How Reliable Is RSI Divergence?
Conditional, and routinely oversold in trading content. Divergence can remain in place far longer than seems reasonable, repeating while a strong trend simply continues. In momentum-driven markets, price can print divergence after divergence and never reverse, which is why acting on the first sign without confirmation is one of the fastest ways to stand in front of a trend.
Take that as calibration, not discouragement: it makes divergence a warning to look closer, not a trigger to act. Any performance figure quoted should arrive with its market, timeframe, RSI setting, sample size, and confirmation rule. Strip those away and a "win rate" is close to meaningless.
There is also a structural limitation: divergence gives no price target. It projects no measured move, so exits have to come from other tools — support and resistance, patterns, or price action. It is a momentum warning, not a complete trade.
The reading earns more trust after a clear trend, at a key level, on a higher timeframe, and with confirmation. It earns much less on short timeframes, in choppy ranges, and when the swing points were drawn to fit the divergence someone wanted, which its subjectivity makes easy.
A Recognition Checklist
Use this as a learning aid, not a trade trigger. These are the questions worth asking before concluding a divergence means anything.
- Swing points: Are there two clear swing highs, or two clear swing lows, on both price and RSI to compare?
- Type: Is it regular or hidden, and bullish or bearish? Regular hints at reversal, hidden at continuation.
- Trend context: Does the divergence sit where that type usually appears — regular at an extreme, hidden in a pullback?
- Level: Is it near support, resistance, or a prior swing point?
- Timeframe: Are you on a higher timeframe rather than a noisy intraday chart?
- Confirmation: Has price itself agreed yet, through a candle, a pattern, or a level break?
- Persistence: Are you aware the divergence could repeat without a reversal?
- Invalidation: Do you know what price action would prove the read wrong?
Common RSI Divergence Mistakes to Avoid
The most common mistake is confusing regular and hidden divergence — trading a continuation signal as though it were a reversal or the other way around. The anchor is the one from the table: regular hints at reversal, hidden at continuation.
The rest compound each other:
- Acting on divergence alone, before price agrees, fights momentum in a trend where the signal can persist.
- Over-reading short timeframes adds phantom divergences that are mostly noise.
- Drawing the swing points to fit the divergence you hoped for is wishful thinking.
- Because divergence has no target, using it without a plan for confirmation, invalidation, and risk turns a momentum clue into a guess.
Practice Before You Risk Anything
If you are learning RSI divergence, do not start by hunting a live trade. Collect examples first: all four types on historical charts, plus the important ones where divergence appeared and price simply kept trending. Hide the future price action, judge each reading on what was visible at the time, then check what happened. That teaches the pattern — and its failures — far faster than any cheat sheet.
For the candlestick literacy underneath most confirmation signals, start with what a doji candle is, the hammer, or the engulfing candle. Pair momentum warnings with structure using the chart patterns cheat sheet. Finelo focuses on investment learning and financial education (Finelo). Final decisions are always yours. An indicator is a way of reading a chart, not a substitute for judgment.
This material is educational and is not personalized financial advice. Trading involves risk, and indicator signals can fail.
Frequently asked questions
What is RSI divergence?
It is when price and the RSI momentum indicator move in opposite directions — for example, price making a new low while RSI makes a higher low. That disagreement suggests the momentum behind the move is fading, and is read as a possible early warning of a reversal, or with hidden divergence, a continuation.
Is RSI divergence bullish or bearish?
Either, depending on the type. Regular bullish divergence (price lower low, RSI higher low) hints at an upside reversal. Regular bearish (price higher high, RSI lower high) hints at a downside reversal. Hidden divergence flips the logic to signal continuation. The type and trend context decide the direction.
What is the difference between regular and hidden divergence?
Regular divergence hints at a reversal and appears at the end of a trend. Hidden divergence hints at a continuation and appears during a pullback or bounce inside a trend. They are mirror images in construction, so the safe shorthand is: regular means reversal, hidden means continuation.
How reliable is RSI divergence?
On its own, not very. It is a momentum warning, not a precise timing tool, and it can persist in a strong trend without price turning. It becomes more meaningful with trend context, at a key level, on a higher timeframe, and with confirmation. Be skeptical of quoted win rates offered without a transparent, sourced test.
What RSI setting is best for divergence?
The standard 14-period RSI is the usual starting point, and for divergence the exact setting matters less than the shape of the swing highs and lows. Some traders try shorter or longer periods, but changing the setting changes the signals, so beginners are best served learning on the default first.
How do I spot RSI divergence on a chart?
Mark two swing highs (or two swing lows) on price, then look at the RSI at those same points. If price made a higher high but RSI made a lower high, that is bearish divergence; if price made a lower low but RSI made a higher low, that is bullish divergence. Then check trend, timeframe, and confirmation before drawing any conclusion.
Chart AnalysisRSITechnical AnalysisBeginner
Practice trading with Finelo
Practice in a simulator, learn with bite-sized lessons, and build confidence before risking real money.
About the author
Finelo Team
The Finelo Team creates practical investing and trading education designed to help beginners learn faster with structured challenges, simulator practice, and bite-sized lessons.
Keep reading — Related articles
Chart Analysis
Chart Patterns Cheat Sheet: A Guide to the Most Common Trading Patterns
A chart patterns cheat sheet covering the most common continuation and reversal patterns — bullish, bearish, and neutral — with a plain-English meaning for each, scannable tables, and a free downloadable PDF.
Finelo Team
Chart Analysis
The Shooting Star Candlestick Pattern: What It Is and How to Trade It
A shooting star candlestick pattern is a potential bearish reversal signal that appears after an upward price move. It has a small real body near the candle’s low, a long upper shadow, and little or no lower shadow…
Finelo Team
Chart Analysis
What Is an Engulfing Candle? How to Read the Two-Candle Reversal
An engulfing candle is a two-candle pattern in which the second candle's real body completely covers the body of the first. Learn bullish vs bearish engulfing, confirmation, and how it differs from the harami and doji.
Finelo Team