
This chart patterns cheat sheet gathers the most common price patterns — the multi-bar shapes traders watch on a chart — into one place. Each entry gives a plain-English note on what the pattern is said to signal, plus a link to a full explainer where one exists. It is built to be scanned: find the shape in front of you, read the one-line meaning, then open the detailed guide when you want the structure, the psychology, and the limits.
Chart Patterns Cheat Sheet: A Guide to the Most Common Trading Patterns
A chart patterns cheat sheet covering the most common continuation and reversal patterns — bullish, bearish, and neutral — with a plain-English meaning for each, scannable tables, and a free downloadable PDF.
12 min read
Practice trading with Finelo
Practice in a simulator, learn with bite-sized lessons, and build confidence before risking real money.
Want to learn more?
Practice in a simulator, learn with bite-sized lessons, and build confidence before risking real money.
Explore FineloExplore Finelo's 28-day challenges
Turn learning into a daily habit with guided challenge paths.
This page is for beginners and early-intermediate learners who are teaching themselves to read charts and want a reference to come back to. The recommended next step is simple: skim the tables below, download the free printable PDF to keep on hand, and treat every pattern as a clue to investigate and confirm, not a signal to act on by itself.
A cheat sheet helps you recognize a shape, not predict a market. This page is for learning only and is not financial advice. Trading involves risk, chart patterns can fail, and no pattern predicts what a market will do next.
How to Read a Chart Pattern
A chart pattern is a recognizable shape formed by price over many bars, usually bounded by at least two lines: support and resistance, or two trendlines. The idea is that these shapes reflect a repeating tug-of-war between buyers and sellers, and that the way a shape resolves can hint at what might come next.
A handful of ideas make every pattern in the tables below easier to use:
- Breakout: Price moves decisively beyond one of the pattern's boundaries. Most traders treat a pattern as incomplete until that breakout happens, ideally on rising volume.
- Confirmation: Waiting for that breakout — and sometimes a retest of the broken level — rather than anticipating it.
- Measured move: A common way to estimate a target: take the height of the pattern and project it from the breakout point.
- Fractal: The same shapes appear on weekly, daily, and intraday charts, though higher timeframes tend to be cleaner.
How the Patterns Are Organized
There are two useful ways to sort chart patterns, and this sheet uses both.
By type, patterns are either continuation — a pause that tends to resolve in the direction of the existing trend — or reversal — a shape that tends to mark the end of a trend. Some are bilateral, meaning they can break either way, so you wait for the breakout to reveal the direction. By bias, patterns are grouped as bullish, bearish, or neutral.
One reminder before the tables: bias labels describe what a pattern is commonly said to signal, not what will happen. A pattern in the wrong context — against a strong trend, on thin volume, or before any breakout — often means very little. Context and confirmation matter more than the label, and even a textbook pattern can fail.
Bullish Chart Patterns
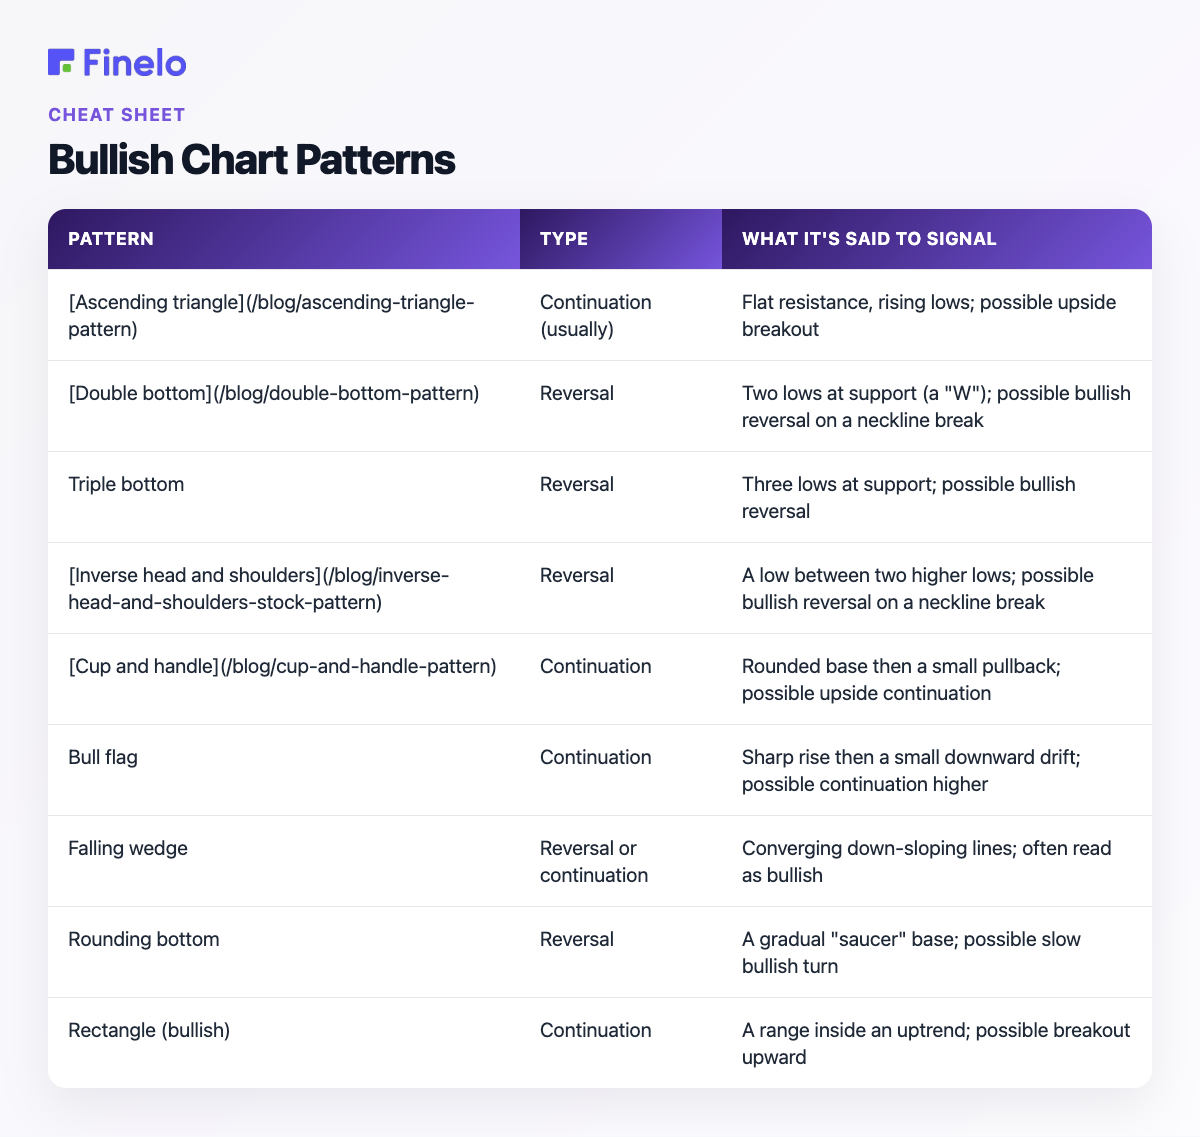
These are commonly read as possible upside moves, either continuations within an uptrend or reversals after a decline. Each linked name opens its full explainer where available.
| Pattern | Type | What it's said to signal |
|---|---|---|
| Ascending triangle | Continuation (usually) | Flat resistance, rising lows; possible upside breakout |
| Double bottom | Reversal | Two lows at support (a "W"); possible bullish reversal on a neckline break |
| Triple bottom | Reversal | Three lows at support; possible bullish reversal |
| Inverse head and shoulders | Reversal | A low between two higher lows; possible bullish reversal on a neckline break |
| Cup and handle | Continuation | Rounded base then a small pullback; possible upside continuation |
| Bull flag | Continuation | Sharp rise then a small downward drift; possible continuation higher |
| Falling wedge | Reversal or continuation | Converging down-sloping lines; often read as bullish |
| Rounding bottom | Reversal | A gradual "saucer" base; possible slow bullish turn |
| Rectangle (bullish) | Continuation | A range inside an uptrend; possible breakout upward |
Bearish Chart Patterns
These are commonly read as possible downside moves, either continuations within a downtrend or reversals after an advance.
| Pattern | Type | What it's said to signal |
|---|---|---|
| Descending triangle | Continuation (usually) | Flat support, falling highs; possible downside breakout |
| Double top | Reversal | Two highs at resistance (an "M"); possible bearish reversal on a neckline break |
| Triple top | Reversal | Three highs at resistance; possible bearish reversal |
| Head and shoulders | Reversal | A high between two lower highs; possible bearish reversal on a neckline break |
| Bear flag | Continuation | Sharp drop then a small upward drift; possible continuation lower |
| Rising wedge | Reversal or continuation | Converging up-sloping lines; often read as bearish |
| Rounding top | Reversal | A gradual dome; possible slow bearish turn |
| Rectangle (bearish) | Continuation | A range inside a downtrend; possible breakout downward |
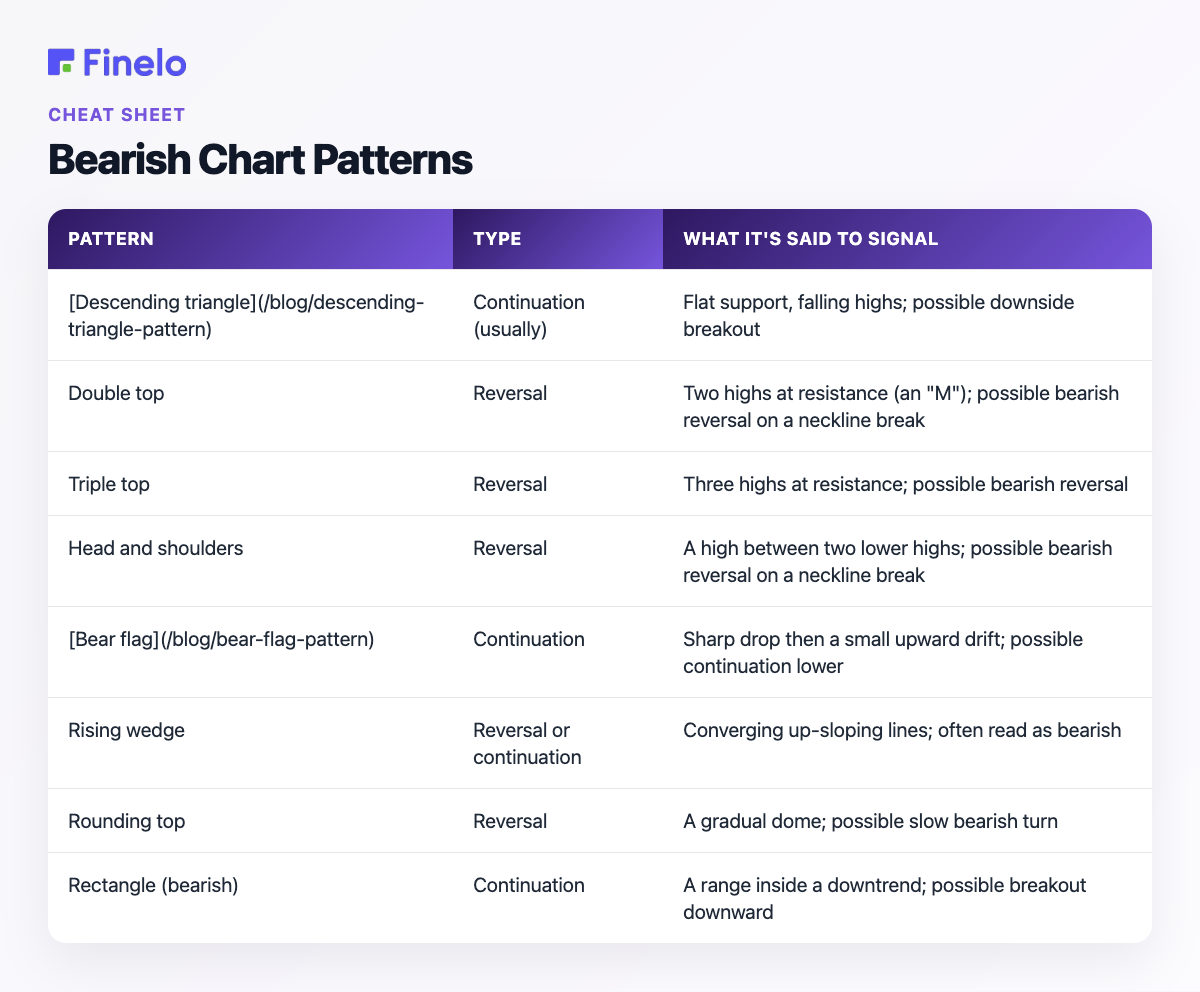
Bearish and short-side setups carry their own risks, including sharp counter-rallies, so treat these shapes as educational examples to study, not instructions to act on.
Practice trading with Finelo
Practice in a simulator, learn with bite-sized lessons, and build confidence before risking real money.
Neutral and Bilateral Patterns
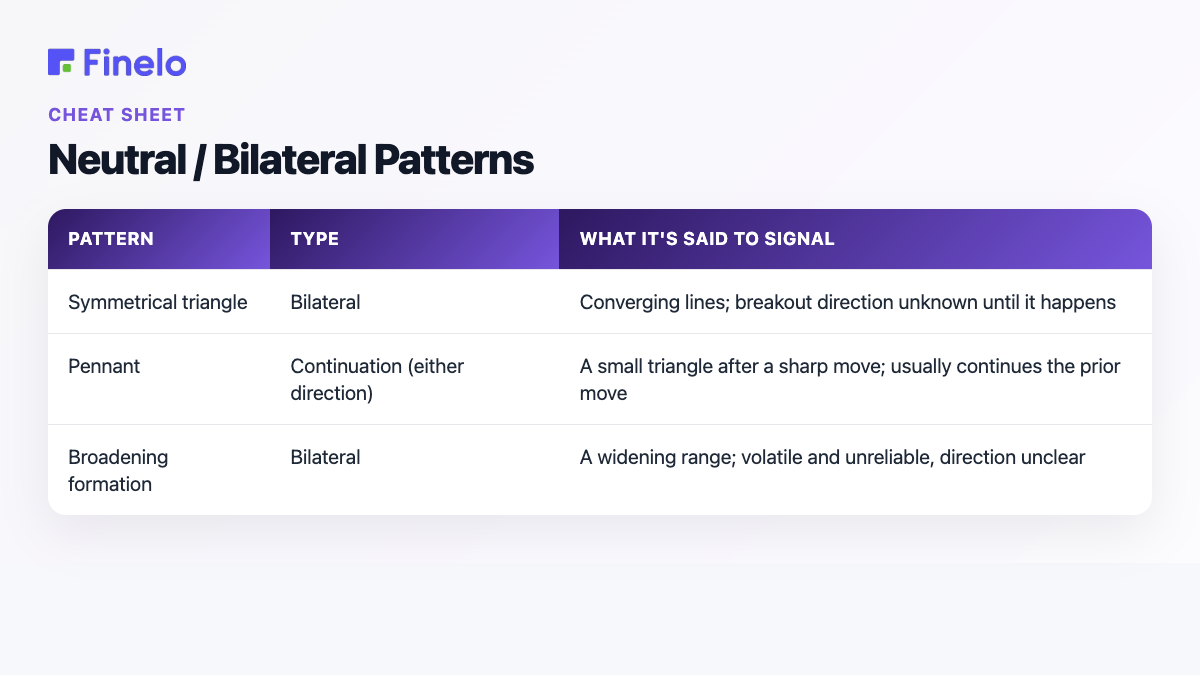
These can break either way. The pattern itself does not tell you the direction. You wait for the breakout and confirm it.
| Pattern | Type | What it's said to signal |
|---|---|---|
| Symmetrical triangle | Bilateral | Converging lines; breakout direction unknown until it happens |
| Pennant | Continuation (either direction) | A small triangle after a sharp move; usually continues the prior move |
| Broadening formation | Bilateral | A widening range; volatile and unreliable, direction unclear |
How Reliable Are Chart Patterns?
This is the part most cheat sheets skip. Chart patterns are not guarantees. They are probabilities at best, and every one of them can fail. A shape that looks textbook can break the "wrong" way, or break the expected way and then reverse straight back through the level — a false or failed breakout.
Patterns tend to carry more weight when several things line up: a clear prior trend for context, a clean breakout beyond the pattern's boundary, above-average volume on that breakout, a higher timeframe, and sometimes a successful retest of the broken level. Even then, none of it makes the outcome certain.
It is also worth being honest about human bias. It is easy to see patterns that are not really there, to trust market lore without evidence, and to cling to a pattern's original target after conditions have changed. Be especially skeptical of any source quoting a precise win rate without telling you the market, timeframe, sample size, and rules behind the number.
A pattern is a clue to confirm, not a signal to obey.
How to Actually Use This Cheat Sheet
A cheat sheet is a recognition aid, not a trading system. The most useful way to use it is to build familiarity, not to memorize names and act on the first shape you spot.
- Identify: When you see a shape you do not recognize, find the closest match in the tables above.
- Read the context: Check the prior trend, the support and resistance levels, and the volume. The same shape means different things in different places.
- Open the explainer: Follow the link to the full article for the structure, the measured move, and the limits.
- Wait for the breakout: A pattern is not "activated" until price breaks its boundary, ideally on volume. Anticipating the breakout is where many beginners get trapped.
- Practice on history: Scroll back through charts, hide the future, and test whether you would have recognized the pattern and what happened next — including the failures.
Recognition is a skill you build, not a list you memorize.
Download the Free Printable PDF
Want the sheet to keep? Download the original Finelo chart patterns cheat sheet (PDF) and save it to your desktop, or print it as a quick reference while you learn. It covers the same bullish, bearish, and neutral patterns shown above, grouped for fast scanning.
Next Steps
A cheat sheet is a starting point, not a destination. Once a pattern catches your eye, open its full explainer to learn the structure, the breakout logic, the measured-move target, and the ways it commonly fails. Over time, the goal is to read charts fluently enough that you rarely need the sheet.
Explore the individual guides linked above — such as the ascending triangle, double bottom, cup and handle, and bear flag — plus related candle literacy like the doji, hammer, and engulfing. For a broader bias overview, see bullish and bearish trading patterns.
Finelo focuses on investment learning and financial education, making this kind of structured chart-reading exercise suitable for building foundational knowledge (Finelo). Final decisions are always yours. A pattern is a tool for thinking more clearly, not a substitute for judgment.
Frequently asked questions
What are the main chart patterns?
They fall into reversal and continuation groups. Reversal patterns include head and shoulders, double and triple tops and bottoms, and rounding tops and bottoms. Continuation patterns include flags, pennants, rectangles, cup and handle, and ascending or descending triangles. Symmetrical triangles and wedges can break either way.
Which chart patterns are bullish and which are bearish?
Common bullish examples include the ascending triangle, double bottom, inverse head and shoulders, cup and handle, and bull flag. Common bearish examples include the descending triangle, double top, head and shoulders, and bear flag. Neutral patterns like the symmetrical triangle have no built-in direction until price breaks out.
What is the difference between a continuation and a reversal pattern?
A continuation pattern is a pause inside an existing trend that tends to resolve in the same direction. A reversal pattern tends to mark the end of a trend, with price turning the other way after the breakout. The trend before the pattern is what signals which role it is playing.
How reliable are chart patterns?
Their reliability is conditional and often overstated. Patterns tend to matter more with a clear trend, a confirmed breakout, volume support, and a higher timeframe, and less without them. False breakouts are common. Treat any pattern as one clue among many, and be skeptical of precise win-rate claims that arrive without a sourced test.
Is there a free or printable chart patterns cheat sheet?
Yes. You can download the original Finelo chart patterns cheat sheet as a printable PDF from this page and keep it for reference. It is an educational summary, not trading advice, meant to help you recognize patterns while you learn, not to tell you when to buy or sell.
What is a measured-move target?
It is a common way to estimate how far price might travel after a breakout. You measure the height of the pattern — for example, the distance from a double bottom's lows to its neckline — then project that distance from the breakout point. It is an educational guideline, not a prediction.
How is this different from candlestick patterns?
This sheet covers multi-bar price patterns — the larger shapes like triangles, double tops and bottoms, head and shoulders, flags, and wedges. Candlestick guides cover single-candle and few-candle shapes like the doji, hammer, and engulfing. They complement each other, and many traders use both together.
Chart AnalysisChart PatternsTechnical AnalysisBeginner
Practice trading with Finelo
Practice in a simulator, learn with bite-sized lessons, and build confidence before risking real money.
About the author
Finelo Team
The Finelo Team creates practical investing and trading education designed to help beginners learn faster with structured challenges, simulator practice, and bite-sized lessons.
Keep reading — Related articles
Chart Analysis
What Is RSI Divergence? How to Read It on a Chart
RSI divergence is when price and the RSI momentum indicator move in opposite directions. Learn the four types — regular and hidden, bullish and bearish — how to spot them, how reliable they are, and the mistakes beginners make.
Finelo Team
Chart Analysis
The Shooting Star Candlestick Pattern: What It Is and How to Trade It
A shooting star candlestick pattern is a potential bearish reversal signal that appears after an upward price move. It has a small real body near the candle’s low, a long upper shadow, and little or no lower shadow…
Finelo Team
Chart Analysis
What Is an Engulfing Candle? How to Read the Two-Candle Reversal
An engulfing candle is a two-candle pattern in which the second candle's real body completely covers the body of the first. Learn bullish vs bearish engulfing, confirmation, and how it differs from the harami and doji.
Finelo Team