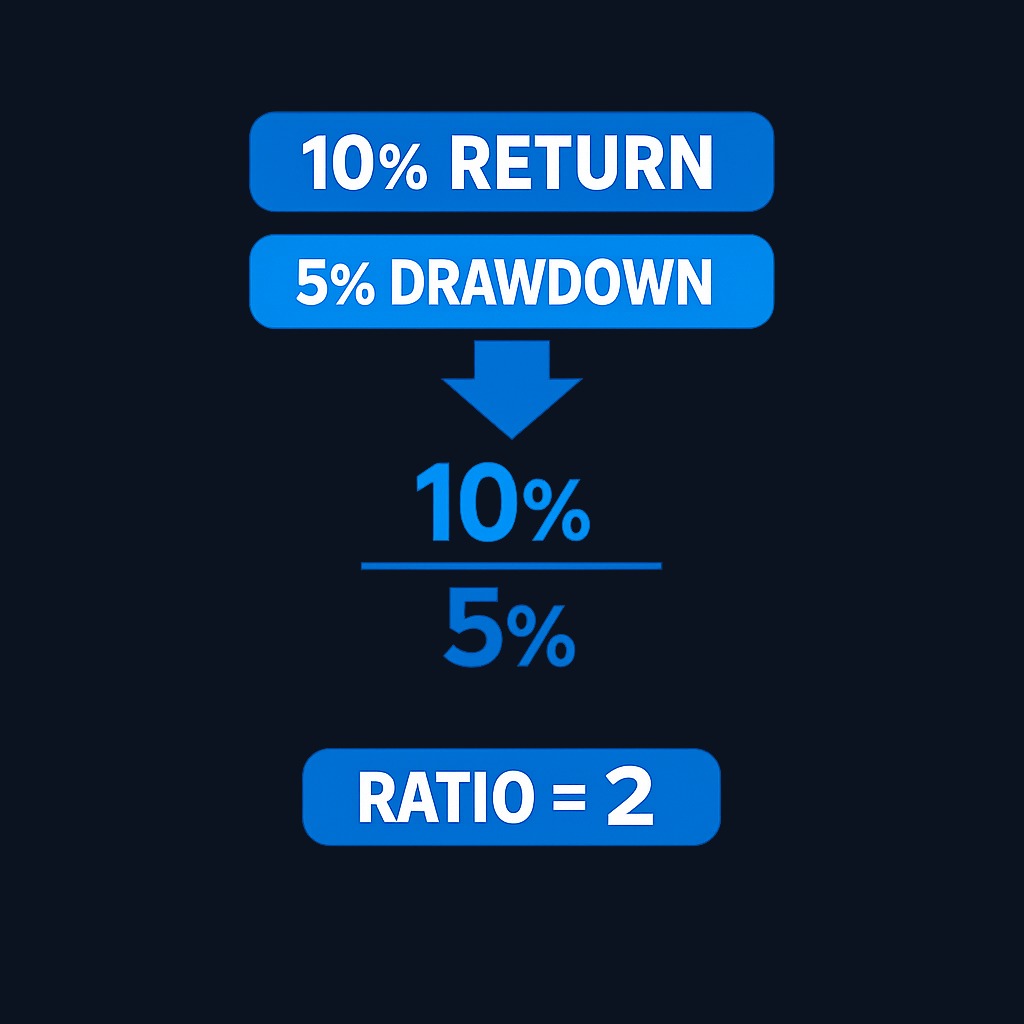
The Calmar ratio measures return against pain: it divides a fund's annualized return by its maximum drawdown over the same period, typically the trailing three years. A Calmar ratio of 2 means the strategy earned twice its worst peak-to-trough loss each year. Higher is better, because it signals more return per unit of drawdown risk.
The Calmar Ratio: A Key Metric for Evaluating Investment Performance
The Calmar ratio measures return against pain: it divides a fund's annualized return by its maximum drawdown over the same period, typically the trailing three years. A Calmar ratio of 2 means the strategy earned twice…
6 min read
Practice investing with Finelo
Build practical investing skills with guided lessons, simulator practice, and structured challenges.
Want to learn more?
Build practical investing skills with guided lessons, simulator practice, and structured challenges.
Explore FineloExplore Finelo's 28-day challenges
Turn learning into a daily habit with guided challenge paths.
This page is for investors and traders who care about how deep losses get, not just how volatile returns are. You will find the formula, a worked example, comparisons with the Sharpe and Sortino ratios, and the metric's blind spots. Everything here is educational, not financial advice.
How to calculate the Calmar ratio
The formula:
Calmar ratio = annualized rate of return ÷ maximum drawdown
Maximum drawdown is the largest percentage decline from a peak to the following trough in the account or fund value. A step-by-step example:
- Pick the window. The convention in managed-futures and hedge fund reporting is 36 months, though any consistent period works for comparison.
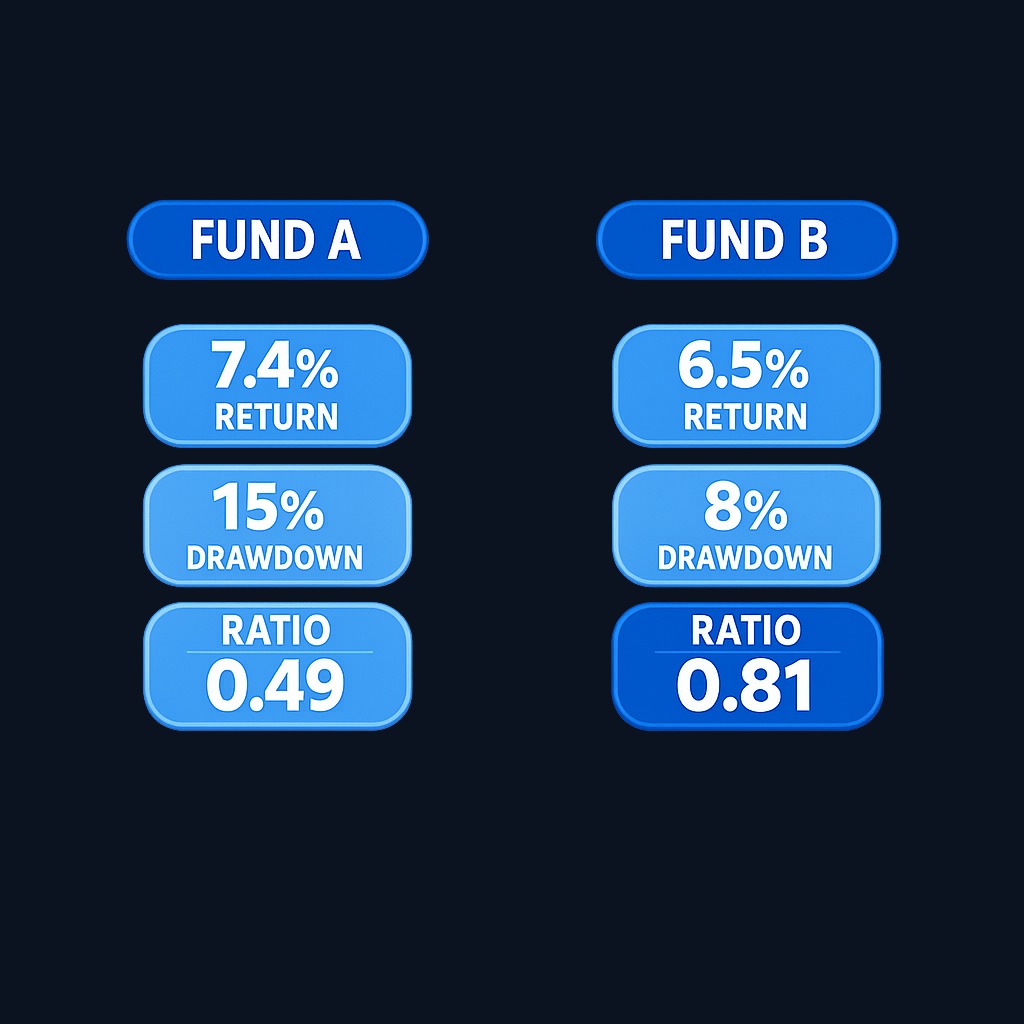
- Compute annualized return. Suppose a fund returned 24% over three years, about 7.4% annualized.
- Find the maximum drawdown. During those years the fund fell from a peak of $120,000 to $102,000 before recovering, a 15% drawdown.
- Divide. 7.4 ÷ 15 = a Calmar ratio of roughly 0.49.
Compare that with a steadier fund earning 6.5% annualized with an 8% maximum drawdown: 6.5 ÷ 8 = 0.81. The second fund made less but kept losses far shallower, and the Calmar ratio rewards exactly that trade-off. Portfolio trackers and fund fact sheets often publish drawdown data, so the inputs are usually easy to collect.
Understanding the components: return and drawdown
The numerator is straightforward compounding arithmetic. The denominator is the psychological one. Maximum drawdown captures the single worst stretch an investor actually lived through: the moment the account statement looked most broken. Two strategies with identical volatility can have very different drawdowns if one tends to fall in long, unbroken slides while the other chops sideways.
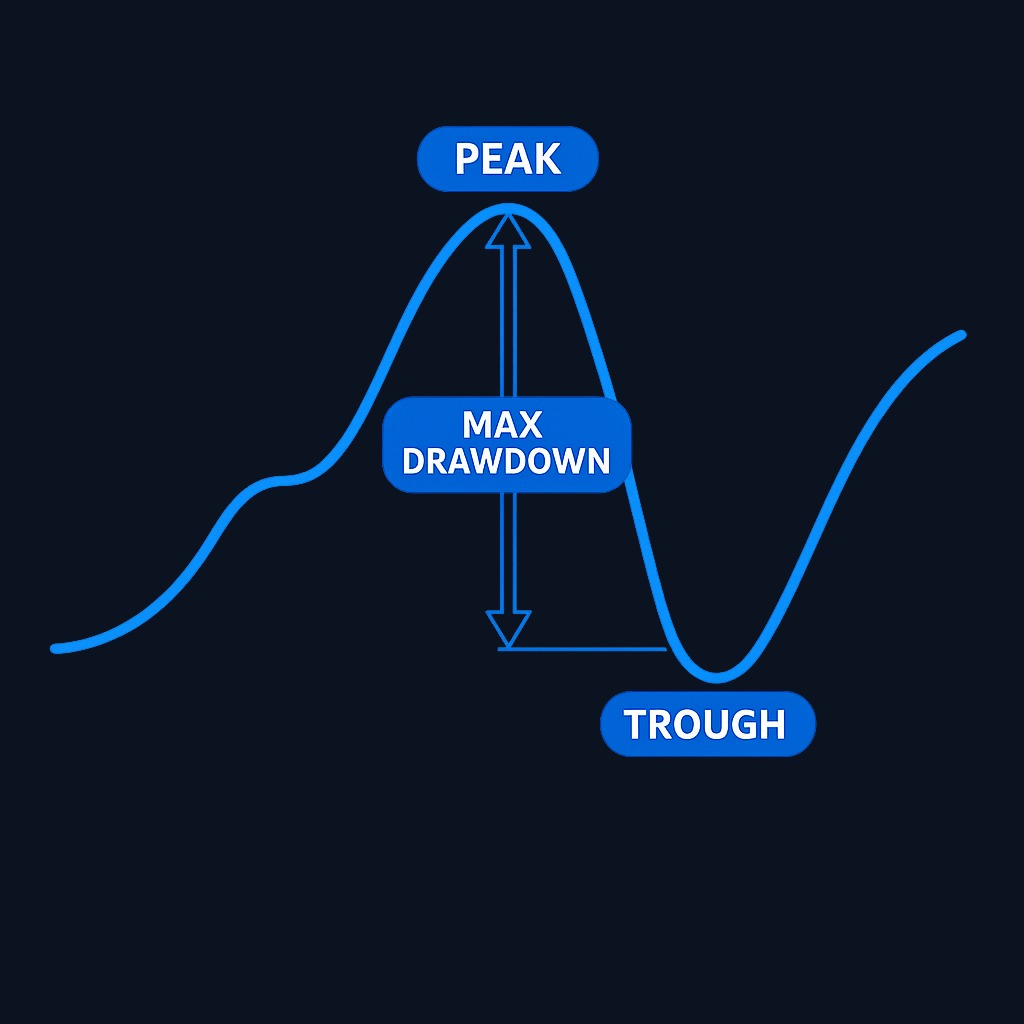
That is the Calmar ratio's core argument: investors abandon strategies during deep drawdowns, so the depth of the worst loss is a more behaviorally honest risk measure than average wiggle. A strategy an investor cannot hold through its worst stretch delivers its paper returns to someone else.
Comparing the Calmar ratio with other performance metrics
| Metric | Risk measure in denominator | What it rewards |
|---|---|---|
| Calmar ratio | Maximum drawdown | Shallow worst-case losses |
| Sharpe ratio | Standard deviation of returns | Low overall volatility |
| Sortino ratio | Downside deviation only | Low downside volatility |
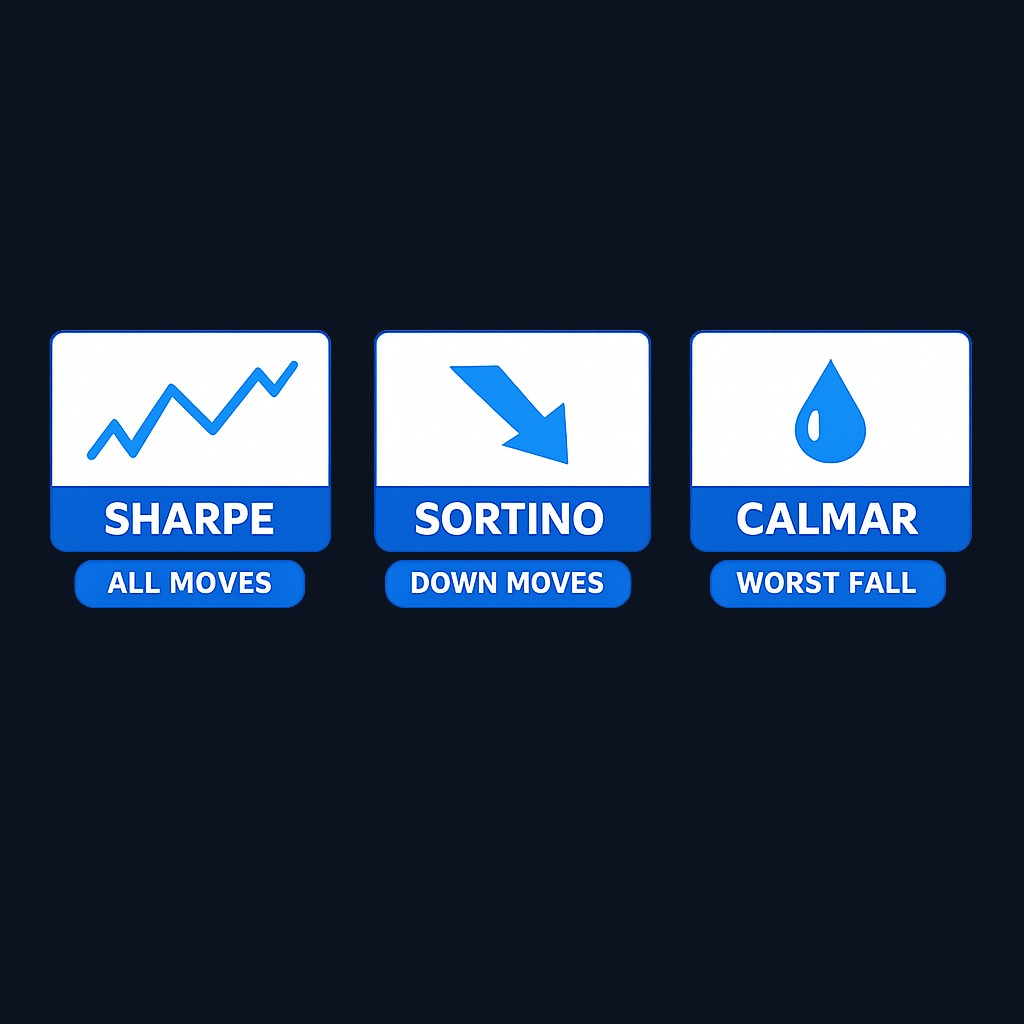
The Sharpe ratio penalizes upside and downside swings alike, and its excess-return numerator is measured against a risk-free baseline such as short-term Treasury yields tracked in the Federal Reserve's H.15 selected interest rates release. The Sortino ratio narrows the penalty to downside moves. The Calmar ratio goes a step further and asks only about the single worst episode. In practice the three disagree most on strategies with rare but severe losses: an approach that grinds out small gains and occasionally crashes can post a flattering Sharpe ratio and a damning Calmar ratio at the same time. Reading them together exposes that profile quickly.
Practice investing with Finelo
Build practical investing skills with guided lessons, simulator practice, and structured challenges.
Practical applications of the Calmar ratio
- Screening drawdown-sensitive strategies. Managed futures, trend-following, and hedge fund track records are conventionally compared on Calmar because drawdown discipline is the product being sold.
- Sizing risk for withdrawal portfolios. An investor drawing income cannot wait out unlimited drawdowns, so ranking candidate funds by Calmar highlights the ones that historically kept the floor closer.
- Comparing your own account across years. Recomputing the ratio annually shows whether your process is improving its return-to-pain balance or quietly degrading.
- Stress-testing a backtest. A backtested strategy with a stellar return but a Calmar ratio below its peers usually hides a drawdown an investor would never have sat through.
In every application, consistency matters: same window, same data frequency, same treatment of fees for every fund compared.
Limitations and criticisms of the Calmar ratio
- One event dominates. The ratio hangs on a single worst episode, so one crisis, or the luck of missing one, can define three years of measurement.
- Window sensitivity. A 36-month lookback forgets a crash in month 37. Rankings can flip when the window rolls past a bad quarter.
- No shape information. Two identical drawdowns can differ wildly in duration and recovery speed, which the ratio ignores.
- Backward-looking. Like every historical measure, it describes what happened, not what the strategy can do in a new regime.
- Easy to game in marketing. A fund launched right after a crash starts its record drawdown-free, flattering the ratio.
The practical fix is triangulation: read the Calmar ratio beside the full drawdown chart, the Sharpe or Sortino ratio, and a period long enough to include at least one genuine market stress.
What to know before deciding
Before ranking any fund or strategy on the Calmar ratio, check three inputs: whether the periods compared are identical, whether returns are net of fees, and whether the record includes a real stress episode. A high ratio built entirely in calm markets is an untested claim, not a proven trait. And match the metric to your own constraint: if you cannot tolerate a deep loss at any point, drawdown-based measures deserve extra weight in your review. This is educational context, not a recommendation.
Conclusion: integrating the Calmar ratio into your strategy
The Calmar ratio compresses a hard question, how much return did the worst stretch cost, into one comparable number. It shines for drawdown-sensitive investors and trend-following track records, and it misleads when the window is cherry-picked or the record has never met a crisis. Use it beside volatility-based metrics, never instead of them.
Next steps: pull three years of monthly values for a fund or your own account, find the peak-to-trough worst loss, and compute the ratio. Repeat for one alternative and compare. If you want guided practice with performance metrics like this, Finelo teaches investing concepts step by step.
Frequently asked questions
What is a good Calmar ratio?
Context sets the bar, but in managed-fund comparisons, higher simply means more annual return per unit of worst-case loss. Compare candidates over the same window and against peers with similar strategies rather than using a universal threshold.
Why is the Calmar ratio usually measured over three years?
The 36-month convention comes from managed-futures reporting practice: long enough to include meaningful stress, short enough to reflect the current strategy. Any window works if applied consistently across everything you compare.
How does the Calmar ratio differ from the Sharpe ratio?
The Sharpe ratio divides excess return by total volatility; the Calmar ratio divides return by maximum drawdown. Sharpe describes the average ride, Calmar describes the worst fall, and strategies with rare severe losses look very different under each.
Can the Calmar ratio be negative?
Yes. When the period's annualized return is negative, the ratio turns negative, signaling the strategy lost money on top of whatever drawdown it inflicted. Negative readings mainly tell you to look at the underlying numbers directly.
calmarratiometricevaluatinginvestmentperformance
Practice investing with Finelo
Build practical investing skills with guided lessons, simulator practice, and structured challenges.
About the author
Finelo Team
The Finelo Team creates practical investing and trading education designed to help beginners learn faster with structured challenges, simulator practice, and bite-sized lessons.
Keep reading — Related articles

Investing
Tax-gain harvesting vs. tax-loss harvesting
Compare realizing investment gains with realizing losses, including holding periods, wash sales, offsets, and portfolio tradeoffs.
Finelo Team

Investing
Stable value fund vs. money market fund
Compare investment structure, contract protections, transfer restrictions, net yields, and access inside a retirement account.
Finelo Team

Investing
Single-life vs. joint-life annuity
Compare income for one lifetime with continued payments to a survivor, using equal premiums and matching guarantee terms.
Finelo Team


