The Sortino ratio measures how much return an investment earns for each unit of downside risk it takes. You calculate it by subtracting the risk-free rate from the portfolio's return, then dividing by the downside deviation, the volatility of negative returns only. Unlike the Sharpe ratio, it ignores upside swings, so it punishes only the kind of volatility investors actually fear.
The Sortino Ratio: A Key Metric for Evaluating Investment Performance

The Sortino ratio measures how much return an investment earns for each unit of downside risk it takes. You calculate it by subtracting the risk-free rate from the portfolio's return, then dividing by the downside…
7 min read
Practice investing with Finelo
Build practical investing skills with guided lessons, simulator practice, and structured challenges.
Want to learn more?
Build practical investing skills with guided lessons, simulator practice, and structured challenges.
Explore FineloExplore Finelo's 28-day challenges
Turn learning into a daily habit with guided challenge paths.
This page is for beginner and intermediate investors comparing funds, portfolios, or strategies on risk-adjusted performance. You will learn the formula, what downside deviation means, how the Sortino ratio differs from the Sharpe ratio, where it works best, and its traps. This content is educational, not financial advice.
What is the Sortino ratio?
Standard deviation, the usual measure of investment risk, treats all volatility the same. A month where your portfolio jumps 8% raises measured risk exactly like a month where it drops 8%. That never quite matches how investors experience markets: nobody complains about upside surprises.
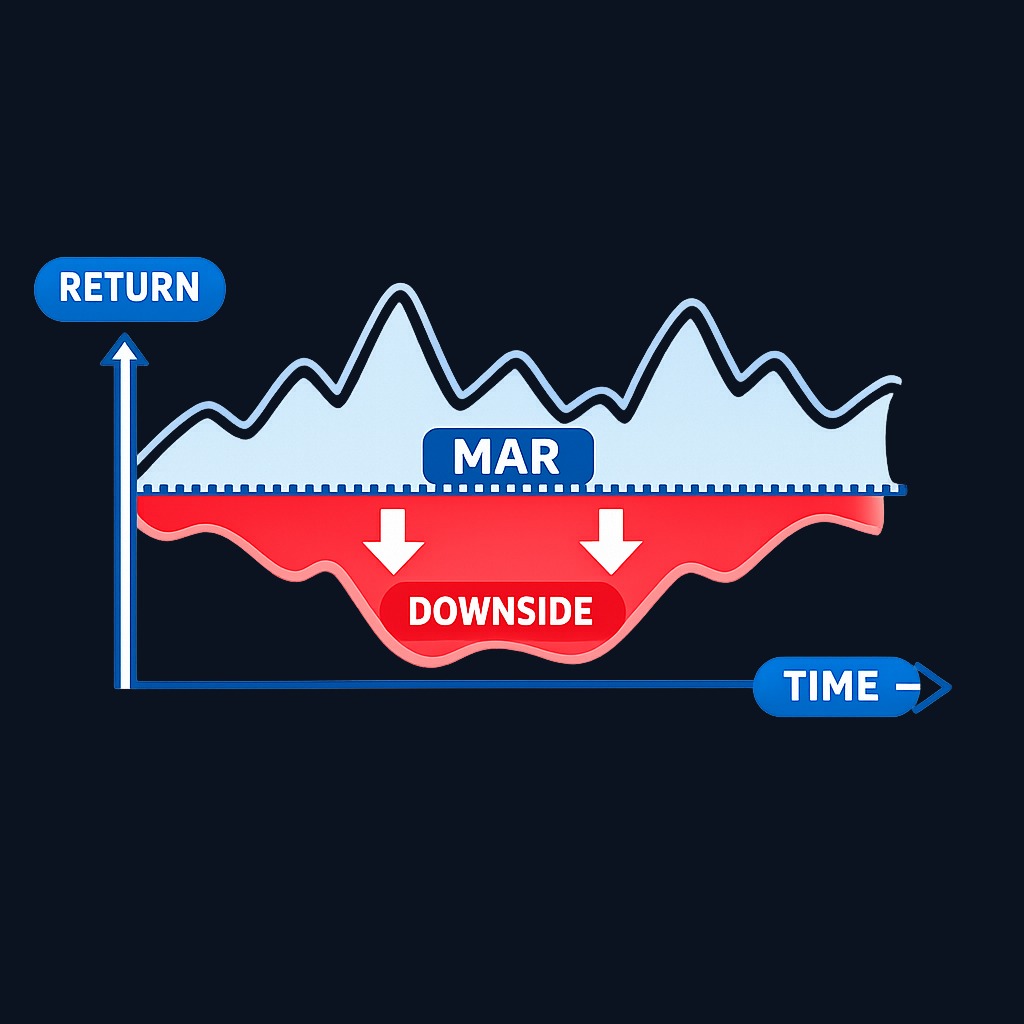
The Sortino ratio, named after researcher Frank Sortino, fixes that asymmetry. It keeps the same structure as other risk-adjusted return measures, excess return divided by risk, but defines risk as downside deviation: the dispersion of returns below a chosen minimum acceptable return, often the risk-free rate or zero. The result reads the same way as a Sharpe ratio: higher is better, because each unit of harmful volatility bought more excess return. It answers the investor's real question: how well was I paid for the losses I had to sit through?
How to calculate the Sortino ratio
The formula:
Sortino ratio = (portfolio return − risk-free rate) ÷ downside deviation
The common approach, as described in Schwab's explainer on gauging downside risk, subtracts the risk-free rate from the fund's actual or expected return and divides by the downside deviation, typically using annualized figures.
Worked example:
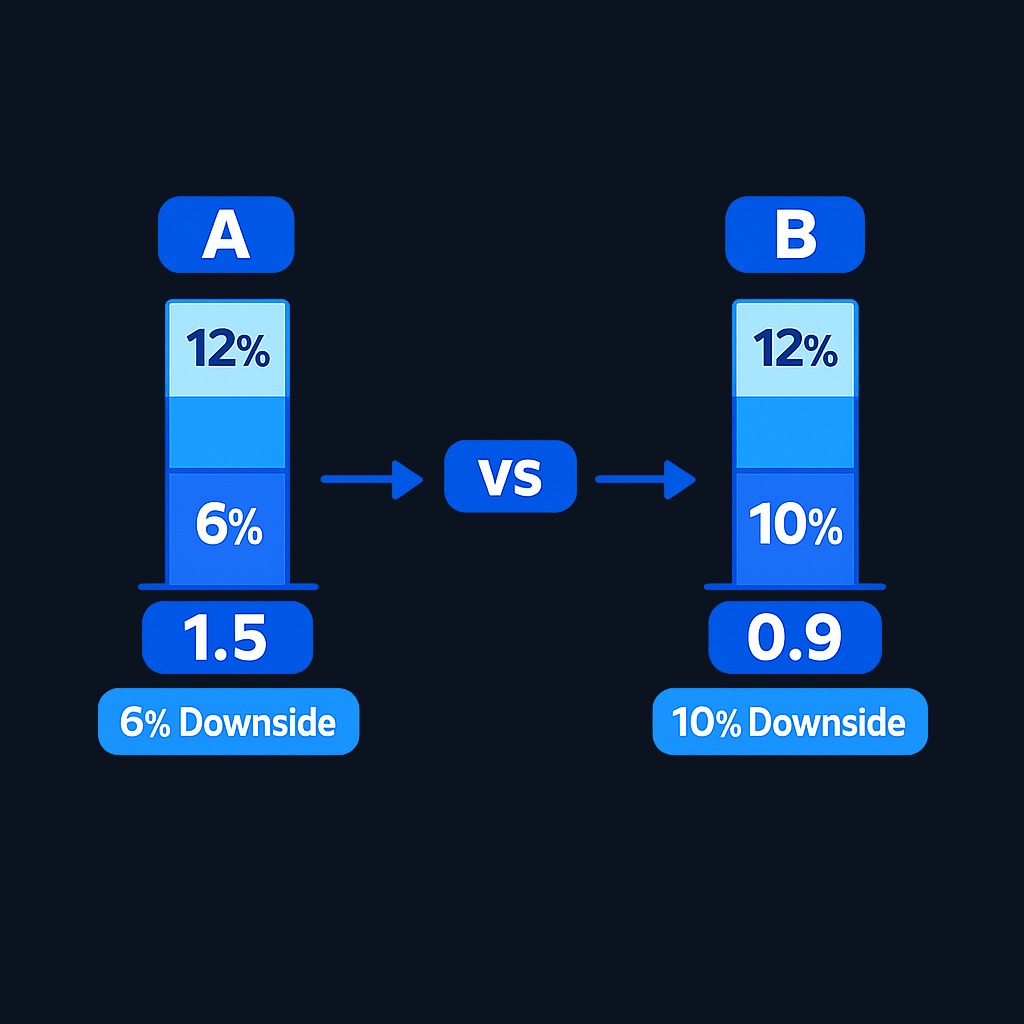
- Portfolio annual return: 12%
- Risk-free rate: 3%
- Downside deviation: 6%
Sortino ratio = (12 − 3) ÷ 6 = 1.5. Each unit of downside volatility was compensated with 1.5 units of excess return.
Now compare a second portfolio returning 12% with a downside deviation of 10%: its ratio is 0.9. Same headline return, but the first portfolio delivered it with far gentler losses along the way, which is exactly the distinction the metric exists to reveal.
Understanding downside risk and downside deviation
Downside deviation is the engine of the ratio, and it is worth understanding properly:
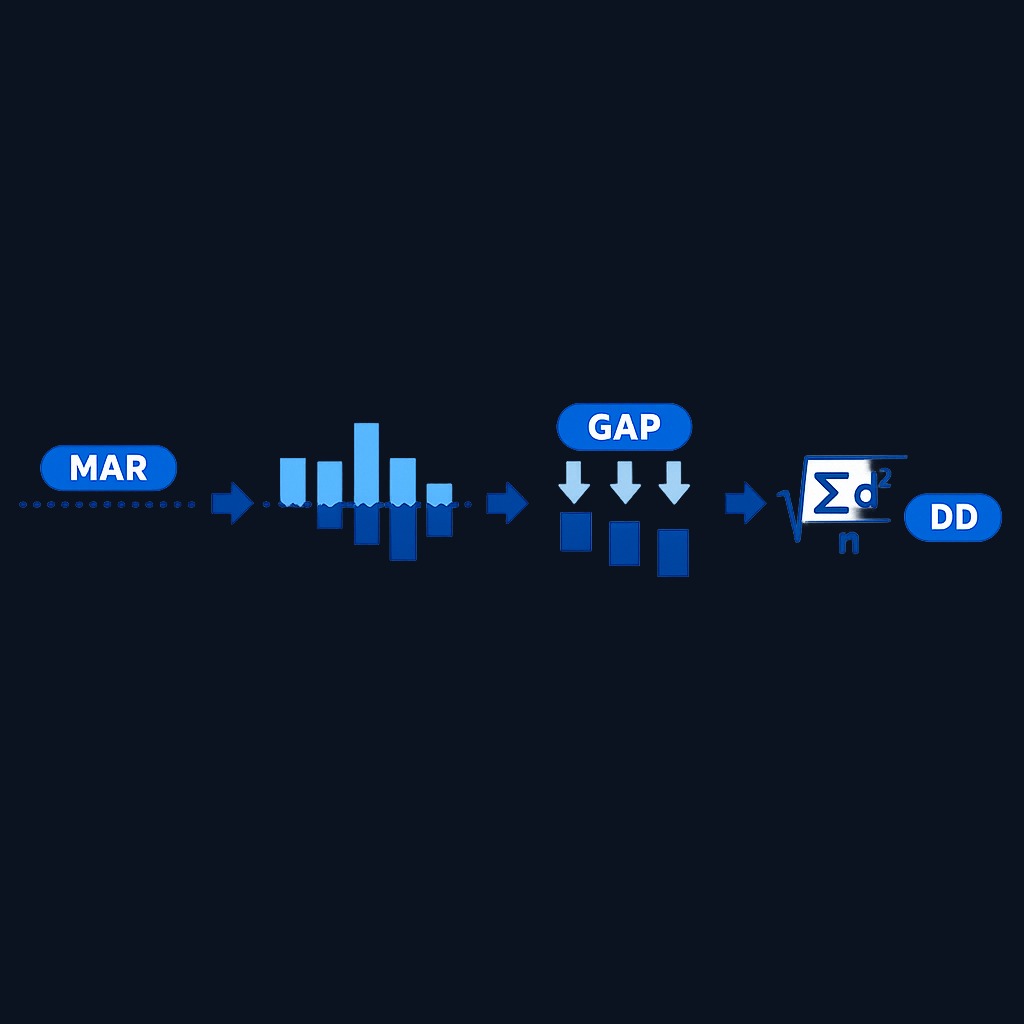
- Set a minimum acceptable return (MAR). Common choices are zero (any loss counts), the risk-free rate, or a target like an annual goal.
- Collect period returns. Monthly returns over three to five years are typical.
- Keep only the shortfalls. For each period below the MAR, measure the gap; periods at or above the MAR count as zero.
- Average the squared shortfalls and take the square root. The result is downside deviation, an annualized measure of how deep and frequent the bad periods were.
Two consequences follow. First, the MAR you choose changes the answer, so two sources quoting different Sortino ratios for the same fund may simply be using different thresholds. Second, strategies with steady small gains and rare sharp losses can show a low downside deviation until the rare loss arrives, a blind spot covered in the pitfalls below.
Sortino ratio vs Sharpe ratio
| Feature | Sharpe ratio | Sortino ratio |
|---|---|---|
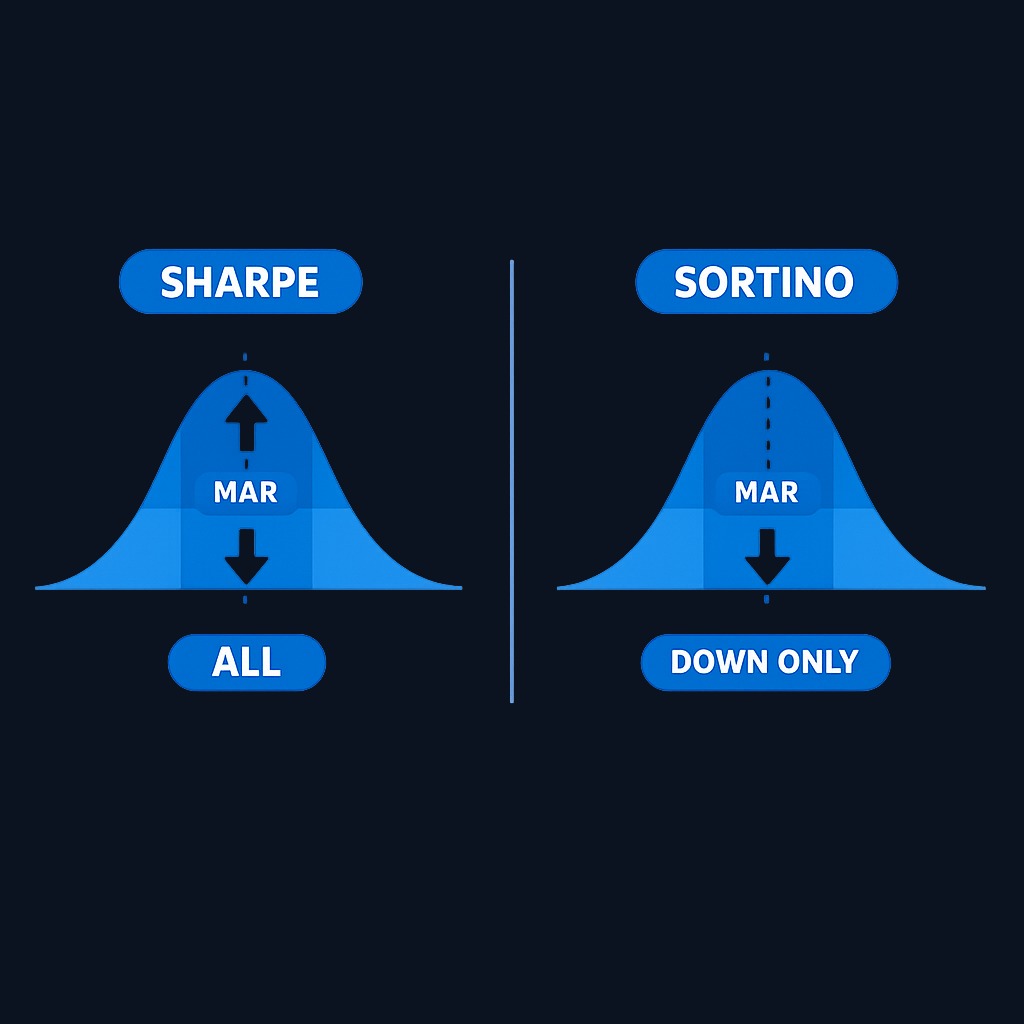
| Risk measure | Standard deviation of all returns | Downside deviation only |
| Upside volatility | Penalized | Ignored |
| Best suited for | Symmetric, diversified portfolios | Skewed or volatile strategies |
| Distortion risk | Punishes strong upside months | Sensitive to MAR choice and sparse loss data |
The two ratios usually agree on diversified portfolios, whose returns are roughly symmetric. They diverge on skewed strategies. A growth-heavy portfolio with explosive up months and controlled down months looks mediocre on Sharpe, its upside inflates measured risk, but strong on Sortino. In the reverse case, a strategy with smooth gains and occasional deep losses can look better on Sharpe than it deserves. Reading both ratios together, and asking why they disagree, tells you more about a strategy's shape than either number alone.
Practice investing with Finelo
Build practical investing skills with guided lessons, simulator practice, and structured challenges.
Practical applications of the Sortino ratio
- Comparing funds with similar returns. Between two funds returning 10%, the one with the higher Sortino ratio delivered that return with milder drawdowns, which most investors prefer to hold.
- Evaluating volatile assets. For strategies with lumpy, asymmetric returns, growth funds, options-based approaches, concentrated portfolios, the Sortino ratio gives a fairer read than Sharpe.
- Tracking your own portfolio. Computing the ratio annually shows whether the risk you feel in bad months is being paid for, or whether a calmer allocation earns similar returns with less pain.
- Screening with a retirement lens. Investors near withdrawal age care almost exclusively about downside, since losses close to withdrawals hurt most; the Sortino framing matches that priority.
In every use, the ratio is comparative, not absolute. A number means little alone; it becomes useful ranked against alternatives measured the same way, over the same period, with the same MAR.
What to know before deciding: pitfalls and caveats
- MAR inconsistency. Comparing ratios computed against different minimum acceptable returns is comparing apples to oranges. Confirm the threshold before trusting any published figure.
- Small samples of losses. If a strategy has few below-MAR periods, downside deviation rests on thin data, and the ratio can swing wildly when one bad month arrives.
- Past-tense measurement. Like every historical metric, the Sortino ratio describes what happened, not what comes next; regime changes reset the math.
- Manipulation through smoothing. Strategies that hold illiquid assets can report smoothed returns that understate true downside, flattering the ratio.
- Not a complete risk picture. The ratio says nothing about liquidity, leverage, concentration, or how deep a single worst-case drawdown ran. Pair it with maximum drawdown and plain return charts.
Treat the Sortino ratio as one strong lens among several. When it disagrees sharply with the Sharpe ratio or with drawdown history, that disagreement is the insight worth investigating.
Decision framework: using the Sortino ratio well
- Fix your comparison set. Same asset class, same time window, same data frequency.
- Confirm the MAR used by your source, or compute the ratios yourself with one consistent threshold.
- Read Sortino beside Sharpe. Agreement suggests symmetric returns; divergence reveals skew worth understanding.
- Check maximum drawdown. A high ratio with a tolerable worst loss is genuinely attractive; a high ratio hiding one catastrophic period is not.
- Weigh costs and constraints. Fees, taxes, and liquidity shape realized returns after the elegant math is done.
- Re-measure periodically. Ratios drift as markets shift; an annual re-check keeps comparisons current.
Before optimizing any ratio, secure the basics: regulators encourage holding a liquid emergency fund so market drawdowns never force you to sell investments during their worst stretch.
Conclusion and next steps
The Sortino ratio refines risk-adjusted performance to match how investors actually feel risk: it rewards excess return per unit of downside volatility and ignores harmless upside swings. Compute it consistently, mind the MAR, read it beside the Sharpe ratio and maximum drawdown, and use it to rank comparable strategies rather than to judge any investment in isolation.
Next steps: pull three to five years of monthly returns for two funds you are comparing, compute both Sortino and Sharpe with the same risk-free rate, and investigate any disagreement between them. For structured, beginner-friendly training on risk and performance metrics, Finelo offers guided investing education at your own pace.
Frequently asked questions
What is a good Sortino ratio?
Above 1 is generally considered acceptable, above 2 is strong, and above 3 is excellent for the measured period. Context rules, though: compare strategies over the same window and with the same minimum acceptable return, since both choices move the number.
When should I use the Sortino ratio instead of the Sharpe ratio?
Use Sortino when returns are skewed or volatile, for example growth strategies, concentrated portfolios, or options-based funds, because it does not punish upside volatility. For broadly diversified portfolios with symmetric returns, the two ratios usually tell the same story.
What risk-free rate should I use in the calculation?
Short-term government instruments, such as treasury bills, are the standard proxy for the risk-free rate. Whatever you choose, apply the same rate and the same period to every strategy you compare, or the ranking becomes meaningless.
Can the Sortino ratio be negative?
Yes. A negative ratio means the investment returned less than the risk-free rate over the period, so taking downside risk went unrewarded entirely. Persistent negative readings across multi-year windows are a strong signal to re-examine the strategy.
sortinoratiometricevaluatinginvestmentperformance
Practice investing with Finelo
Build practical investing skills with guided lessons, simulator practice, and structured challenges.
About the author
Finelo Team
The Finelo Team creates practical investing and trading education designed to help beginners learn faster with structured challenges, simulator practice, and bite-sized lessons.
Keep reading — Related articles

Investing
Tax-gain harvesting vs. tax-loss harvesting
Compare realizing investment gains with realizing losses, including holding periods, wash sales, offsets, and portfolio tradeoffs.
Finelo Team

Investing
Stable value fund vs. money market fund
Compare investment structure, contract protections, transfer restrictions, net yields, and access inside a retirement account.
Finelo Team

Investing
Single-life vs. joint-life annuity
Compare income for one lifetime with continued payments to a survivor, using equal premiums and matching guarantee terms.
Finelo Team


